

Abstract
We determined the pharmacokinetics of efavirenz in plasma and cerebrospinal fluid (CSF) over a 24-h dosing interval in a patient who had undergone a lumbar drain because of cryptococcal meningitis. Drug concentrations were determined by high-performance liquid chromatography-tandem mass spectrometry in paired CSF (n = 24) and plasma (n = 25) samples. The median plasma efavirenz concentration was 3,718 ng/ml (range, 2,439 to 4,952), and the median CSF concentration was 16.3 ng/ml (range, 7.3 to 22.3). The CSF/plasma area-under-the-curve ratio was 0.0044 corresponding to a CSF penetration of 0.44% of plasma.
INTRODUCTION
Antiretroviral therapy (ART) with two nucleoside analogue reverse transcriptase inhibitors in combination with a protease inhibitor or a non-nucleoside reverse transcriptase inhibitor dramatically reduces HIV replication, restores or preserves the immune system, and has considerably reduced the incidence of HIV-associated morbidity and mortality (10, 11). ART also effectively inhibits viral replication in the central nervous system (CNS) (6, 12), which has contributed to the reduction of the occurrence of severe neurological complications caused by HIV (5). Despite this, HIV-associated neurocognitive impairment remains prevalent (4, 13).
Efavirenz is one of the most widely used antiretroviral drugs. One large and two smaller studies have reported efavirenz concentrations in cerebrospinal fluid (CSF). Best et al. (3) reported data from 80 paired CSF and plasma samples, with a median CSF concentration of 13.9 ng/ml (interquartile range [IQR] = 4.1 to 21.2) and a CSF/plasma ratio of 0.005 (IQR = 0.0026 to 0.0076). One of the smaller studies reported undetectable CSF efavirenz concentrations (2), and the other study found CSF efavirenz concentrations in the same range as in the study by Best et al. (mean concentration, 11.1 ng/ml; range, 2.1 to 18.6 ng/ml) (14). In all of these studies, the efavirenz concentrations were determined only once in the dosing interval in a number of patients. In the present study we were able to analyze efavirenz concentrations in CSF and plasma in one patient at hourly intervals over 24 h after dosing.
MATERIALS AND METHODS
Case report.
In 2010, a 51-year-old man presented with cryptococcal meningitis and was diagnosed with HIV at the same time. He immediately started antifungal treatment with amphotericin B and flucytosine. The latter was switched to fluconazole after a few days after the resistance test had arrived. The patient initiated cART with a once daily fixed-dose combination tablet with emtricitabine at 200 mg, tenofovir at 245 mg, and efavirenz at 600 mg 2 weeks later. His CD4+ nadir was 0 cells × 106/liter. After a few weeks, the patient was discharged from the hospital but was readmitted after approximately 2 months because of worsening of symptoms. He had now developed hearing loss and pronounced vision impairment. When a lumbar puncture was performed, the intracranial pressure was very high (>50 cm H2O), and the patient was given a lumbar drain for a few days.
Bioanalytical methods.
CSF was collected once every hour for 24 h. The first sample was collected in the evening just after he had taken his fixed-dose combination tablet. Blood was drawn at the same time from a central venous catheter. The paired CSF and blood samples were centrifuged, and cell-free plasma and CSF was divided into aliquots and subsequently stored at −70°C until analysis.
The efavirenz concentrations in plasma and CSF were determined by high-performance liquid chromatography-tandem mass spectrometry (HPLC-MS/MS). The lower limit of quantitation was 8.6 ng/ml (plasma) and 1.1 ng/ml (CSF). Patient samples were analyzed in duplicate.
Briefly, all samples were extracted via protein precipitation (acetonitrile [500 μl of plasma and 200 μl of CSF]) with the addition of an internal standard. Efavirenz and internal standard were resolved on a reversed-phase C18 column (Atlantis 3 μm, 50 by 2.1 mm for plasma; Ascentis 3 μm, 100 by 2.1 mm for CSF) using a stepwise gradient mobile phase. Quantification was performed on a triple-quadrupole mass spectrometer (TSQ Quantum Ultra; Thermo, United Kingdom). The 11-point plasma calibration curve was linear over a concentration range of 8.6 to 10.2 ng/ml. The 8-point artificial CSF (Harvard Apparatus, Ltd., United Kingdom) calibration curve was linear over a concentration range of 1.1 to 51 ng/ml. Recovery for both matrices was >80%. The interassay and intra-assay coefficient of variation for the low-, medium-, and high-quality controls were <10% (plasma = 5.6 to 6.1% and CSF = 8.3 to 10%). Both assays were developed in accordance with U.S. Food and Drug Administration bioanalytical guidelines. The laboratory participates in an external quality assurance program (Association for Quality Assessment in TDM and Clinical Toxicology, Netherlands).
HIV-1 RNA in CSF and plasma was analyzed with the Cobas TaqMan HIV-1 version 2 (Hoffmann-La Roche, Basel, Switzerland). CD4+ T-cell determination was performed using routine methods. CSF parameters and the CD4+ cell count were measured in the local laboratory.
Pharmacokinetic data analysis.
Noncompartmental analysis (NCA) was performed (WinNonlin Phoenix; Pharsight Corp., Mountain View, CA) to determine areas under the curve for plasma and CSF (AUCplasma and AUCCSF, respectively) and a CSF/plasma AUC ratio.
Nonlinear mixed effects modeling was also applied using NONMEM (v. VI 2.0, level 1.1, double precision; ICON Development Solutions, Ellicott City, MD) with first-order estimation since the data were from a single subject, and standard errors of the estimates were determined with the covariance option of NONMEM. Efavirenz plasma data were initially assessed separately to ascertain starting estimates for a simultaneous analysis of plasma and CSF concentrations.
RESULTS
Efavirenz concentrations.
The patient had been receiving his fixed-dose combination tablet with emtricitabine, tenofovir, and efavirenz for 109 days and thus had reached steady-state levels of efavirenz in plasma and CSF. The median CSF efavirenz concentration (24 CSF samples) was 16.3 ng/ml (range, 7.3 to 22.3 ng/ml) and the median plasma concentration (25 samples) was 3,718 ng/ml (range, 2,439 to 4,952 ng/ml). The AUCplasma and AUCCSF were 86,694 and 381 ng·h/ml, respectively, and the CSF/plasma AUC ratio was 0.0044 (range, for individual time points, 0.003 to 0.009), corresponding to a CSF penetration of 0.44% of plasma. CSF and plasma efavirenz concentrations over the 24 h dosing interval are presented in Fig. 1.
Fig 1.
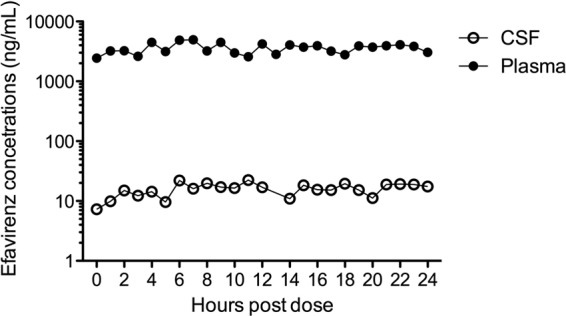
Efavirenz concentrations in CSF and plasma over a 24-h dosing interval.
Pharmacokinetic modeling.
Efavirenz concentrations in plasma were described by a one-compartment model with first-order absorption, and efavirenz concentrations in CSF were described by a one-compartment model. Plasma and CSF data were modeled simultaneously using differential equations (ADVAN6; Fig. 2). Plasma efavirenz was parameterized by apparent oral clearance (CLP), apparent volume of distribution (VP), and the absorption rate constant (ka), and CSF efavirenz was described by two rate constants, k23 and k30, representing the transfer of efavirenz from plasma to CSF and transfer out of the CSF compartment, respectively. Transfer back to the plasma compartment from the CSF (k32) was assumed to be zero to prevent overparameterization of the model and to reduce issues concerning parameter identifiability. Residual variability was described by a proportional model for both plasma and CSF. Initially, ka and VP were estimated with poor precision (relative standard error >150%), but adjusting the plasma volume to that of the separate efavirenz model stabilized the estimates. Changing initial estimates or fixing other model parameters did not significantly impact model estimates. Intercompartmental clearance from plasma to CSF (CLI) was derived using k23 and VP (k23 = CLI/VP) and to determine clearance from the CSF (CLCSF) the volume of distribution for CSF (VCSF) was fixed to the physiological volume of CSF of 150 ml (k30 = CLCSF/VCSF) (8). The CLI and CLCSF were 0.7 liter/h (12.1 ml/min) and 0.05 liter/h (0.9 ml/min), respectively. The AUCplasma and AUCCSF were similar to those obtained using NCA (plasma, 86,282 ng·h/ml versus 86,694 ng·h/ml; CSF, 380 ng·h/ml versus 381 ng·h/ml). Furthermore, k23/k30 = 0.0044, the CSF/plasma ratio. Plasma half-life was determined to be 46 h. The efavirenz pharmacokinetic parameters are shown (Table 1).
Fig 2.
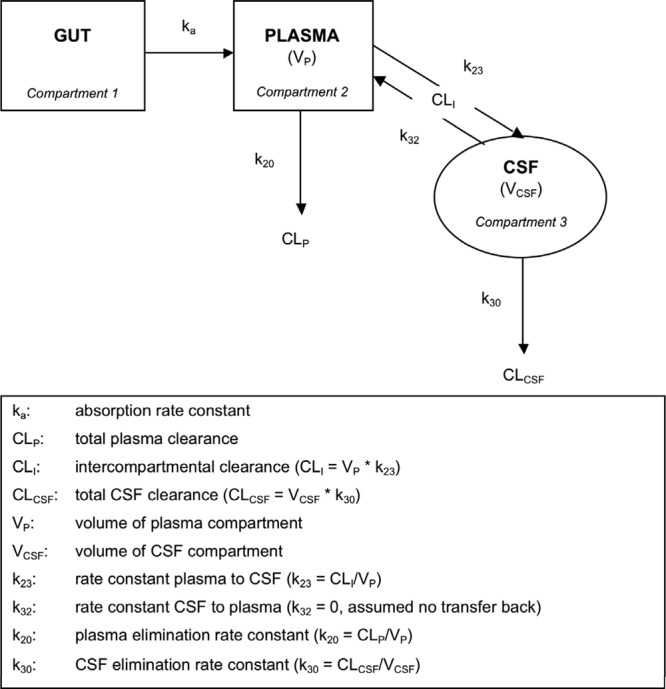
Schematic of efavirenz transfer through plasma and CSF compartments.
Table 1.
Efavirenz pharmacokinetic parameters obtained from simultaneous modeling of concentrations determined in plasma and CSF over 24 h in a single HIV-infectedpatient who was stable on efavirenz-based therapy and undergoing a lumbar draina
| Parameter | Estimate | RSE (%) |
|---|---|---|
| Plasma | ||
| CLP (liters/h) | 6.95 | 3.8 |
| VP (liters) | 461 (fix) | |
| ka (h−1) | 0.21 | 57.0 |
| k20 (h−1) | 0.015 | NA |
| AUCplasma (mg · h/liter) | 86.28 | NA |
| Half-life (h) | 45.95 | NA |
| Residual error (%) | 18.7 | 18.8 |
| CSF | ||
| k23 (h−1) | 0.0016 | 74.7 |
| k30 (h−1) | 0.36 | 74.0 |
| CLC (liters/h) | 0.054 | |
| V3 (liters) | 0.15 (fix) | |
| CLI (liters/h) | 0.73 | NA |
| AUCCSF (mg · h/liter) | 0.38 | NA |
| Residual error (%) | 23.7 | 27.9 |
RSE, relative standard error; NA, not applicable. Percent RSE = (SEestimate/estimate) × 100; k20 = CLP/VP; AUCplasma = dose/CLP; half-life = ln(2)/k20; CLCSF = k30 × VCSF; CLI = k23 × VP; AUCCSF = AUCplasma × (k23/k30). Definitions: CLP, total plasma clearance; VP, volume of plasma compartment; ka, absorption rate constant; k20, plasma elimination rate constant; AUC, area under the curve; CLC, total CSF clearance; V3, volume of CSF compartment; CLI, intercompartmental clearance; k23, rate constant plasma to CSF; k30, CSF elimination rate constant.
CSF measurements.
CSF analysis from the day before the concentration determinations showed an intact blood-brain barrier with an albumin ratio of 8.4 (normal reference value < 10.2) and pleocytosis with a white blood cell count of 47 × 106/liter. The IgG index was elevated, 0.94 (normal reference value of <0.63). CSF neurofilament light chain was very high: 35,900 ng/liter (normal reference value < 890). We have no CSF HIV RNA determination from this date, but the pretreatment CSF HIV RNA level was 5.66 log10 copies/ml. This decreased to 2.44 log10 copies/ml after 5 months of treatment.
DISCUSSION
Drug concentrations in the CSF are often used as surrogates for drug concentrations in the brain. For most CSF pharmacokinetic studies of antiretroviral drugs, paired CSF and plasma samples drawn at various time points after the last dose are obtained in a number of patients. However, the ratio of a single CSF/plasma sample pair often does not give a useful index of the CSF drug exposure because of the divergent drug distribution properties in each of the two compartments, i.e., in blood (and systemic tissues) and in CNS (including CSF). Thus, to better understand the relation between drug concentrations in CSF and plasma, it is desirable to measure multiple CSF and plasma concentrations over the duration of the dosing interval, and to construct an area under the curve (AUC) concentration for each compartment and then calculate the AUCCSF/AUCplasma ratio. This ratio more truly reflects the relative exposure of CSF compared to plasma. This is often not suitable in clinical trials, but we were able to perform repeated CSF sampling in a patient who had undergone a lumbar drain. He was under treatment for cryptococcal meningitis, but at the time of CSF and blood sampling the albumin ratio had normalized, indicating an intact blood-brain barrier. The CSF efavirenz concentrations we found over the dosing interval and the CSF/plasma efavirenz ratio were in the same range as previously published data (median CSF concentration of 16.3 ng/ml and CSF/plasma ratio of 0.44%) (3, 14). Pharmacokinetic modeling was performed to obtain an indication of the rate of distribution of efavirenz to the CSF compartment and also clearance of the CSF compartment. Due to poor parameter identifiability, it was necessary to simplify the model and assume no back transfer from the CSF to the plasma compartment, although in reality this is probably unlikely. In order to determine CLCSF, knowledge of VCSF was necessary. However, this would not be possible unless efavirenz was dosed into the CSF compartment itself. Therefore, VCSF was assumed to equal the physiological volume of CSF. Based on the model, efavirenz crosses relatively slowly into and out of the CSF (k23 and CLI of 0.0016 h−1 and 0.7 liter/h, respectively, and k30 and CLCSF of 0.36 h−1 and 0.05 liter/h, respectively), although it is important to note that parameter estimates were obtained based on single subject data and may not be representative of a population. However, to our knowledge, this is the first time efavirenz pharmacokinetic parameters have been determined simultaneously in plasma and CSF.
The CSF concentrations observed in our patient are low compared to plasma, but they still exceed the reported drug concentration needed to inhibit 50% of wild-type viral replication (IC50) in a protein-free medium, 1.3 ng/ml (1), by ∼12-fold.
Efavirenz is a small lipophilic molecule (316 Da) and is not a substrate for P glycoprotein. However, it is >99.5% bound to plasma proteins, which makes the unbound fraction very small (<0.5%). Since no drug is being actively transported back to the systemic circulation, unbound plasma drug concentrations should be similar to the total CSF concentrations. We did not directly measure unbound concentrations, but the estimated unbound plasma concentration in our patient is 18.6 ng/ml (0.5 × 3,718 ng/ml). This unbound fraction is similar to the total CSF concentration (16.3 ng/ml), which indicates that unbound plasma efavirenz diffuses passively into the CSF and that it is not actively being transported out of the CNS by P glycoprotein.
Because of its long half-life, efavirenz concentrations maintain relatively stable in plasma and CSF between doses. In a compartment like the CSF, drugs tend to have even longer half-lives and less variation of the drug concentration than in plasma because of slower influx and efflux of the drug. Studies have shown that the intrapatient variation of plasma efavirenz concentrations is low but that there is marked interpatient variability (9). Some of this interpatient variability can be explained by genetic factors. A polymorphism in the gene that encodes the hepatic enzyme primarily responsible for efavirenz metabolism (CYP2B6) has been associated with greater plasma efavirenz exposure and with increased CNS side effects (7). Although CSF efavirenz concentrations have been reported in single samples obtained from individual patients, the present study adds information on the overall exposure of efavirenz in CSF during a dosing interval.
ACKNOWLEDGMENTS
This study was supported by the Swedish Society for Medical Research. V.W. performed the analysis, L.D. performed the pharmacokinetic modeling, D.B. was involved in the analysis and preparation of the manuscript, and A.Y. interpreted results and wrote the manuscript. All authors have read and approved the manuscript.
We thank Kayode Ogungbenro (University of Manchester, Manchester, United Kingdom) for useful discussions regarding the pharmacokinetic modeling.
Footnotes
Published ahead of print 11 June 2012
REFERENCES
- 1. Acosta E, et al. 2011. Novel method to assess antiretroviral target trough concentrations using in vitro susceptibility data. 18th Conference on Retroviruses and Opportunistic Infections, Boston, MA [Google Scholar]
- 2. Antinori A, et al. 2005. Efficacy of cerebrospinal fluid (CSF)-penetrating antiretroviral drugs against HIV in the neurological compartment: different patterns of phenotypic resistance in CSF and plasma. Clin. Infect. Dis. 41:1787–1793 [DOI] [PubMed] [Google Scholar]
- 3. Best BM, et al. 2010. Efavirenz concentrations in CSF exceed IC50 for wild-type HIV. J. Antimicrob. Chemother. 66:354–357 [DOI] [PMC free article] [PubMed] [Google Scholar]
- 4. Cysique LA, Maruff P, Brew BJ. 2004. Prevalence and pattern of neuropsychological impairment in human immunodeficiency virus-infected/acquired immunodeficiency syndrome (HIV/AIDS) patients across pre- and post-highly active antiretroviral therapy eras: a combined study of two cohorts. J. Neurovirol. 10:350–357 [DOI] [PubMed] [Google Scholar]
- 5. d'Arminio Monforte A, et al. 2004. Changing incidence of central nervous system diseases in the EuroSIDA cohort. Ann. Neurol. 55:320–328 [DOI] [PubMed] [Google Scholar]
- 6. Gisslen M, Hagberg L. 2001. Antiretroviral treatment of central nervous system HIV-1 infection: a review. HIV Med. 2:97–104 [DOI] [PubMed] [Google Scholar]
- 7. Haas DW, et al. 2004. Pharmacogenetics of efavirenz and central nervous system side effects: an Adult AIDS Clinical Trials Group study. AIDS 18:2391–2400 [PubMed] [Google Scholar]
- 8. Levy MN, Stanton BA, Koeppen MD. 1990. Membranes are composed of lipids and second messengers and signals, p 66–67 In Berne RM, Levy MN. (ed), Principles of physiology. C. V. Mosby Co, New York, NY [Google Scholar]
- 9. Marzolini C, et al. 2001. Efavirenz plasma levels can predict treatment failure and central nervous system side effects in HIV-1-infected patients. AIDS 15:71–75 [DOI] [PubMed] [Google Scholar]
- 10. May M, et al. 2007. Prognosis of HIV-1-infected patients up to 5 years after initiation of HAART: collaborative analysis of prospective studies. AIDS 21:1185–1197 [DOI] [PMC free article] [PubMed] [Google Scholar]
- 11. May MT, et al. 2006. HIV treatment response and prognosis in Europe and North America in the first decade of highly active antiretroviral therapy: a collaborative analysis. Lancet 368:451–458 [DOI] [PubMed] [Google Scholar]
- 12. Mellgren A, et al. 2005. Cerebrospinal fluid HIV-1 infection usually responds well to antiretroviral treatment. Antivir. Ther. 10:701–707 [PubMed] [Google Scholar]
- 13. Simioni S, et al. 2010. Cognitive dysfunction in HIV patients despite long-standing suppression of viremia. AIDS 24:1243–1250 [DOI] [PubMed] [Google Scholar]
- 14. Tashima KT, et al. 1999. Cerebrospinal fluid human immunodeficiency virus type 1 (HIV-1) suppression and efavirenz drug concentrations in HIV-1-infected patients receiving combination therapy. J. Infect. Dis. 180:862–864 [DOI] [PubMed] [Google Scholar]