

Abstract
Proteomics aspires to elucidate the functions of all proteins. Protein microarrays provide an important step by enabling high-throughput studies of displayed proteins. However, many functional assays of proteins include untethered intermediates or products, which could frustrate the use of planar arrays at very high densities because of diffusion to neighboring features. The nucleic acid programmable protein array (NAPPA), is a robust, in situ synthesis method for producing functional proteins just-in-time, which includes steps with diffusible intermediates. We determined that diffusion of expressed proteins led to cross-binding at neighboring spots at very high densities with reduced inter-spot spacing. To address this limitation, we have developed an innovative platform using photolithographically-etched discrete silicon nanowells and used NAPPA as a test case. This arrested protein diffusion and cross-binding. We present confined high density protein expression and display, as well as functional protein-protein interactions, in 8,000 nanowell arrays. This is the highest density of individual proteins in nano-vessels demonstrated on a single slide. We further present proof of principle results on ultra-high density protein arrays capable of up to 24,000 nanowells on a single slide.
Keywords: Nanowells, Protein microarrays, NAPPA, piezoelectric printing, high density arrays, functional proteins, in situ synthesis, proteome on chip, silicon microwells, diffusion-free
INTRODUCTION
A fundamental aspiration in proteomics is to achieve the ability to probe protein function at the proteome scale. Protein microarrays, which entail the display of thousands of proteins in a defined pattern at high spatial density, provide an important step towards this goal. They have been used successfully to screen thousands of proteins as biomarkers, protein binders, and enzyme substrates1–7.
Protein microarrays work particularly well when they are employed to examine reactions in which the proteins on the array bind tightly to a labeled analyte or are themselves covalently modified by a labeled moiety. However, they run into challenges with enzymatic assays that must occur in solution and/or when the desired product is diffusible. Diffusion from one feature on the array to the next becomes a problem at high spatial density on planar surfaces. This is particularly true when working with small molecules or in circumstances when it would be desirable to address different substrates to different proteins on the array, as in a many-to-many experiment. An ideal solution to this problem would be the development of a protein microarray platform that prevents feature-to-feature diffusion. The study of many protein activities will require such a platform especially in the high-throughput setting.
Conventional protein microarrays have been produced by printing purified proteins in an array format. However arrays produced in this fashion face several challenges: the cost and effort required for purifying, printing, storing and handling of thousands of proteins; concerns about long term protein and array stability; batch-to-batch variation due to changes in each massive protein purification process; and highly variable yields of proteins produced and displayed under these conditions. Nucleic Acid Programmable Protein Array (NAPPA) technology8 is a robust in situ method that overcomes the challenges associated with the conventional protein printing approach and allows for freshly synthesizing thousands of proteins from printed cDNA arrays, just-in-time for assay. More than ~20,000 different proteins have been successfully displayed on NAPPA with minimal bias towards sizes and types of protein and highly normalized protein levels9. NAPPA protein arrays have been used in novel biomarker discovery studies and functional studies10–12.
During the in situ synthesis phase of NAPPA, both mRNA and nascent polypeptides are untethered to the array surface, creating the possibility of diffusion of these species away from original features and potentially resulting in inappropriate capture at neighboring locations. Thus, NAPPA could face the challenge of signal cross-talk and therefore could be useful as a test system for developing a diffusion-free microarray platform. NAPPA arrays are routinely produced in densities of ~2,000 proteins with center-to-center feature spacing of approximately 625 microns. At this density, the cross-talk between adjacent spots due to diffusion measured less than 2%9. However, there are obvious advantages to seeking densities >2000 features per array for protein microarrays, including lower sample consumption, improved data quality, increased throughput and reduced cost. At such higher densities, the problems of diffusion-related issues become a greater possibility for NAPPA.
In this study, we sought to determine whether the in situ synthesis for NAPPA reactions suffered from diffusion-related cross-talk at higher array densities. We then sought to solve the problem of diffusion with an innovative silicon nanowell platform that used the NAPPA protein arrays system as a test case. This platform enables confined biochemical reactions in physically separated nanowells. The NAPPA method was adapted to nanowell array substrates produced using silicon micro fabrication technology, which enables high-throughput, high-fidelity fabrication of nanowell substrates. We have also simultaneously developed a high-throughput precise and accurate liquid dispensing system to align and dispense genes and reagents into individual wells. After in vitro expression of proteins in the nanowells with a sealed cover, we demonstrated successful protein display in wells with negligible diffusion. Preliminary results also indicated functional protein that allows detection of known protein-protein interactions. Our development represents a major step forward in the production of functional human proteome protein arrays without diffusion of soluble species from feature to feature.
RESULTS
NAPPA on glass slides
We tested the effect of reduced spacing of features using NAPPA. Diffusion of expressed proteins captured at neighboring locations became significant as separation distances (center-to-center) drop below 400 microns on NAPPA. This is demonstrated in Figure 1 where genes were printed on planar glass in two different array densities: low density array with 750 micron period (Figure 1b) and high density array with 375 micron period (Figure 1c). The features were printed in a pattern such that the center feature, containing cDNA + printing-mix, was surrounded by control features, where the control features contained only capture antibody (no genes). This configuration is highly sensitive for detection of cross-contamination because the control features do not produce protein that could compete with diffused protein. As illustrated in the 3-D rendering (Fig. 1), there was significant diffusion to neighboring features at 375 micron spacing compared to minimal diffusion for the 750 micron period array. The halo of signal around the center spot seen in both images is probably due to protein diffusion followed by physisorption to amine coated glass surface, and the shift of halo off-center may be due to fluid drift.
Figure 1.

Diffusion on glass slides for NAPPA at high array densities. (a) Schematic of NAPPA on glass, with array spacing less than 400 microns. In-situ expressed proteins diffuse in the lysate mixture and cross-bind at neighboring locations. As shown in the print layout schematic to the left, for both (b) and (c), only the center spot was printed with DNA + printing-mix, while the surrounding spots were printed with just printing-mix consisting of anti-GST capture antibodies (no DNA). (b) NAPPA on glass slides with feature period of 750 microns, showing no observable diffusion. (c) NAPPA on glass slides with feature period of 375 microns, showing visible diffusion.
NAPPA in silicon nanowells
To enable high density printing without diffusion, we replaced planar glass slides with slides comprising an array of nanowells on the silicon substrate and sealed the wells during protein expression (Figure 2). Adapting the NAPPA method to the nanowell platform enables physically confining protein expression and the ensuing antibody capture in nanoliter volumes (volume of nanowells ≤ 5 nanoliter). Expressed proteins are free to diffuse within the individual sealed wells until they are captured by the anti-GST antibodies in the wells. Semi-spherical nanowell arrays, approximately 250 microns in diameter and 75 microns deep with a period of 375 microns, were fabricated on silicon wafers, diced into the shape of glass slides (1 inch × 3 inch), and used as substrates for protein display. Monolithic crystalline silicon wafers were chosen due to the established silicon processing techniques that allow for well-controlled and inexpensive fabrication of nanowell array slides. Wells were etched by photo-patterning silicon-nitride mask layer deposited on silicon, using HNA isotropic etch chemistry (see also Materials and Methods). Nanowells etched in silicon were coated with 100 nm of dry oxide grown at 1,000 C in an oxidation furnace. Semiconducting silicon acts to quench surface fluorescence due to its semi-metallic nature, hence requiring 100 nm thin layer of oxide dielectric layer. Additionally thermally grown silicon dioxide serves as high quality glass surface for subsequent aminopropyltriethoxy silane (APTES) coating and appropriate NAPPA chemistry.
Figure 2.

(a) Schematic of NAPPA in Silicon Nanowells; NAPPA samples were piezo dispensed in the wells, which were then filled with lysate and press-sealed with a compliant gasket film supported on a glass slab. Protein expression and subsequent capture by substrate-bound antibody occurred in confined nano-liter volumes, resulting in diffusion-free high density protein arrays (b) Method of fabrication of silicon nanowells; surface functionalization, printing and NAPPA expression (c) Cross-sectional SEM image of nanowells with 375 micron spacing (d) Engineering Arts au302 8-head piezo printer, dispensing on-the-fly into silicon nanowells (e) Schematic of vacuum assisted filling mechanism developed in-house to effectively fill silicon nanowells with IVTT lysate. Silicon nanowell slide is placed in the gasket cutout and sandwiched between the two frames. When the assembly is clamped a thin microfluidic chamber is formed over the slide, enabling filling and sealing proteins (f) Picture showing sealed nanowells filled with lysate.
Non-contact piezoelectric dispensing
Standard solid pin printing would not suffice for the precision that is required in printing expression mixtures into the nanowells. Thus, we developed a new method using piezoelectric printing. NAPPA expression mixtures were piezo-jet dispensed into APTES coated silicon nanowells (SiNW) using Engineering Arts' 8-tip au302 piezo printer, capable of aligning and printing at the center of the nanowells at very high-speeds (Figure 2c). One of the key challenges of nanowell technology is precise alignment and dispensing of many “unique” printing solutions onto a batch of nanowell slides in a suitable time frame. Special dispense hardware and software were developed that utilized the 8 head non-contact “on-the-fly” dispense technology resulting in a batch processing time of a few hours to fill ~7,000 wells each slide, on a batch of up to 8 nanowell slides (details in methods section).
Vacuum assisted SiNW filling of nanowells
After printing, NAPPA SiNW slides were first subjected to vacuum infiltration by de-ionized water for 5 to 10 minutes followed by vacuum infiltration by SuperBlock TBS (Thermo Scientific) solution for 5 to 10 minutes and subsequently incubated at room temperature and atmospheric pressure on a rocking shaker for 30 to 60 minutes. The slides were then rinsed thoroughly with de-ionized water and dried under a gentle stream of filtered compressed air. Any unbound or loosely bound material (DNA, anti-GST, BSA, BS3 crosslinker or trace DMSO) should wash away during these pre-hybridization blocking and washing steps; thereby minimizing the chance for material to break loose during subsequent steps.
After blocking, the SiNW slides were incubated with rabbit reticulocyte lysate-(RRL) based in vitro transcription and translation (IVTT) system for protein expression and capture in situ. When this viscous lysate was directly introduced onto a slide with an array of nanowells, it exhibited a tendency to flow over the nanowells entrapping air without filling the wells (data not shown). This is an expected behavior due to liquid surface-tension where cohesive-forces tend to minimize the liquid surface area. To address this problem, we developed a vacuum-assisted filling procedure (Figure 2d,e), which works independently of: the size and shape of nanowells; the fluid properties of filling liquid; or the properties of nanowell substrate. Similar approaches to filling small wells have been previously described13–15.
In this procedure an enclosed air-tight micro-chamber is created over the nanowell slide by sandwiching the SiNW slide between a gasket cutout and two planar surfaces as shown in Figure 2d. An inflexible metal plate forms the bottom planar surface, while the top surface is made by sticking a thin film of flexible transparent silicone on thick inflexible glass slab held on a metal frame. Two 1.5 mm wide 100 micron thick adhesive-backed plastic strips (not shown in schematic) are applied manually along the long edges of the SiNW slide. The assembly is clamped on all sides and pressed together to reduce the height (thickness) of air-tight micro-chamber to approximately 100 microns, with the top surface compressing the surrounding gasket cutout and resting on the side strips on SiNW slide.
Lysate was introduced into the syringe attached to the port (a 1 mm diameter hole on top plate) as shown, and was held in-place inside the syringe due to the airtight micro-chamber (Figure 2d). Air inside the micro-chamber and air dissolved in the lysate solution was removed by applying a gradual vacuum (up to 28 inches Hg) for 2 minutes. Using a three way solenoid valve (adapters and solenoid not shown) the syringe was then instantly switched from vacuum to atmospheric pressure. Once switched, the pressure difference, i.e., atmospheric pressure acting on the lysate solution against vacuum in the wells, drove the liquid into filling all the nanowells effectively in less than two seconds. This in-house developed vacuum-assisted filling system ensured a good pressure seal by virtue of the transparent flexible silicone film supported on glass slab (inset image of sealed silicon nanowells, Figure 2e). The silicone film, under applied pressure, conforms around the narrow top edges of wells, to seal the nanowells. The sealed assembly was then incubated for protein expression and binding.
Minimal protein diffusion between nanowells using SiNW
To test protein expression and capture in silicon nanowells and to assess the level of cross-talk between the nanowells, sixteen different genes were printed into every other nanowell, (schematic of print pattern in Figure 3a). Intervening wells were left empty, and signals observed in these intervening wells would indicate the level of cross-contamination due to diffusion. Pico-green staining of printed DNA showed the expected alternate fluorescent signals (Figure 3b), confirming precise “on-the-fly” dispensing by the piezo printer into the wells. When the nanowells were left un-sealed (without clamping) during protein expression, spillover signal was observed in intervening wells (Figure 3c). Whereas, display of expressed and captured proteins in sealed nanowells is shown in Figure 3d. As seen from the image and its 3D signal profile, there was no discernible diffusion of proteins from expression wells to neighboring empty wells.
Figure 3.
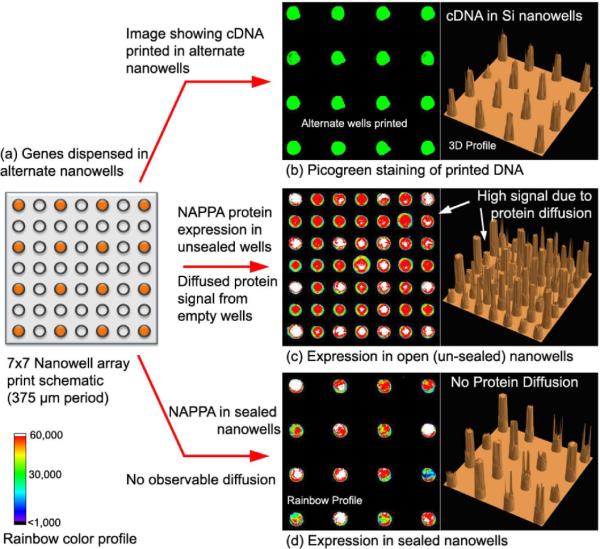
Confined protein expression in sealed nanowells. (a) Schematic of 16 different genes printed into alternate wells, in a 7 × 7 nanowell array (375 μm period) (b) Pico-green staining of printed DNA; to the right - 3D profile of the signal showing intensity plotted against x & y coordinates (c) Expression in unsealed nanowells detected using an anti-GST antibody. Expressed proteins diffuse locally and physically-adsorb inside neighboring wells, displaying strong signal in all the wells (d) Expression in sealed nanowells detected using an anti-GST antibody. The empty wells in-between do not show any signal, implying no diffusion of protein from sealed wells. 3D profile of protein display to the right clearly shows diffusion-free signals in sealed nanowells. (Refer to Supporting Information for cDNA print details).
High Density NAPPA Protein Array
After successfully demonstrating precise dispensing and confined expression with a small number of genes, we produced SiNW slides with an array of 8,000 nanowells (SiNW-8K chip, 375um feature distances). These were used to confirm diffusion-free expression across the footprint of a full size microscopic slide for a large number of genes in sealed nanowells (Figure 4). Two-hundred eighty-seven (287) randomly selected genes, 192 from Vibrio cholerae and 96 from human, were printed in blocks of 6 rows × 48 columns, which was repeat printed 24 times (supplementary text). TP53, FOS and JUN proteins were interspersed in the block pattern, with p53 protein repeat printed twice in each block. The DNASU logo at the bottom was printed by pooling 8 different genes into a single composition (no p53). The print pattern also included empty nanowells around the above array, and surrounding the logo at the bottom, as negative controls. Consistent and precise dispensing across the whole array was shown by the picogreen staining of printed DNA (Figure 4a). Overall, the array showed consistently high protein expression as detected by anti-GST staining (Figure 4b).
Figure 4.

SiNW-8K : 8,000 silicon nanowell array with 160 rows × 50 columns, 375 micron array spacing. 287 different genes were piezo-jet printed in a group, into 6-rows and 48-columns. This group pattern was repeat-printed 24 times. Including the DNASU logo, the SiNW-8K array has a total of over 7,000 protein expression spots. (a) Pico-green staining of printed DNA. The dark locations in the printed array block and surrounding the `DNASU' logo correspond to empty nanowells. (b) Display of all expressed proteins detected by an anti-GST antibody. (c) Display of p53 proteins detected by an anti-p53 antibody (d) Corresponding 3D intensity profile of p53 proteins showing very high signal to background, with no diffusion.
Diffusion-free high density protein arrays
As can be seen from Figure 4b, the principle aim of this work - to solve the issue of diffusion in very high density arrays - has been successfully addressed. Almost all empty spots around the print block and empties surrounding the DNASU logo show no significant signal above background.
To further confirm diffusion-free protein display, we used a more sensitive test to assess diffusion by probing the high density NAPPA in SiNW with antigen specific antibodies against TP53 protein to determine if its signal was observed in neighboring wells (Figure 4c). The ratio of average signal from neighbor spots to average signal from cognate p53 spots was calculated to be just 1.34%. This confirms that very high density in-situ protein arrays can be successfully produced using nanowells to arrest protein diffusion and cross-binding. Analyzing the p53 signals, the coefficient of variation (CV) between the 48 repeat spots is calculated to be 12.84%. Discounting the one outlier low-signal p53 spot on bottom right side, the CV was calculated to be 8.5%.
Functional studies on nanowell protein arrays
To investigate the functionality of the proteins produced in nanowells, we examined protein-protein interactions using the well-established FOS-JUN interaction16 as a surrogate assay for proper folding and functionality of proteins expressed on SiNW slides with the same printing pattern as above (Figure 5a). Query DNA that encoded HA-tagged FOS was mixed in the IVTT lysate mixture and co-expressed with the array proteins. Antibodies to FOS or HA-tag were then used to reveal specific interactions of FOS with JUN displayed on the array. The query protein HA-FOS did not have the GST tag and could not be captured by anti-GST antibody co-spotted in each well. HA-FOS would be detected only if they could bind to the captured array target proteins tethered to the well.
Figure 5.

Protein-protein interactions in nanowells. (a) Zoomed in image of protein expression in nanowells of a larger array as detected by an anti-GST antibody. FOS and JUN protein features indicated by arrows. (b) Same scale image showing confined FOS expression as detected by an anti-FOS antibody. (c) FOS-JUN interaction with HA-Fos as the query protein and detected with the same anti-FOS antibody as in (b). (d) Fos-Jun interaction assay with HA-Fos as the query, detected by an anti-HA antibody.
Highly specific antibodies were selected for the interaction study. If no query DNAs were added to the expression system, anti-HA did not detect any reactivity (data not shown) and anti-Fos only detected FOS spots on expressed arrays (Figure 5b). Figure 5b also further confirmed confined expression of FOS in individual wells on silicon nanowell arrays using above described vacuum assisted filling and sealing method. Figure 5c shows specific Fos-Jun interaction with HA-FOS protein as a query and detected by an anti-Fos antibody. As antibodies against proteins of interest are not always available, we also demonstrated detection of protein interactions by using antibodies against the HA tag on the query protein (Figure 5d). The spot positions in Figure 5d correspond to the exact same interaction spots as in Figure 5c.
Ultra-high density protein arrays
To determine if the silicon nanowell platform is also compatible with a human proteome-on-chip scale, we produced two versions of ultra-high density arrays with 24,000 features. Displaying 24,000 proteins on a single array requires nanowells with array spacing of 225 microns or below. 225 micron period silicon nanowells were produced in both round-well and square-well geometries (Figure 6). While the round nanowells were produced using HNA etch chemistry, square nanowells were produced using KOH anisotropic etch chemistry on Si (100) wafers with well-depth of approximately 100 micron. Etch anisotropy of square wells which produces deep wells with no significant lateral etching is of interest for further higher density protein arrays. Protein expression and capture were tested in these chips using the standard protocol. Comparable signals were achieved on these 24,000 feature arrays relative to those on the 8,000 feature arrays indicating robust protein expression on these ultra-high density arrays and relieving concerns of potential expression lysate exhaustion in smaller volume wells. Bright signals along the edges of the square nanowells in Figure 6f are speculated to be due to preferential aggregation of proteins and dye at the sharp edges. Sequential KOH anisotropic etching followed by short-duration HNA isotropic etching to round-off all the sharp edges is expected to solve this issue, and forms part of future work. It is notable that even at this density there was no significant cross-talk signal in neighboring wells in both round and square nanowell geometries, confirming effective limiting of diffusion in sealed silicon nanowells compatible with proteome-on-chip technology.
Figure 6.

Demonstration of very high density protein arrays towards 24,000 proteins on a single slide. 225 micron period nanowell arrays were produced in round-well and square-well geometries, by using different silicon wet-etch chemistries. In both cases, control printing-mix spots (no cDNA) were printed in a plus pattern around the central expression spots. Neither the control printing-mix spots comprising antibodies nor the surrounding empty spots show significant protein diffusion signal (a) Scanning electron microscope (SEM) images of 225 micron period round silicon wells in top and cross-sectional views; inset shows optical microscope image (b) Schematic of print layout in 225 micron period round nanowell array (c) Corresponding protein array display showing high intensity from center cDNA spots with no significant diffusion background (d) SEM and optical microscope images of square nanowell arrays in top and cross-sectional views (e) Schematic of print layout in 225 micron period square nanowell array (f) Expressed proteins are displayed with strong signals (square shaped) from cDNA printed nanowells, while printing-mix printed wells show signals at the sharp edges of the well (and empty wells show no discernible signal). Signal from square edges is thought to be due to preferential aggregation of proteins and dye at the sharp edges of square wells.
DISCUSSION
Establishing a platform to study protein biochemical properties in a multiplexed and high-throughput fashion is important for many different biomedical research areas. Protein microarrays represent one such platform. NAPPA is an innovative alternative to conventional protein arrays and bypasses the challenges associated with protein expression, purification and storage. NAPPA is a particularly flexible protein microarray format because a customized array can be created simply by re-arraying a series of plasmids encoding proteins of interest. However, transcription and translation on a planar surface entails the presence of intermediates that can diffuse before capture by co-spotted capture reagent. Furthermore, planar surfaces are limited to assays that do not have diffusible products or reactants that need to remain local.
The use of silicon micro fabrication technology for miniaturization of bio-analytical methods was first proposed by Manz17, 18 et al for developing integrated total chemical analysis systems. Nanowells have found uses in many areas of biomedical research that require multiplexing and high-throughput processing in isolated spaces. Fujji19–21 et al first reported parallel cell-free synthesis of proteins on an integrated microchip. Yamamoto et al demonstrated cell-free protein synthesis in a PDMS glass hybrid microreactor array chip, monitoring protein expression in micro-channel reactors that were integrated with temperature controller mechanisms. However these proof-of-concept studies were limited to a small number of proteins expressed in a 5 mm × 5 mm area. Several recent studies22–24 using nanowell arrays of nano- to pico-liter volumes have been demonstrated in the fields of nucleic acid sequencing and cell based immuno-research. Immune cells or beads coated with nucleic acids were applied to the array surface en masse without requiring a pre-defined pattern of dispensing. One of the first reports on the study of protein functionality in nanowell arrays involves 112 yeast kinases25 in a low-density array format of 144 microwells with 1.4 mm diameters. However in that study, kinases were expressed, purified and manually added to wells, limiting their applicability. Angenendt26 et al reported protein expression in micro-liter volume wells and further demonstrated protein functionality by enzymatic inhibition assays. Further, pico-liter volume wells fabricated in flexible PDMS substrates were used for in-situ expression of proteins27, with just 1 to 5 picoliters of lysate per well required for detectable signal from expressed GFP molecules. However none of these studies have successfully demonstrated high yield expression of a large number of proteins in a high density format, which is compatible with functional protein studies.
In this study, we have developed a silicon nanowell based protein microarray platform that not only addresses the cross-talk problem in high density NAPPA but also has the potential of performing other biochemical reactions in these nano-reaction vessels that are not possible on traditional planar protein array format. For example, the kinetics of enzymatic assays that release fluorescent products might be monitored directly in each well or various post translational modifications could be performed on displayed proteins. Our NAPPA SiNW platform builds upon the mature semi-conductor industry for substrate micro fabrication. Although most of our experiments used a density of 8,000 features per standard glass slide with center-to-center distance of 375um, we do not foresee any obstacles of increasing densities many times higher and we have run proof-of-concept expression on arrays with 24,000 features.
We have observed minor regional variations in signal intensities within the curved nanowells (Figure 4). These variations are also observed on flat surfaces and probably represent the previously reported `coffee-ring' effect caused by non-uniform settling of precipitates during drying of microarray spots28. Other contributors may include incomplete filling of the nanowells during printing causing some signal attenuation towards the edges, and/or non-uniform surface irregularities due to wet-etching of the nanowells. Further development is underway to fine-tune process protocols, to minimize the above observed variation and improve reproducibility.
CONCLUSION
The feasibility of in situ high density protein expression in nanowells to mitigate spot-to-spot cross diffusion and array cross-talk has been successfully demonstrated. The next steps in our research involve further improving and fine-tuning of the SiNW fabrication and protein expression protocols, ramping up production capability to rapidly produce consistently high quality protein microarrays, producing higher density proteins for full proteome-on-chip capability with over 24,000 proteins per nanowell array slide.
MATERIALS AND METHODS
Micro fabrication of silicon nanowells
Six inch diameter Silicon <100> wafers were used as starting material for producing silicon nanowell (SiNW) slides. Each 6-inch wafer yielded 6 slides per wafer after dicing. In future, larger diameter wafers are expected to yield higher number of slides per wafer, making SiNW slides very inexpensive. Standard semiconductor processing techniques were used to fabricate the SiNW slides, as depicted in the schematic in Figure 2. Silicon nanowell slides were fabricated at Arizona State University Center for Solid State Electronics Research. The wafers were first coated with 300 nm of LPCVD low stress nitride at 835 C, which acts as a mask layer for wet etching of nanowells. Wafers were then spin-coated with 1 micron thick AZ 3312 positive photo resist (AZ Electronic Materials Inc), followed by soft bake on a hotplate at 100 C for 2 minutes. Photo lithography masks with circular features were used to expose the resist on an OAI photo mask aligner, for producing round nanowells of desired diameter and spacing. The photo resist was then developed in AZ300 MIF developer for 45 seconds, and hard-baked on hotplate at 100˚C for 2 minutes. Reactive ion etching using CHF3 - O2 plasma was used to etch away the nitride film, and open circular array pattern on the nitride layer. Photo resist layer was washed away using acetone.
Isotropic and anisotropic etching of nanowells
Isotropic etching of wells was selected as preferred method compared to anisotropic etching. While anisotropic etching has the advantage of producing wells of high aspect ratio, it results in sharp facets and edges inside the nanowell. It was observed that piezo dispensed DNA/plasmid mixture and the expressed proteins, both tend to aggregate and bind preferentially at these sharp edges. To attain a relatively uniform protein binding inside the wells a semi-spherical curved surface was produced using isotropic etching. Furthermore, etch mask and etch time were designed so as to produce a circular flat surface at the bottom of the semi-sphere, which acts as a substrate for dispensed DNA/plasmid mixture. Flat circular surface at the bottom of the semi-spherical wells has the advantage of distributing the dispensed DNA and the resulting protein binding, uniformly over the flat area, compared to a fully-spherical curved bottom which tends to aggregate these into a spot at the center.
HNA silicon etchant29 was prepared by mixing hydrofluoric acid (49%), nitric acid (70%) and glacial acetic acid (98%) in the ratio of 2.75:1.75:1. All chemicals were procured from Sigma Aldrich. HNA etchant is an extremely aggressive and corrosive mixture. It has to be prepared in special acid baths, and requires very careful handling with special disposal methods, by well trained personnel. HNA mixture etches silicon at an approximate rate of 3 microns per minute. 30 minute etch of silicon produced wells with depths ranging from 60 microns to 80 microns, depending on diameter of the circular openings in the nitride-mask. Anisotropic pyramidal wells (Figure 6f, proof of concept 225 micron period array) were produced by patterning square openings in nitride mask layer on Si (1000) wafers, and etching in 30% KOH solution at 80°C. Hot KOH is an aggressive chemical, strong corrosive, and needs to be handled by well-trained users. The sharp edges produced by anisotropic etching can be smoothed using a two-step process, with an HNA isotropic etch step following an anisotropic etch process, and forms part of future work.
Silicon surface at the bottom of the etched wells quenches fluorescent signal during assay, query detection in later steps. Hence a thin film of silicon dioxide was thermally grown that acts as a suitable dielectric and also mimics the glass surface of regular NAPPA arrays. For this purpose, wafers with etched wells were cleaned in Piranha mixture (1:1 mix of sulfuric acid and hydrogen peroxide) followed by a ten second clean in buffered oxide etch (1: 6 mixture of HF and NH4F). Piranha mixture and buffered oxide etch are both very aggressive chemicals, to be prepared in special containers, and needs to be handled by well-trained users. A dry oxide of thickness 100 nm was thermally grown at 1,000°C in Tystar 4600 oxygen furnace. After oxide growth the mask nitride film is etched away in hot phosphoric acid (185°C). The resultant wafers have round wells coated with uniform 100 nm oxide thin film, with spacing in-between wells comprising of semi-metallic silicon surface. This structure has the additional advantage that fluorescent signal is emitted from glass-like the oxide coated wells, while the metal-like silicon surface in un-etched areas in-between the wells quenches any fluorescent emission (apparent in Figure 3d - no seal case), providing a good contrast in fluorescent imaging. Finally the wafers were diced into microscope-slide sizes yielding silicon nanowell (SiNW) substrates for high density NAPPA protein arrays.
Amine functionalization of silicon dioxide surface
Prior to piezo dispensing of DNA/plasmid mixture into the nanowells the surface of the wells was coated with amino-propyl-triethoxy-silane (APTES) monolayer. It has been demonstrated that for producing NAPPA protein arrays, an amine terminated surface that acts as suitable substrate to adhere to dispensed DNA/plasmid mixture is required. For this purpose SiNW substrates were first cleaned in Piranha mixture (1:1 H2S04 and H202) for a period of 15 minutes. Piranha mix is a strong oxidant that cleans any residual organic materials on the SiNW substrates and oxidizes surface of silicon oxide to produce silanol (-SiOH) surface terminations. SiNW slides are then immersed in 2% solution of APTES in acetone, for a period of 15 minutes, followed by thorough rinse in acetone and DI water, to produce uniform monolayer of APTES molecules.
High speed piezo printing in nanowells
Piezo printing was accomplished using an au302 piezo dispense system (www.engineeringarts.com) with a newly developed integrated alignment system for nanowell slides. The alignment system consists of a micrometer angular alignment fixture, look-down camera, transfer arm and vacuum tray. Nanowell slides are aligned one at a time on the alignment fixture using the look down camera and then transferred with the transfer arm to the vacuum tray. A row of aligned nanowell slides placed on the vacuum tray can then be dispensed “on-the-fly” with the head moving at 175mm / sec resulting in a peak speed of 50 wells per second using 8 dispense head. Each nanowell is filled with 800 picoliters of printing solution (cDNA + printing-mix).
Following piezo printing of cDNA in nanowell array, NAPPA SiNW slides were stored in dry, sealed container until the time of use.
DNA preparation
Sequence-verified, full-length cDNA expression plasmids in the T7-based mammalian expression vector pANT7_cGST or pANT7-nHA were obtained from Arizona State University, Biodesign Institute, Center Personal Diagnostics, DNASU and are publicly available (http://dnasu.asu.edu/DNASU/). The high-throughput preparation of high-quality supercoiled DNA for cell-free protein expression was performed as described30. For protein interaction assay, larger quantities of query DNA were prepared using standard Nucleobond preparation methods (Macherey-Nagel Inc., Bethlehem, PA).
Protein expression
Protein display was performed as described9. Displayed proteins were detected using Tyramide signal amplification (TSA, Life technologies, Carlsbad, CA) with a monoclonal anti-GST antibody (Cell signaling Inc., Danvers, MA) and HRP-labeled anti-mouse antibody (Jackson ImmunoResearch, West Grove, PA). Anti-p53 monoclonal antibody (Santa Cruz Biotechnology, Santa Cruz, CA) was used for p53 specific signal detection to assess diffusion.
Protein interaction
Protein interaction was performed as described9. FOS gene in pANT7-nHA was added to the RRL expression mixture at a concentration of 1 ng / ml. HA-tagged FOS bound to interaction partners on array was detected either by gene specific anti-FOS (Santa Cruz Biotechnology, Santa Cruz, CA) antibody or tag specific antibody (anti-HA, Convance) followed by Alexa fluor labeled secondary antibodies (Life technologies, Carlsbad, CA).
Supplementary Material
ACKNOWLEDGEMENTS
This project was supported by National Institutes of Health grant, 5R42RR031446-01 and a research grant from the Early Detection Research Network 5U01CA117374.
REFERENCES
- 1.Gibson DS, Qiu J, Mendoza EA, Barker K, Rooney ME, Labaer J. Circulating and synovial antibody profiling of juvenile arthritis patients by nucleic acid programmable protein arrays. Arthritis Res Ther. 14(2):R77. doi: 10.1186/ar3800. [DOI] [PMC free article] [PubMed] [Google Scholar]
- 2.Anderson KS, Sibani S, Wallstrom G, Qiu J, Mendoza EA, Raphael J, Hainsworth E, Montor WR, Wong J, Park JG, Lokko N, Logvinenko T, Ramachandran N, Godwin AK, Marks J, Engstrom P, Labaer J. Protein microarray signature of autoantibody biomarkers for the early detection of breast cancer. J Proteome Res. 10(1):85–96. doi: 10.1021/pr100686b. [DOI] [PMC free article] [PubMed] [Google Scholar]
- 3.Lin YY, Lu JY, Zhang J, Walter W, Dang W, Wan J, Tao SC, Qian J, Zhao Y, Boeke JD, Berger SL, Zhu H. Protein acetylation microarray reveals that NuA4 controls key metabolic target regulating gluconeogenesis. Cell. 2009;136(6):1073–84. doi: 10.1016/j.cell.2009.01.033. [DOI] [PMC free article] [PubMed] [Google Scholar]
- 4.Loch CM, Cuccherini CL, Leach CA, Strickler JE. Deubiquitylase, deSUMOylase, and deISGylase activity microarrays for assay of substrate preference and functional modifiers. Mol Cell Proteomics. 10(1) doi: 10.1074/mcp.M110.002402. M110 002402. [DOI] [PMC free article] [PubMed] [Google Scholar]
- 5.Jones RB, Gordus A, Krall JA, MacBeath G. A quantitative protein interaction network for the ErbB receptors using protein microarrays. Nature. 2006;439(7073):168–74. doi: 10.1038/nature04177. [DOI] [PubMed] [Google Scholar]
- 6.Stiffler MA, Chen JR, Grantcharova VP, Lei Y, Fuchs D, Allen JE, Zaslavskaia LA, MacBeath G. PDZ domain binding selectivity is optimized across the mouse proteome. Science. 2007;317(5836):364–9. doi: 10.1126/science.1144592. [DOI] [PMC free article] [PubMed] [Google Scholar]
- 7.Hudson ME, Pozdnyakova I, Haines K, Mor G, Snyder M. Identification of differentially expressed proteins in ovarian cancer using high-density protein microarrays. Proc Natl Acad Sci U S A. 2007;104(44):17494–9. doi: 10.1073/pnas.0708572104. [DOI] [PMC free article] [PubMed] [Google Scholar]
- 8.Ramachandran N, Hainsworth E, Bhullar B, Eisenstein S, Rosen B, Lau AY, Walter JC, LaBaer J. Self-assembling protein microarrays. Science. 2004;305(5680):86–90. doi: 10.1126/science.1097639. [DOI] [PubMed] [Google Scholar]
- 9.Ramachandran N, Raphael JV, Hainsworth E, Demirkan G, Fuentes MG, Rolfs A, Hu YH, LaBaer J. Next-generation high-density self-assembling functional protein arrays. Nature Methods. 2008;5(6):535–538. doi: 10.1038/nmeth.1210. [DOI] [PMC free article] [PubMed] [Google Scholar]
- 10.Wright C, Sibani S, Trudgian D, Fischer R, Kessler B, LaBaer J, Bowness P. Detection of multiple autoantibodies in patients with ankylosing spondylitis using nucleic acid programmable protein arrays. Mol Cell Proteomics. 11(2) doi: 10.1074/mcp.M9.00384. M9 00384. [DOI] [PMC free article] [PubMed] [Google Scholar]
- 11.Ceroni A, Sibani S, Baiker A, Pothineni VR, Bailer SM, LaBaer J, Haas J, Campbell CJ. Systematic analysis of the IgG antibody immune response against varicella zoster virus (VZV) using a self-assembled protein microarray. Mol Biosyst. 6(9):1604–10. doi: 10.1039/c003798b. [DOI] [PubMed] [Google Scholar]
- 12.Montor WR, Huang J, Hu Y, Hainsworth E, Lynch S, Kronish JW, Ordonez CL, Logvinenko T, Lory S, LaBaer J. Genome-wide study of Pseudomonas aeruginosa outer membrane protein immunogenicity using self-assembling protein microarrays. Infect Immun. 2009;77(11):4877–86. doi: 10.1128/IAI.00698-09. [DOI] [PMC free article] [PubMed] [Google Scholar]
- 13.Jackman RJ, Duffy DC, Ostuni E, Willmore ND, Whitesides GM. Fabricating large arrays of microwells with arbitrary dimensions and filling them using discontinuous dewetting. Analytical Chemistry. 1998;70(11):2280–2287. doi: 10.1021/ac971295a. [DOI] [PubMed] [Google Scholar]
- 14.Moerman R, van Dedem GWK. A coverslip method for controlled parallel sample introduction into arrays of (sub)nanoliter wells for quantitative analysis. Analytical Chemistry. 2003;75(16):4132–4138. doi: 10.1021/ac020432n. [DOI] [PubMed] [Google Scholar]
- 15.Liu HB, Ramalingam N, Jiang Y, Dai CC, Hui KM, Gong HQ. Rapid distribution of a liquid column into a matrix of nanoliter wells for parallel real-time quantitative PCR. Sensors and Actuators B-Chemical. 2009;135(2):671–677. [Google Scholar]
- 16.Newman JRS, Keating AE. Comprehensive identification of human bZIP interactions with coiled-coil arrays. Science. 2003;300(5628):2097–2101. doi: 10.1126/science.1084648. [DOI] [PubMed] [Google Scholar]
- 17.Manz A, Harrison DJ, Verpoorte EMJ, Fettinger JC, Paulus A, Ludi H, Widmer HM. Planar Chips Technology for Miniaturization and Integration of Separation Techniques into Monitoring Systems - Capillary Electrophoresis on a Chip. Journal of Chromatography. 1992;593(1–2):253–258. [Google Scholar]
- 18.Harrison DJ, Fluri K, Seiler K, Fan ZH, Effenhauser CS, Manz A. Micromachining a Miniaturized Capillary Electrophoresis-Based Chemical-Analysis System on a Chip. Science. 1993;261(5123):895–897. doi: 10.1126/science.261.5123.895. [DOI] [PubMed] [Google Scholar]
- 19.Fujii T. Microreactor for bio-chemical reaction. Petrotech (Tokyo) 2000;23(11):932–938. [Google Scholar]
- 20.Takahiko N, Teruo F. Parallel Cell-free Protein Synthesis on an Integrated Microchip. Monthly journal of the Institute of Industrial Science, University of Tokyo. 2001;53(2):96–99. [Google Scholar]
- 21.Yamamoto T, Hino M, Kakuhata R, Nojima T, Shinohara Y, Baba Y, Fujii T. Evaluation of cell-free protein synthesis using PDMS-based microreactor Arrays. Analytical Sciences. 2008;24(2):243–246. doi: 10.2116/analsci.24.243. [DOI] [PubMed] [Google Scholar]
- 22.Fan JB, Gunderson KL, Bibikova M, Yeakley JM, Chen J, Garcia EW, Lebruska LL, Laurent M, Shen R, Barker D. Illumina universal bead arrays. DNA Microarrays Part A: Array Platforms and Wet-Bench Protocols. 2006;Vol. 410:57–+. doi: 10.1016/S0076-6879(06)10003-8. [DOI] [PubMed] [Google Scholar]
- 23.LaFratta CN, Walt DR. Very high density sensing arrays. Chemical Reviews. 2008;108(2):614–637. doi: 10.1021/cr0681142. [DOI] [PubMed] [Google Scholar]
- 24.Lim CT, Zhang Y. Bead-based microfluidic immunoassays: The next generation. Biosensors & Bioelectronics. 2007;22(7):1197–1204. doi: 10.1016/j.bios.2006.06.005. [DOI] [PubMed] [Google Scholar]
- 25.Zhu H, Klemic JF, Chang S, Bertone P, Casamayor A, Klemic KG, Smith D, Gerstein M, Reed MA, Snyder M. Analysis of yeast protein kinases using protein chips. Nature Genetics. 2000;26(3):283–289. doi: 10.1038/81576. [DOI] [PubMed] [Google Scholar]
- 26.Angenendt P, Nyarsik L, Szaflarski W, Glokler J, Nierhaus KH, Lehrach H, Cahill DJ, Lueking A. Cell-free protein expression and functional assay in nanowell chip format. Analytical Chemistry. 2004;76(7):1844–1849. doi: 10.1021/ac035114i. [DOI] [PubMed] [Google Scholar]
- 27.Kinpara T, Mizuno R, Murakami Y, Kobayashi M, Yamaura S, Hasan Q, Morita Y, Nakano H, Yamane T, Tamiya E. A picoliter chamber array for cell-free protein synthesis. Journal of Biochemistry. 2004;136(2):149–154. doi: 10.1093/jb/mvh102. [DOI] [PubMed] [Google Scholar]
- 28.Yunker PJ, Still T, Lohr MA, Yodh AG. Suppression of the coffee-ring effect by shape-dependent capillary interactions. Nature. 2011;476(7360):308–11. doi: 10.1038/nature10344. [DOI] [PubMed] [Google Scholar]
- 29.Schwartz B, Robbins H. Chemical Etching of Silicon .4. Etching Technology. Journal of the Electrochemical Society. 1976;123(12):1903–1909. [Google Scholar]
- 30.Qiu J, LaBaer J. Nucleic acid programmable protein array a just-in-time multiplexed protein expression and purification platform. Methods Enzymol. 2011;500:151–63. doi: 10.1016/B978-0-12-385118-5.00009-8. [DOI] [PMC free article] [PubMed] [Google Scholar]
Associated Data
This section collects any data citations, data availability statements, or supplementary materials included in this article.