

Abstract
Prion diseases are a group of fatal neurodegenerative disorders characterized by the accumulation of prions in the central nervous system. The pathogenic prion (PrPSc) possesses the capability to convert the host-encoded cellular isoform of the prion protein, PrPC, into nascent PrPSc. The present work aims at providing novel insight into cellular response upon prion infection evidenced by synchrotron radiation infrared microspectroscopy (SR-IRMS). This non-invasive, label-free analytical technique was employed to investigate the biochemical perturbations undergone by prion infected mouse hypothalamic GT1-1 cells at the cellular and subcellular level. A decrement in total cellular protein content upon prion infection was identified by infrared (IR) whole-cell spectra and validated by bicinchoninic acid assay and single-cell volume analysis by atomic force microscopy (AFM). Hierarchical cluster analysis (HCA) of IR data discriminated between infected and uninfected cells and allowed to deduce an increment of lysosomal bodies within the cytoplasm of infected GT1-1 cells, a hypothesis further confirmed by SR-IRMS at subcellular spatial resolution and fluorescent microscopy. The purpose of this work, therefore, consists of proposing IRMS as a powerful multiscreening platform, drawing on the synergy with conventional biological assays and microscopy techniques in order to increase the accuracy of investigations performed at the single-cell level.
Keywords: Prion, PrPSc, synchrotron radiation, infrared microspectroscopy, atomic force microscopy, chemical mapping
1. Introduction
Transmissible spongiform encephalopathies (TSE), or prion diseases, are fatal and incurable neurodegenerative disorders affecting animals and humans alike. They include bovine spongiform encephalopathy of cattle, scrapie of sheep and goats, chronic wasting disease of deer, moose, and elk, and Creutzfeldt−Jakob disease (CJD), fatal familial insomnia, and Gerstmann−Sträussler−Scheinker syndrome in humans.
Prion diseases can manifest as sporadic, genetic, or iatrogenic maladies. The unique agent responsible for these disorders is the pathological scrapie prion protein (PrP) conformer, PrPSc or prion (1). The process responsible for PrPSc formation involves a conformational change in which a portion of an α-helix and a coil of the cellular form of PrP, PrPC, is refolded into a β-sheet structure (2). This process is called prion conversion.
To date, no comprehensive global study has been carried out describing the biochemical perturbations occurring at single cell level upon prion replication. Some clues provided by gene profiling analyses revealed that, upon prion infection, an alteration of lipid metabolism and a general dis-regulation of genes encoding proteases and proteases inhibitors is established (3). Prion-infected cells are less resistant to oxidative stress (4), and several signal cascades involved in neuroprotection, cell growth, and apoptosis are affected (5). A deeper knowledge of the molecular rearrangements undergone by prion infected cells may be useful to understand the mechanism of PrPC to PrPSc conversion and to develop more effective therapeutic intervention.
One major limit of common methodologies used for investigating cellular biochemistry and physiology resides in sample screening, whereby, for example, fluorescent labels and dyes are employed to bind molecules of interest, thus potentially affecting and biasing the test results (6). Moreover, most of the cell-based assays, such as fluorescence microscopy and flow cytometry among others, require expensive and time-consuming protocols as well as the exact knowledge of the cellular targets under investigation. Therefore, these techniques have limited applications for the rapid and multitarget screening of cellular samples, an approach of great relevance for obtaining a general overview of the major biochemical features of the system under investigation.
IR microspectroscopy (IRMS) does not suffer the limitations of the former methods and possesses all the characteristics for being a fast and informative multiscreening platform at the interface between biophysics and biology. It is a label-free, non-destructive technique (7) that probes vibrational modes of molecules and that allows to correlate the local biochemical features of the sample with its morphology, thanks to the use of visible-infrared (Vis-IR) microscopes. The infrared spectra of biological samples, such as cells and tissues, are impressively simple considering the number of biomolecules that concur to the spectral shape: each cellular constituent (each protein, lipid, nucleic acid, and carbohydrate as well as small molecule) has its peculiar spectrum (8,9), but the superimposition of all these contributions results in few characteristic cellular bands (see Figure 1). A detailed assignment of the cellular bands is given in Table 1, which also reports the cellular constituents whose some characteristic bands are considered diagnostic, according to data reported in the literature (10).
Figure 1.

Characteristic IR spectra of normal and scrapie GT1-1 cells (black and gray line, respectively). The spectral regions more representative for lipids, proteins, nucleic acids, and carbohydrates are shown. The origin of the most important absorption bands is reported in Table 1.
Table 1. Tentative Assignment of the Most Diagnostic Vibrational Bands Commonly Found in FTIR Cellular Spectra (Second Column)a.
| frequency (cm−1) | assignment | primary cell constituent |
|---|---|---|
| ≈3500 | O−H str of hydroxyl groups | |
| ≈3200 | N−H str (amide A) | proteins |
| ≈3010 | =C−H str | unsaturated fatty acids |
| 3000−2800 interval | sym and asym str of methyl and methylene groups | saturated fatty acids |
| ≈1730 | >C=O str of ester | phospholipids |
| 1715−1690 interval | >C=O str of carbonic acids and nucleotide bases | amino acid side chains and nucleic acids |
| 1700−1600 interval | amide I (80% C=O str, 10% C−N str, 10% N−H def) | proteins |
| amide I components |
||
|---|---|---|
| frequency (cm−1) | secondary structure | |
| 1695−1675 | antiparallel β-sheet | |
| aggregated strands | ||
| 1670−1660 | 310-helix | |
| 1660−1648 | α-helix | |
| 1648−1640 | random coil | |
| 1640−1625 | β-sheet | |
| 1628−1610 | aggregated strands | |
| 1580−1480 interval | amide II (40% C−N str, 60% N−H def) | proteins |
| 1470−1420 interval | scissoring of methylene groups and various methyl and methylene deformation bands | |
| ≈1400 | C=O sym str of COO- | |
| ≈1380 | −CH3 def | |
| 1310−1240 interval | amide III | proteins |
| 1250−1220 interval | P=O asym str of PO2− phosphodiester | nucleic acids backbone |
| 1200−900 | C−O−C str., C−O str, C−O−P | complex network of ring vibrations of carbohydrates |
| ≈1085 | P=O sym str of PO2− phosphodiester | nucleic acids backbone |
Abbreviations: str = stretching; def = deformation; sym = symmetric; asym= asymmetric. Cell constituents to which some IR bands are usually associated are also reported (third column). The attribution is done taking into consideration, besides the spectroscopical variables, that the major constituents of an eukaryotic cell are proteins, nucleic acids, carbohydrates, and lipids, respectively, accounting for about the 50%, 15%, 15%, and 10% of the total cellular dry mass (the remaining 10% is covered by other minority constituents) (67). Table 1 has been adapted from refs (68) and (69).
Although non-selective, the technique allows to gain very useful information on the sample under investigation (11−13). The intensity of IR spectral bands and their position and shape may highlight subtle biochemical changes, for example, affecting the concentration of cellular constituents, the composition and order of cellular membranes (14,15), the structure of cellular proteins (16,17), as well as the conformation of nucleic acids (18,19) and more. By exploiting the brightness advantage of synchrotron radiation (SR), this information can be resolved with a spatial accuracy of a few micrometers (20,21), narrowing the gap between IRMS and high-spatial resolution microscopy techniques, such as fluorescence microscopy.
Thanks also to the rapid development of fast, reliable, and user-friendly chemometric strategies for the handling and manipulation of large amounts of spectroscopic data, Fourier transform IR (FTIR)-based techniques are today promising analytical tools for the rapid assessment of pathological chemical alterations of body fluids, tissues, and cellular aggregates (22). With respect to prion diseases, FTIR spectroscopy has already been effectively employed. It was used to study the secondary structure of the proteinase K (PK) resistant core of PrPSc23,24 and more recently has succeeded in monitoring the refolding of fully post-translationally modified PrP revealing intermolecular β-sheets upon membrane anchoring above a threshold concentration, suggesting a prion-disorder mechanism based on PrP accumulation (25). Moreover, IRMS has revealed molecular alterations in lipids, carbohydrates, and nucleic acids induced by TSE in neural tissues, even though β-sheet amyloid deposits in neural areas were identified only in terminally ill hamster tissues (26). In addition, FTIR has allowed the discrimination of several TSE agents, analyzing the differences in the secondary structure of PrPSc purified from hamsters infected with three adapted scrapie strains and BSE (27,28).
The present study proposes the exploitation of SR-IRMS to identify prion-induced alterations at the subcellular level, therefore bridging the existing gap between PrP misfolding studies and neural tissue analysis. The IR experiments on mouse hypothalamic GT1-1 cell line infected with Rocky Mountain Laboratory (RML) prion strain were performed at the SISSI infrared beamline (Synchrotron Infrared Source for Spectroscopy and Imaging) of the Elettra Synchrotron facility in Trieste (29), and the analyses showed changes both in the content of the cellular biochemical constituents as well as in their intracellular distribution upon prion infection. Moreover, through the application of multivariate statistical analyses, IRMS successfully differentiated between healthy and infected cells, identifying the most significant spectral changes associated with the infected state. Established biological assays and atomic force microscopy (AFM) cell volume analysis confirmed the FTIR data, unveiling unique information on the pathological rearrangements undergone by prion-infected neuronal cells.
2. Results and Discussion
2.1. GT1-1 Cells: Morphological and Biochemical Characterization
In the present study the effects of prion infection on mouse hypothalamic GT1-1 cells were probed at single cell level. This cell line is known to sustain prion replication chronically once infected with prions (30). Uninfected and RML prion strain infected GT1-1 cells were maintained as described in the Methods section 3.4 and tested for PrPSc levels by Western blot (Figure 2a). The PK digestion assay, commonly aiming at detecting prions in biological samples, revealed the presence of the proteinase-resistant form of PrPSc in ScGT1-1 cells, confirming the chronic infection of the neuronal cell line. Furthermore, cell viability in infected and uninfected cells was verified by calcein AM assay. It was not possible to detect any statistically significant difference between ScGT1-1 and GT1-1 cells (2674.2 ± 760.1 au for ScGT1-1 and 3154.9 ± 411.1 au for GT1), suggesting that in the cellular model used no apoptotic events occurred upon prion infection.
Figure 2.

Prion infection in GT1-1 cells. (a) RML infected, ScGT1-1, and noninfected GT1-1 cells were tested for levels of PrPSc by Western blot. It can be noticed how in GT1-1 cells PrP is fully digested after PK treatment. (b) Cluster analysis (Euclidean distances; Ward’s algorithm) of first derivatives of spectra extended over the spectral range 1800−1150 cm−1. Only spectra within one SD of the mean for the intensity criterion detailed in the Methods section 3.3 were considered. A clear classification of cellular spectra ascribable to prion infection can be inferred by the shown dendrogram.
The distribution of the cell population among the cellular phases was tested for GT1-1 by flow cytometry, showing a percentage of 60.8 ± 1.7% cells in G1/G0 phase, 18.3 ± 2.8% in S phase, and 16.4 ± 0.9% in G2 phase. Any attempt to induce cellular synchronization in resting phase by serum starvation protocols did not give appreciable results (data not shown), while probably inducing cellular sufferance and biochemical perturbations, potentially detectable by IRMS (31)(32). For the same reason, no other chemical treatment leading to cell-cycle arrest was considered (33).
GT1-1 and ScGT1-1 are morphologically indistinguishable by phase-contrast microscopy (34) and possess comparable surface areas, height profiles, and cell volumes as demonstrated by AFM analysis. The calculated average volume of the GT1-1 and ScGT1-1 cells was 307 and 286 μm3, respectively, showing a 7% variation (see Figure 3a). The AFM volume measurement uncertainty was estimated to be a maximum of 5% mostly due to the bending of the 100 nm thick Si3N4 membrane at the cell location, likely as a result of membrane surface tension. Indeed, the Si3N4 membrane was found to have 10−15 nm indentation around the cell body: simply comparing the volume measurements including and excluding the indented areas, we found the total calculated volume to vary at most by 4%. Another source of uncertainty was the unintended exclusion of few small cell parts such as a tiny fraction of the filopodia during the selection of the cell extent for volume analysis. In the light of this issue about volume measurement precision, we suggest that the 7% volume variation upon prion infection can safely be regarded as intrinsic and that consequently the two cells types have almost the same experimental volume and surface profile (see Figure 3). Moreover, by simple linear fitting, the cell volume−area coefficient was found to be 2.89, which is close to the value of a perfect pyramid (that is 3), thus suggesting that the cells may conceivably bear pyramid-like shapes with the cell nuclei placed under the pyramid’s apex. The cytoplasmic regions of the cells were found to be about an order of magnitude lower in thickness than the nuclear region, for both GT1-1 and ScGT1-1 cell lines (see Figure 3b,c). By dividing the cell volume with the projected cell surface area, we calculated the effective cell height values which averaged to 0.6 μm in both GT1-1 and ScGT1-1 cases, with variations below significant digits. The detailed morphological aspects were quite important, since they allowed for a more careful interpretation of both semiquantitative analysis results from individual whole-cell spectra (section 3.2) and single-cell chemical maps at subcellular spatial resolution (section 3.3).
Figure 3.

(a) Average cell volumes of GT1-1 and ScGT1-1 as calculated by AFM. Healthy and scrapie cells display comparable average volumes [Avg(VGT1) = 307 μm3, Avg(VScGT1) = 286 μm3]. (b) 3D reconstruction of a representative GT1-1 cell fixed on Si3N4 membrane (45 μm × 35 μm scanned area). (c) 3D reconstruction of a representative ScGT1-1 cell fixed on Si3N4 membrane (40 μm × 40 μm scanned area). It can be noticed how GT1-1 and ScGT1-1 cells have similar pyramidal shapes in which the nuclear region represents the apex [(Min−Max) = (0−2.2 μm)].
2.2. Whole-Cell Multivariate Statistical Analysis and Semiquantitative Analysis
Many approaches have been developed in biology and medicine for rapid sample classification; among them, hierarchical cluster analysis, a multivariate, unsupervised, simple, and robust statistical method, is widely employed for highlighting FTIR spectral similarities and differences (35), and it was chosen in our study in order to discriminate between infected and noninfected cellular samples, by comparing infrared spectra of whole-GT1 cells. Data on whole-cell spectra were acquired employing a conventional MidIR Globar source in transmission mode and setting the microscope knife-edge apertures at 30 × 30 μm2 in order to match the entire cell surface. The quality of the raw data was verified for water vapor absorption and S/N ratio, as well as based on the intensity criterion detailed in Methods section 3.3(36). For each population, only the cell spectra within the SD of the mean were further analyzed, in order to reduce the intra-GT1-1 and intra-ScGT1-1 spectral heterogeneity, caused by the intrinsic cellular variability and amplified by the cellular asynchronization (37). Vector normalized first derivatives of FTIR cell spectra were used for multivariate statistical analysis to enhance spectral band resolution and minimize baseline variations: spectral similarities were evaluated using Euclidean distances, and the Ward’s algorithm was applied for spectra clustering. Inspection of the spectra over the frequency range 1800−1150 cm−1 fully succeeded in distinguishing between noninfected and infected GT1 (the same results were drawn out considering the more extended frequency range 3600−1150 cm−1). From the dendrogram shown in Figure 2b, it is possible to notice that GT1-1 and ScGT1-1 cells cluster in two separate classes and that the spectral variations induced by infection are indeed larger than intrapopulation heterogeneity, demonstrating the great effect on the cellular milieu upon prion infection. This assumption is supported by the maintenance of the same classification scheme either by clustering IR spectra within 2 SD of the mean or by applying a different classification algorithm, such as the principal component analysis (PCA) of vector normalized first derivatives of spectra over both the spectral ranges (data not shown).
The classification maintained over a wide spectral range demonstrates that it is based on the superimposition of multimolecular information rather than being associated to a specific cell constituent, which is evidence for an overall cell rearrangement upon prion replication. In order to gain more insights on prion infection features highlighting the biochemical origin of the spectrum classification, GT1-1 and ScGT1-1 first derivatives of spectra were averaged and inspected by comparison. The major spectral differences were appreciated in specific subregions in the 1800−1150 cm−1 range (see Figure 4a), where, moreover, the classification was better preserved: 1710−1480 cm−1 (no misclassification, A region hereafter), 1425−1357 cm−1 (no misclassification, B region hereafter), and 1280−1200 cm−1 (1 misclassification, C region hereafter). The A region is dominated by the protein bands amide I (1700−1600 cm−1) and amide II (1580−1480 cm−1), centered at 1651 and 1534 cm−1, respectively, for both GT1-1 and ScGT1, as can be better appreciated from Figure 4b representing the normalized average absorbance and the second derivative of the spectra of GT1-1 (black line) and ScGT1-1 (gray line), upper and lower panel, respectively. Moreover, no significant spectral differences can be detected in the shape of both amide II as well as amide I bands, suggesting that the prion infection is not accompanied by an appreciable increase in β-sheet folded proteins over α-helix/random coil content at whole cellular level (refer to Table 1 for band assignment). This result is not surprising, since PrPSc represents less than 0.1% of total proteins in prion-infected brains (38) and, as previously highlighted, only analyses at tissue level in the very late stages of the infection revealed the β-sheet increment in extracellular plaques of PrPSc aggregates, accumulated within the central nervous system (CNS) (26).
Figure 4.

(a) Vector normalized first derivatives of the spectra of GT1-1 (black line) and ScGT1-1 (gray line) in the 1800−1150 cm−1 range; line thickness is proportional to one SD, comparable for infected and noninfected cells. Peak maxima in the original spectra cross the zero line in first derivatives. A, B, and C regions are defined by dashed line boxes. The arrowheads point out the spectral intervals showing major differences among spectra: a, 1710−1680 cm−1; a′, 1610−1580 cm−1; b, 1425−1325 cm−1 ; c, 1290−1180 cm−1. (b) Upper panel: average absorbance spectra of GT1-1 (black line with thickness proportional to one SD) and ScGT1-1 (gray line with thickness proportional to one SD) in the 1760−1480 cm−1 spectral range. Lower panel: second derivatives of average spectra for GT1-1 and ScGT1. (c, d) Average absorbance spectra of GT1-1 (black line with thickness proportional to SD) and ScGT1-1 (gray line with thickness proportional to SD) in the 1425−1325 and 1290−1180 cm−1 ranges, respectively. Plotted absorbance spectra are baseline corrected and normalized (minimum absorbance unit 0, maximum 2).
In the A region, noticeable differences were indeed detected for the spectral intervals 1710−1680 and 1610−1580 cm−1, arrowed as a and a′ both in Figure 4a and b. Various molecules contribute to the measured spectral profile in those regions, such as protein aggregates, nucleic acids, and amino acid side chains (see Table 1) (39−41), therefore hindering the possibility to interpret the revealed spectral differences. However, on the strength of the spectral differences detected in the C region, in which the peak maximum shifts from 1240 to 1236 cm−1 upon prion infection (see Figure 4d), a contribution from nucleic acids to spectral shape changes in the A region cannot be excluded. Even if the P=O antisymmetric stretching band (1250−1120 cm−1 interval) of the PO2− phosphodiester of the nucleic acid backbone partially overlaps with the amide III band (1340−1240 cm−1) in the c arrowed interval, the high degree of similarity in the shapes of amide I and amide II bands speaks in favor of a contribution of nucleic acids to the varied spectral pattern in the c and consequently in the A interval. Concerning the possible biochemical sources for the spectral differences characterizing the a, a′, and c regions possibly arising from nucleic acid modifications upon prion infection, any speculation should be avoided without the support of further experimental evidence, also because of the impossibility to access the nucleic acid band associated to symmetric stretching of phosphate groups of phosphodiester due to the very poor transparency of the silicon nitride support below 1150 cm−1. Moreover, the lack of literature about structural alterations undergone by nucleic acids upon prion infection does not allow any further dissertation concerning a possible effect of prion replication on DNA and RNA conformations.
Besides the possible contribution of nucleic acids, a different proportion of ionized and protonated aspartic acid (Asp) and glutamic acid (Glu) is also believed to influence the spectral shape in the a′ interval. Indeed, carboxylate Glu and Asp absorb strongly in the 1580−1550 cm−1 region (C=O asymmetric stretching) and near 1400 cm−1 (C=O symmetric stretching); it is noteworthy that the different spectral profile in the a′ region occurs parallel with the lowering of the spectral contribution centered at 1400 cm−1 in the B region (see Figure 4c). Since pH is finely tuned by cells and in most cases even a small alteration of its value would be incompatible with cell life, it may be possible to explain this spectral difference postulating an increased cytoplasmic concentration of some specific subcellular compartments where a lowering of pH occurred. Many lines of evidence confer a pivotal role in prion conversion to the endocytic pathway (42); thus, the increase of the protonated form of Asp and Glu amino acids may be related to the increase in the amount of lysosomes in the cytosol upon prion infection. This hypothesis, supported by an increased volume of acidic vesicles found in human sporadic CJD brains using specific markers for endosomal−lysosomal system (43), was validated by SR-IRMS and fluorescence microscopy (see section 3.3).
Infrared data acquired from whole cells were further exploited to highlight the biochemical rearrangement undergone by GT1-1 cells upon prion infection by investigating the variations in the cellular content of the most fundamental macromolecules employing the semiquantitative method detailed in section 3.3. The protein relative content remains unaltered upon the infection as revealed by the non-significant variation in protein absorbance normalized on the total cell biomass (Figure 5a), while a decrement in the relative lipid content was detected (see Figure 5b), especially affecting the cellular phospholipids (see Figure 5c). Non-infected and infected GT1-1 cells have similar size, as can be easily deduced even by visible microscopy, as well as comparable surface profiles, areas, and cellular volumes as demonstrated by AFM. This allows regarding the integrated intensity of the infrared bands of both GT1-1 and ScGT1-1 cells as roughly proportional to the concentration of the cellular constituent to which they are associated and comparing them without the need of any normalization. Considering the average values obtained for GT1-1 and ScGT1-1 by integration of the total protein band, a protein concentration decrement of almost 27% was appreciated by the lowering of the correspondent band intensity upon infection (see Figure 5d). Thus, while the ratio between the integrated intensity of proteins and the total cell biomass is the same for both infected and uninfected cells, the sole values of proteins show a decrement in ScGT1-1 compared to GT1-1 cells. Consequently, since the ratio is the same, the total cell biomass must also be proportionally lower in ScGT1-1 cells upon prion infection. In addition, almost the same decrement was elicited from quantification of protein content per cell by bicinchoninic acid assay (see Figure 5e). It has to be highlighted that the latter assay was performed starting from living cells while IRMS data were collected on formaldehyde-fixed GT1 cells. Therefore, the protein decrement can surely be attributed to the infection excluding a possible different effect of fixation on infected and uninfected cells. Concluding, AFM and biochemical assays validated IRMS data and supported our analysis concluding that deep cellular modifications upon prion infection are affecting both cell proteome and lipidome.
Figure 5.

(a−c) Average cellular content of proteins, lipids, and phospholipids normalized on the total cellular biomass for GT1-1 and ScGT1-1 cells as estimated by semiquantitative analysis and detailed in the Methods section 3.3. The following values were obtained: proteinsGT1 = 0.190 ± 0.003 au, proteinsScGT1 = 0.191 ± 0.002 au; lipidsGT1 = 0.043 ± 0.001 au, lipidsScGT1 = 0.040 ± 0.001 au; phospholipidsGT1 = 0.0016 ± 0.0001 au, phospholipidsScGT1 = 0.0012 ± 0.0001 au. For testing significant differences, unpaired Student’s t test was performed: **P < 0.01, n = 67 and *P < 0.05, n = 67. (d) Average total protein content as calculated by band integration in the spectral interval 1700−1480 cm−1: proteinsGT1 = 3.814 ± 0.131 au, proteinsScGT1 = 2.78 ± 0.047 au; significant for **P < 0.01, n = 67. (e) Protein content per cell as estimated by BCA: 1.47 × 10⁻¹⁰ ± 0.22 × 10⁻¹⁰ gr/GT1-1 cell and 1.07 × 10⁻¹⁰ ± 0.09 × 10⁻¹⁰ gr/ScGT1-1 cell; significant for *P < 0.05, n = 3. Black bars: GT1-1. Gray bars: ScGT1-1.
2.3. SR-IRMS Chemical Mapping of Single Cells
Exploiting the brightness advantage of SR, selected GT1-1 and ScGT1-1 cells were mapped setting the microscope knife-edge apertures at 6 μm (oversampling 1:2), allowing us to elucidate the chemical distribution of specific cell constituents at the subcellular level. Intracellular distribution of global proteins (P), lipids (L), and phospholipids (Ph) were obtained as detailed in the Methods section 3.3 and are shown in Figure 6 for a couple of representative control and scrapie cells (Figure 6a,b and c,d, respectively).
Figure 6.

(a) Cell optical image (30 × 57 μm; scale bar 5 μm) of a single GT1-1 cell and related chemical maps, collected setting knife-edge apertures to 6 μm (oversampling 1:2), of total protein content [P, (Min−Max) = (0−6 au)], acyl chains of lipids [L, (Min−Max) = (0−2.5 au)], carbonyl ester of phospholipids [Ph, (Min−Max) = (0.01−0.08 au)]. (b) Cell optical image (30 × 40 μm; scale bar 5 μm) of a single GT1-1 cell and related chemical maps, collected setting knife-edge apertures to 6 μm (oversampling 1:2), of total protein content [P, (Min−Max) = (0−6 au)], acyl chains of lipids [L, (Min−Max) = (0−2.5 au)], carbonyl ester of phospholipids [Ph, (Min−Max) = (0.01−0.08 au)]. (c) Cell optical image (30 × 57 μm; scale bar 5 μm) of a single ScGT1-1 cell and related chemical maps, collected setting knife-edge apertures to 6 μm (oversampling 1:2), of total protein content [P, (Min−Max) = (0−4 au)], acyl chains of lipids [L, (Min−Max) = (0−1 au)], carbonyl ester of phospholipids [Ph, (Min−Max) = (0.01−0.04 au)]. (d) Cell optical image (23 × 66 μm; scale bar 5 μm) of a single ScGT1-1 cell and related chemical maps, collected setting knife-edge apertures to 6 μm (oversampling 1:2), of total protein content [P, (Min−Max) = (0−4 au)], acyl chains of lipids [L, (Min−Max) = (0−1 au)], carbonyl ester of phospholipids [Ph, (Min−Max) = (0.01−0.04 au)].
Comparing GT1-1 and ScGT1-1 P maps, the lower protein content of infected cells, which is already highlighted by individual whole-cell analysis, becomes evident considering the color scale extent of 0−6 a.u. for GT1-1 cells and of 0−4 a.u. for ScGT1-1 ones. However, the distribution of cellular protein in wild-type and infected cells is comparable, showing nuclear protein signals up to 10 times larger than cytoplasmic ones, as typically revealed in mammalian cells (44). This is expected since the nuclear path length of GT1-1 cells is longer, as also demonstrated by AFM analysis.
By comparing L and Ph maps for GT1-1 and ScGT1-1 cells, more details on the lipidic intracellular pattern before and after infection are emerging. Looking at the distribution of phospholipids, obtained by applying the univariate technique of functional carbonyl ester group mapping (integration interval 1752−1717 cm−1), they are localized at the nuclear and perinuclear level in GT1-1 cells. Such an intracellular arrangement is expected, since both the nuclear membranes and those of perinuclear cellular compartments, such as endoplasmic reticulum and Golgi apparatus, are abundant in phospholipids. In ScGT1-1 cells, the signal of phospholipids looks quite different: beside the nuclear and perinuclear regions, phospholipid rich regions can be seen in the cytoplasm. Similarly, the lipid distribution differentiates GT1-1 and ScGT1-1 accordingly: the L band localizes at the nuclear and perinuclear level in noninfected cells, almost colocalizing with the P band, while it extends into the cytoplasm in infected ones. Those distributions are compatible with the presence of extended cytosolic vesicles and discrete vesicular foci in infected cells, as already reported by other authors (45, 46), suggested by whole-cell analysis, and further verified by confocal microscopy (see Figure 7). A vital dye specific for low-pH vesicles was used to mark lysosomes within the cells. GT1-1 cells showed a staining pattern composed of tiny spots dispersed in the cytosolic compartment, while ScGT1-1 cells exhibited acidic vesicles increased both in volume and number compared to normal cells. The fluorescence signal was quantified and the difference between infected and uninfected cells statistically confirmed. An abnormal increase in the number of lysosomes and lysosomal-related bodies appears as a distinctive trait of TSE. These subcellular structures seem to be key organelles in prion pathogenesis, since they represent a site of accumulation for the misfolded form of PrP (47). In addition, many lines of evidence have proposed the endocytic-lysosomal compartment as a possible site for prion conversion (48).
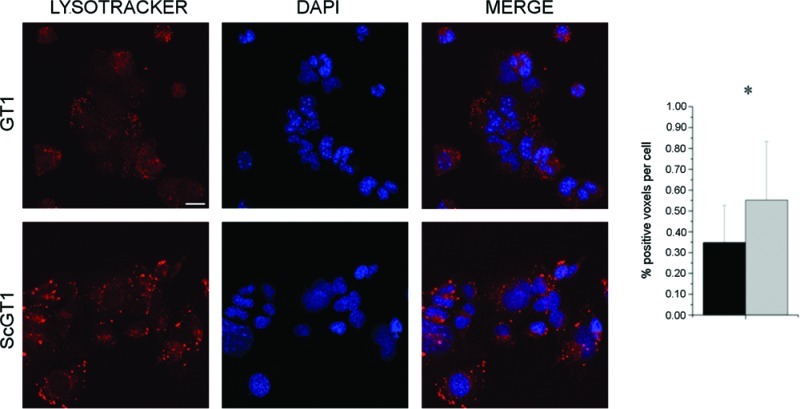
Figure 7.

Lysosome detection and quantification. ScGT1-1 and GT1-1 cells were treated with Lysotracker and fixed as described in the Methods section 3.4. Lysosomes were stained in red, while nuclei were counterstained in blue with DAPI; merged images are shown on the right. ScGT1-1 cells exhibit bigger and more numerous lysosomes compared to GT1-1 cells. Images are representative of three independent experiments of staining. Scale bar, 20 μm. The fluorescence signal was quantified using ImageJ software, and the results are plotted in the adjacent histogram (black bar, GT1-1; gray bar, ScGT1-1). Statistics were performed using Student’s t test on a set of three independent experiments. *P < 0.05.
2.4. Conclusions
Drawing on the complementarities between IRMS and conventional bioassays, a global insight into the biochemical changes affecting individual mouse hypothalamic GT1-1 cells upon prion infection is here presented. IRMS, both performed on a single whole cell and with subcellular spatial resolution by exploiting the high brilliance of SR source, allowed us to appreciate differences in composition and distribution of most biochemical components, revealing comprehensive information about the modifications of the cellular milieu induced by prion infection and replication. The greatest differences found between infected and uninfected cells involved both lipidome and proteome profiles.
Indeed, the role of lipid constituents has always been considered crucial in the physiology and cell signaling of the CNS. Several neuronal disorders and neurodegenerative diseases such as Alzheimer’s, Parkinson’s, Niemann−Pick, and Huntington diseases do indeed involve a deregulation of lipid metabolism (49). Consistently, TSE display alterations in lipid metabolism as well: brain transcriptome analysis revealed a deregulation in lipid metabolism both in murine scrapie model (50, 51) and in sporadic CJD patients (52). Consistent with these data, a deregulation in lipid metabolism was detected also in ScGT1-1 cells. In fact, whole single cell IRMS highlighted a relative decrement of phospholipids upon prion infection. A different intracellular distribution of phospholipids was also found, consistent with an increased concentration of phospholipid-rich cytoplasmic organelles within ScGT1-1 cells. Such evidence, complemented with the results of cluster analysis on single cells that indicated an increased protonation of amino acid side chains as a consequence of prion infection, leads us to conclude that ScGT1-1 cells contain an increased amount of acidic vesicles, a finding also supported by conventional fluorescence microscopy. This discovery has strong biological implications because our data support a direct involvement of the lysosomal compartment in prion propagation.
The biogenesis of prions is a process not yet fully understood, and the subcellular compartment in which the conversion of PrPC to PrPSc occurs is still the subject of intense debate. Many putative sites have been proposed by analyzing the patterns of distribution for PrPSc in infected cells. The detergent-insoluble fraction of membranes (that contains rafts) has been described as one of the possible sites (53). Also the endocytic pathway was identified as a putative conversion site due to the cyclic internalization undergone by PrPC48. Contrasting data is reported in the literature about the specific compartment, along the endocytic pathway, in which the conversion might take place. Some authors identified in the lysosomal compartment the conversion site as they found most of the PrPSc sequestered inside lysosomal vesicles of scrapie-infected neuroblastoma cells (45). Later works described PrPSc prevalently in the early endocytic and recycling vesicles (54, 55). The aberrant increase undergone by the lysosomal compartment upon prion infection, detected by IR, may reflect its role as a conversion site for PrPSc or, alternatively, as a “sink site” for newly generated PrPSc molecules.
Our work indicates a pronounced decrement in protein content, found by complementing IRMS at the whole single cell level, AFM volume analysis, and conventional BCA, suggesting a misregulation of protein expression upon prion infection. In fact, as confirmed by microarray data collected on ScGT1-1, several sets of genes are down-regulated in response to prion infection, especially some loci encoding for ATP binding and cytoskeletal and ribosomal proteins (56). Thus, a down-regulation of the translational machinery in ScGT1-1 might explain the overall decrease in protein production in response to prion infection.
Interestingly, as highlighted by AFM, the decreased in both lipid in and protein contents detected in ScGT1-1 cells corresponds neither to a reduction of the cellular volume nor to any remarkable changes in the shape and morphology of infected cells. This apparent paradox could be tentatively explained by taking into account water content and its contribution to the cellular volume. One of the distinctive histopathological hallmarks of prion diseases is spongiosis. The exact mechanism of spongiform change is not fully understood, but it seems to be a result of abnormal membrane permeability that eventually leads to an increased water content within neurons (57). Since the GT1 cell line retains many membrane properties of the neurons from which it is derived (58), once infected with prions it may undergo the same alterations happening in vivo. Thus, in ScGT1-1 cells, an impairment of the mechanisms involved in the control of water fluxes across the membrane may result in the swelling of the cellular body and counterbalance the effects of the protein and lipid decrease on cell volume.
These biochemical rearrangements highlight detectable cellular alterations driven by prion replication, indicating that the IRMS technique employed in this study may successfully provide sensitive and effective fingerprinting in search for biochemical markers specific for neuronal cell loss. The results obtained in the present study using IRMS supported by multivariate statistical analysis are consistent with previous data on neuronal tissues from infected mice in different stages of the disease (59). Thus, it could be speculated that IRMS might complement standard diagnostic procedures requiring several days and large amounts of biological samples, such as PK digestion, and may theoretically allow comparing single cells and distinguishing between normal and pathological state in a matter of minutes. However, due to the non-selectivity of the technique, further experiments are needed to assess this point. Specifically, other cell lines as well as other models of neurological diseases should be sampled and tested in order to investigate the level of reliability of IRMS as diagnostic tool.
Lastly, altogether these findings represent a good example of cooperation between biophysics and biology in collecting information on complex systems such as biological specimens. Indeed, chemometric analyses might be able to shed light on the global molecular alterations due to prion replication in TSE. The modifications observed at the cell physiology level prompt new questions about the multitude of pathological mechanisms involved in protein misfolding diseases. The challenge ahead will be assessing whether these cellular responses are exclusive or general for other neurodegenerative disorders such as Alzheimer’s or Parkinson’s diseases.
3. Methods
3.1. Cell Maintenance and IR Sample Preparation
Mouse hypothalamic GT1-1 and scrapie ScGT1-1 cells (kindly provided by Dr. P. Mellon, The Salk Institute, La Jolla, CA) (60) were maintained in Dulbecco’s modified Eagle’s medium, with 4.5 g/L glucose (DMEM) (GIBCO/Invitrogen) supplemented with 10% v/v fetal bovine serum (FBS) (GIBCO/Invitrogen) and antibiotics (100 IU/mL penicillin and 100 μg/mL streptomycin) at 37 °C in a humidified atmosphere with 5% CO2. Cells were chronically infected with RML prion strain according to already published procedures (30). Cells were grown on 100 nm thick silicon nitride IR transparent windows at a confluence of 40−60% in order to obtain isolated cells suitable for the analysis. Silicon nitride (Si3N4) is not a standard substrate for IR investigations, since it strongly absorbs below 1150 cm−161. However, this material is insoluble in water, biocompatible (62), and cheaper than commonly employed IR transparent substrate, such as calcium and barium fluoride. Moreover, any attempt to grow GT1-1 cells on CaF2 and BaF2 failed. Fixation was performed by washing cells twice with phosphate buffer solution (PBS; GIBCO/Invitrogen) and incubating in paraformaldehyde 4% (PFA) in PBS for 20 min. Then samples were extensively washed with PBS to remove any traces of PFA and, after a final washing in ultrapure water, let to dry (63). Before the analysis, on top of each window a second clean window was glued, in order to reduce the biological hazard. After the experiment, samples were disposed following standard procedures for prion decontamination (64).
3.2. The SISSI infrared Beamline at Elettra Synchrotron Radiation Facility
IR microspectroscopy allows correlating morphological details of the investigated sample with its local vibrational pattern thanks to the use of visible-infrared (Vis-IR) microscopes coupled with conventional FTIR interferometers (65). Specifically, SR-IRMS exploits the brightness advantage of synchrotron sources in order to guarantee a spatial resolution not achievable with conventional ones. The possibility of operating at diffraction limit, maintaining an appreciable S/N ratio, allows investigation of chemical changes occurring within a sample by probing its vibrational modes with a diffraction-limited spatial resolution of a few micrometers in the mid-infrared (MIR) range (20). The chance of investigating single-cell and even subcellular phenomena opened new and exciting perspectives in the application of SR-IRMS for life sciences, as proved by the constantly increasing number of SR infrared beamlines dedicated to bioapplications all over the world (http://infrared.als.lbl.gov/content/web-links/45-srir).
SISSI (Synchrotron Infrared Source for Spectroscopy and Imaging) is the infrared beamline of Elettra Synchrotron (Elettra Laboratory, Trieste, Italy), a third generation synchrotron radiation facility. It is a bending magnet beamline that extracts both IR and visible components of SR emission over acceptance angles of 70 mrad (horizontal) and 25 mrad (vertical) and comprises both edge and constant field emission (29). The beamline hosts one branch fully dedicated to life science applications, equipped with a Vis-IR Hyperion 3000 microscope coupled with a Vertex 70 interferometer (Bruker Optics, Ettlingen, Germany). All data reported in this paper have been acquired in the MIR regime using a single point MCT (Hg−Cd−Te) detector.
3.3. FTIR Data Collection and Analysis
FTIR spectra were acquired in transmission mode, purging with nitrogen both the interferometer and microscope, sealed within an in-house designed box in order to reduce spectral contributions for environmental water vapor and carbon dioxide. For the acquisition of infrared data, both whole-cell analysis and single-cell mapping, isolated cells were chosen randomly by visual inspection, taking care to exclude apoptotic and osmotic-stressed cells, following the same strategy adopted for AFM cell selection. Individual whole-cell spectra were collected with conventional source at 30 × 30 μm, using a 15X Schwarzschild condenser and objective, coadding 1024 scans with a spectral resolution of 4 cm−1. GT1-1 and ScGT1-1 chemical maps were acquired with SR source, using a 36X Schwarzschild condenser and objective and setting to 6 × 6 μm the knife-edge apertures of the microscope, imposing a step length of 3 μm. The spectra were collected by averaging 512 scans per map point with a spectral resolution of 4 cm−1. The background spectrum was recollected every 10 map points in order to compensate the intensity decay of SR.
Individual Whole-Cell Spectra Processing and Analysis
All single-cell spectra were processed with OPUS NT 6.5 (Bruker Optics, Ettlingen, Germany) software. Raw spectra quality was verified by testing for water vapor absorption and signal to noise ratio (S/N). Water vapor intensity was calculated as the difference between the maximum and minimum value of first derivative spectra within the 1847−1837 cm−1 range, a region where water vapor absorbencies are quite strong; none of the spectra exceeded the 3 × 10⁻⁴ a.u. value chosen as threshold. Spectra were further evaluated for the S/N ratio for the amide I region (1700−1600 cm−1): the signal intensity at 1655 cm−1 was divided by the peak-to-peak spectral noise, calculated within the range 2000−2100 cm−1, a spectral region that does not show any spectral band of the sample; S/N average values higher than 1000 were calculated. Only one spectrum of scrapie GT1-1 cells did not pass the test and was excluded from the following steps of data analysis. Spectra of both wild-type and scrapie cells were separately subjected to a further quality test based on an intensity criterion in the wavelength range 1770−1150 cm−1: baseline corrected spectra (rubberband algorithm) were integrated in the 1770−1150 cm−1 region, and only the cell spectra within one standard deviation (SD) of the mean were considered for data analysis (total intensity = 9.84 ± 3.09 a.u. and 6.80 ± 1.47 a.u. for GT1-1 and ScGT1-1, respectively). By applying this intensity criterion, cells showing a biomolecular content too high (such as duplicating cells or cell aggregates) or too low (cells that have a reduced bimolecular content as a consequence of membrane damage) were excluded from the following postprocessing steps. Almost 60% of acquired spectra were founded within one SD for GT1-1 cells and 70% for ScGT1-1.
Vector normalized first derivatives of spectra (nine-smoothing point, Savitzky−Golay algorithm) were used as input data for the cluster analysis, in order to classify spectral regions discriminating between wild type and scrapie samples. Cluster analysis was performed by using OPUS software with standard making distance matrix and Ward’s algorithm dendrogram.
A further analysis was performed based on the integrated intensity of specific spectral regions to detect differences in the relative content of the most important cellular constituents upon prion infection. Such analysis will be named semiquantitative hereafter, to emphasize how the possibility to perform a proper quantitative analysis on biological specimens is limited by the biochemical complexity of each biosample, where each cellular molecule in fact possesses a specific molar extinction coefficient. Moreover, the uncertainty about the sample thickness is further complicating the interpretation of experimental data. To be able to take into account at least the thickness variations among different cells, the relative content of cellular proteins, lipids, and phospholipids was estimated dividing the area of some diagnostic FTIR bands by the total spectral integrated area (the area above the straight line generated between the chosen peak frequency limits was considered; integration method B in OPUS). The total integrated spectral area was calculated by summing the integrated area between 3700−2500 and 1770−1150 cm−1, which may be considered representative of the total cell biomass (66), while the following diagnostic spectral intervals have been chosen: 1700−1480 cm−1, amide I and II bands (mostly proteins, hereafter total protein content); 2990−2828 cm−1, aliphatic chains especially from saturated fatty acids of lipids (lipids hereafter); 1756−1717 cm−1, carbonyl stretching of ester, primarily from phospholipids (for more details on IR band interpretation, see Figure 1 and Table 1). An unpaired Student’s t test was performed on all the data sets to test for significant differences between control and scrapie GT1-1 cells.
SR-IRMS Single Cell Data with Subcellular Spatial Resolution: Processing and Analysis
All spectra were processed with OPUS NT 6.5. For each cell mapped, raw spectra were corrected for the contribution of CO2 and water vapor, truncated to a range of 3800−1150 cm−1 and smoothed using the Savitzky−Golay algorithm with a window of 13 points. After the assembling of the spectra in a nXm matrix (where n and m vary accordingly with the cell size), the chemical maps of each cell were generated by applying the univariate technique of functional group mapping. Among the others, the following integrals were considered: total protein content (P, 1700−1480 cm−1), carbonyl ester of phospholipids (Ph, 1752−1717 cm−1), and acyl chains of lipids (L, 3000−2800 cm−1). Images were elaborated with ImageJ open source software (http://rsbweb.nih.gov/ij/index.html).
3.4. Biological Assays
PK Digestion Assay
ScGT-1 and GT1-1 cells at 90% of confluence were washed twice with cold PBS, and then lysis buffer was added (10 mM Tris-HCl pH 8.0, 150 mM NaCl, 0.5% nonidet P-40 substitute, 0.5% deoxycholic acid sodium salt); after 5 min, cell lysates were collected and clarified, centrifuging at 5000 rpm for 5 min. Total proteins from supernatants were quantified using the bicinchoninic acid assay (BCA) (Pierce), and 500 μg was digested with 10 μg of PK (Roche, ratio protein:protease 50:1) for 1 h at 37 °C. The reaction was stopped by adding phenylmethyl sulphonyl fluoride (PMSF) to a final concentration of 2 mM and PrP was precipitated by ultracentrifugation at 100 000g for 1 h at 4 °C. Pellets were resuspended in loading buffer and resolved onto a 12% polyacrylammide gel, and 50 μg of undigested proteins was also loaded as control. Samples were transferred onto a membrane of polyvinylidene fluoride (PVDF) and blocked with 5% (w/v) non-fat milk protein in Tris buffered saline with Tween 20 (0.05%) (TBS-T) for 1 h at room temperature. The PrP antigen was detected by Fab D18 (1 μg/mL) diluted in TBS-T for 2 h at room temperature; after three washes, the secondary antibody, horseradish peroxidase (HRP)-conjugated goat-anti-human (Pierce) diluted 1:5000 in 5% (w/v) non-fat milk proteins, was added and incubated for 1 h at room temperature. The membrane was extensively washed and signals were detected using the ECL kit (Amersham Pharmacia) on ECL Hypermax films (Amersham Pharmacia).
Quantification of Protein Amount Per Cell
Both GT1-1 and scGT1-1 cells were trypsinized and counted using a hemocytometer (Thoma chamber, HBG, Germany) to define the number of cells per plate; then they were centrifuged at 1500 rpm for 5 min and the pellet was washed twice with cold PBS (GIBCO/Invitrogen). The cells were lysed with lysis buffer (10 mM Tris-HCl pH 8.0, 150 mM NaCl, 0.5% nonidet P-40 substitute, 0.5% deoxycholic acid sodium salt, and a mixture of protease inhibitors), and cell extract was centrifuged at 5000 rpm for 5 min to remove cell debris. Total proteins were quantified using BCA (Pierce), and the values obtained for infected and noninfected cells were divided for the number of cells to calculate the average amount of proteins per single cell.
Calcein AM Viability Assay
About 40 000 cells per well were grown in a 96-well, tissue culture treated, clear bottom, black plate (Costar); after 24 h, cells were washed twice with 200 μL of PBS and then incubated with 2.5 μM calcein AM diluted in 100 μL of PBS for 30 min at 37 °C. Fluorescence emission intensity was quantified using a SpectraMax M5 fluorescence plate reader (Molecular Device), with an excitation/emission ratio equal to 492/525 nm. Experiments were carried out in sextuplicate, and the results are expressed as mean values ± SD.
DNA Cell Cycle Analysis by Flow Cytometry
GT1-1 cells were trypsinized and washed twice with cold PBS (GIBCO/Invitrogen). Then they were centrifuged at 1500 rpm for 5 min and the pellet was resuspended in 100 μL of cold PBS and 900 μL of cold ethanol for 1 h at 4 °C (106/mL). The cells were centrifuged at 1500 rpm for 5 min, and the pellet was washed twice with cold PBS, suspended in 500 μL of PBS, and incubated with RNAase (20 μg/mL final concentration) at 37 °C for 30 min. The cells were then chilled over ice for 10 min and stained with propidium iodine (50 μg/mL final concentration) for 1 h for analysis by flow cytometry. Flow cytometry was performed with a FACScan (Becton Dickinson, Heidelberg, Germany) instrument. A minimum number of 10 000 cells per sample was collected, and the DNA histograms were further analyzed by using ModiFitLT software (Verily Software House, Topsham, ME) for cell cycle analysis. The results are expressed as mean values ± SD; they come from three independent experiments.
Lysosome Detection and Quantification
ScGT1-1 and GT1-1 cells were grown overnight on glass coverslips coated with poly-l-lysine (10 μg/mL). Then they were incubated for 1 h with Lysotracker (Invitrogen) diluted in DMEM supplemented with 10% FBS at a final concentration of 50 nM according to the manufacturer. The medium was removed, and the cells were washed twice with PBS before fixation in paraformaldeyde 4% in PBS for 20 min at RT. The cells were extensively washed in PBS, and the coverslips were mounted on with Vectashield with DAPI (VECTOR Laboratories). Images were acquired with a DMIR2 confocal microscope equipped with Leica Confocal software (Leica).
In order to quantify the signal given by lysosomes, 15 random fields (stacking mode) were acquired for ScGT1-1 and GT1-1 cells with the same settings and magnification (40×). Each stack was converted into a binary file, and the same threshold was applied to all the files to isolate the signal of lysosomes from the background. The percentage of positive voxels was calculated and normalized on the number of cells in every stack. The values obtained were averaged and the mean values ± SD were plotted in a histogram (0.055 ± 0.028 AU for ScGT1-1 cells and 0.034 ± 0.017 AU for GT1-1 cells). Images were analyzed with ImageJ open source software (http://rsbweb.nih.gov/ij/index.html). The results come from three independent experiments.
3.5. AFM Cell Volume Analysis
The fixed GT1-1 and ScGT1-1 cells on Si3N4 membrane windows prepared for FTIR spectroscopy were imaged with a NanoWizard-II Bio-AFM (JPK Instruments AG, Berlin, http://www.jpk.com) apparatus operating in dynamic mode. AFM scans were made using NSG01 (NT-MDT Co., Moscow, http://www.ntmdt.com) silicon probes with Au reflective coating at the detector side, 10 nm typical tip radius, nominal spring constant of 5.5 N/m and nominal resonance frequency of 150 kHz. This probe was selected for the reason that it has a 22° cone shaped high aspect ratio tip with 10−20 μm height, allowing problem-free access for imaging micrometer sized objects such as cells. The Si3N4 membrane windows were optically inspected, and isolated single cells were selected carefully to represent the ones that were used in FTIR spectroscopy with the help of the built-in inverted microscope (Axiovert 200, Carl Zeiss GmbH, Berlin, http://www.zeiss.de). Care was taken to avoid (i) apoptotic cells with small, shrinked round shapes and (ii) osmotically stressed smashed looking cells. The analysis was carried on through 10 GT1-1 and 12 ScGT1-1 cells. Images of 1500−4000 μm2 areas with 512 square pixels long-edge were collected at a line scan rate of 0.4 Hz in ambient conditions. The AFM free oscillation amplitudes were ranging from 10 to 25 nm, with characteristic set points ranging from 80% to 95% of these free oscillation amplitudes. Each AFM scan image contained only one complete cell. The scanned images were processed using standard AFM data processing methods such as line-by-line level alignment which correct for small mismatches between each successive scan line arising from the inevitable thermal drift happening on the nanometer scale during the finite scan time. The images were then plane leveled to remove the planar tilt of the substrate which is important for the correct volume analysis. The cells were marked and cell volumes were measured using the analysis software Gwyddion (Gwyddion open source software, http://gwyddion.net).
Acknowledgments
The authors wish to thank Dr. Federico Benetti and Dr. Maya Petrova Kiskinova for critically reading the manuscript. The authors also wish to thank Dr. Marilena Granzotto, IRCCS Burlo Garofolo, Trieste, Italy, for her help with cell cycle analysis by flow cytometry and Dr. Pierangelo Morini, Dr. Diego Sali, and Dr. Paolo Belloni, Bruker Italy, for the technical support. Finally, the authors thank Gabriella Furlan for editing and proofreading the manuscript.
Abbreviations
PrP, prion protein; PrPC, cellular form of PrP; PrPSc, scrapie isoform of PrP; GT1-1, mouse hypothalamic cell line; ScGT1-1, scrapie-infected GT1-1; PK, proteinase K; SR, synchrotron radiation; IRMS, infrared microspectroscopy; AFM, atomic force microscopy.
These authors contributed equally to the work.
A.D. carried out the biological assays, prepared IR samples, acquired IR data, and drafted the manuscript. L.V. acquired and analyzed IR data and drafted the manuscript. A.B. carried out the AFM analysis and drafted the manuscript. G.L. conceived the project and drafted the manuscript. All authors read and approved the manuscript.
The authors declare that they have no conflict of interests.
This work was supported by SISSA funding to G.L. and SISSI beamline at Elettra Synchrotron Light Laboratory funding to L.V. A.B. acknowledges the support of European Projects BINASP FP6-SSA011936 and SMD FP7-NMP 2800-SMALL-2 Proposal No. CP-FP 229375-2.
References
- Prusiner S. B. (1998) Prions. Proc. Natl. Acad. Sci. U.S.A. 95, 13363–13383. [DOI] [PMC free article] [PubMed] [Google Scholar]
- Pan K. M.; Baldwin M.; Nguyen J.; Gasset M.; Serban A.; Groth D.; Mehlhorn I.; Huang Z.; Fletterick R. J.; Cohen F. E.; et al. (1993) Conversion of alpha-helices into beta-sheets features in the formation of the scrapie prion proteins. Proc. Natl. Acad. Sci. U.S.A. 90, 10962–10966. [DOI] [PMC free article] [PubMed] [Google Scholar]
- Fasano C.; Campana V.; Zurzolo C. (2006) Prions: protein only or something more? Overview of potential prion cofactors. J. Mol. Neurosci. 29, 195–214. [DOI] [PubMed] [Google Scholar]
- Rambold A. S.; Muller V.; Ron U.; Ben-Tal N.; Winklhofer K. F.; Tatzelt J. (2008) Stress-protective signalling of prion protein is corrupted by scrapie prions. EMBO J. 27, 1974–1984. [DOI] [PMC free article] [PubMed] [Google Scholar]
- Lee K. S.; Linden R.; Prado M. A.; Brentani R. R.; Martins V. R. (2003) Towards cellular receptors for prions. Rev. Med. Virol. 13, 399–408. [DOI] [PubMed] [Google Scholar]
- Swenson E. S.; Price J. G.; Brazelton T.; Krause D. S. (2007) Limitations of green fluorescent protein as a cell lineage marker. Stem Cells 25, 2593–2600. [DOI] [PubMed] [Google Scholar]
- Holman H. Y. N.; Martin M. C.; McKinney W. R.; Wayne R. (2003) Synchrotron-Based FTIR Spectromicroscopy: Cytotoxicity Considerations. J. Biol. Phys. 29, 275–286. [DOI] [PMC free article] [PubMed] [Google Scholar]
- Stuart B., Ando D. J., and Stuart B. H. (1997) Biological Applications Of Infrared Spectroscopy, John Wiley & Sons. [Google Scholar]
- Mantsch H., and Chapman D. (1996) Infrared Spectroscopy of Biomolecules, Wiley-Liss. [Google Scholar]
- Kneipp J.; Lasch P.; Baldauf E.; Beekes M.; Naumann D. (2000) Detection of pathological molecular alterations in scrapie-infected hamster brain by Fourier transform infrared (FT-IR) spectroscopy. Biochim. Biophys. Acta 1501, 189–199. [DOI] [PubMed] [Google Scholar]
- Chalmers J. M., and Griffiths P. R. (2002) Applications in life, pharmaceutical and natural science, in Handbook of Vibrational Spectroscopy, John Wiley & Sons Ltd, Chichester. [Google Scholar]
- Carter E. A.; Tam K. K.; Armstrong R. S.; A. L. P. (2009) Vibrational spectroscopic mapping and imaging of tissues and cells. Biophys. Rev. 1, 95–103. [DOI] [PMC free article] [PubMed] [Google Scholar]
- Naumann D. (1998) FT-IR and FT-NIR Raman Spectroscopy in Biomedical Research. AIP Conf. Proc. 430, 96–109. [Google Scholar]
- Lewis R. N. A. H.; McEkhaney R. N. (2007) Fourier Transform Infrared Spectroscopy in the Study of Lipid Phase Transitions in Model and Biological Membranes: Practical Considerations. Methods Mol. Biol. 400, 207–226. [DOI] [PubMed] [Google Scholar]
- Mantsch H. H.; McEkhaney R. N. (1991) Phospholipid phase transitions in model and biological membranes as studied by infrared spectroscopy. Chem. Phys. Lipids 57, 213–226. [DOI] [PubMed] [Google Scholar]
- Jung C. (2000) Inisght into protein structure and protein-ligand recognition by Fourier transform infared spectroscopy. J. Mol. Recognit. 13, 325–351. [DOI] [PubMed] [Google Scholar]
- Tamm L. K.; Tatulian S. A. (1997) Infrared spectroscopy of proteins and peptides in lipid bilayers. Q. Rev. Biophys. 30, 365–429. [DOI] [PubMed] [Google Scholar]
- Taillandier E.; Liquier J. (1992) Infrared spectroscopy of DNA. Methods Enzymol. 211, 307–335. [DOI] [PubMed] [Google Scholar]
- Banyay M.; Sarkar M.; Graslund A. (2003) A library of IR bands of nucleic acids in solution. Biophys. Chem. 104, 477–488. [DOI] [PubMed] [Google Scholar]
- Miller L.; Smith G. D.; Carr G. L. (2003) Synchrotron-based Biological microspectroscopy: from the Mid-Infrared through the Far-Infrared Regimes. J. Biol. Phys. 29, 219–230. [DOI] [PMC free article] [PubMed] [Google Scholar]
- Carr G. L. (2001) Resolution limits for infrared microspectroscopy explored with synchrotron radiation. Rev. Sci. Instrum. 1613–1619. [Google Scholar]
- Chalmers J. M., and Griffiths P. R. (2002) Sample caractherization and spectral data processing, in Handbook of Vibrational Spectroscopy, John Wiley & Sons Ltd, Chichester. [Google Scholar]
- Caughey B. W.; Dong A.; Bhat K. S.; Ernst D.; Hayes S. F.; Caughey W. S. (1991) Secondary structure analysis of the scrapie-associated protein PrP 27-30 in water by infrared spectroscopy. Biochemistry 30, 7672–7680. [DOI] [PubMed] [Google Scholar]
- Gasset M.; Baldwin M. A.; Fletterick R. J.; Prusiner S. B. (1993) Perturbation of the secondary structure of the scrapie prion protein under conditions that alter infectivity. Proc. Natl. Acad. Sci. U.S.A. 90, 1–5. [DOI] [PMC free article] [PubMed] [Google Scholar]
- Elfrink K.; Ollesch J.; Stohr J.; Willbold D.; Riesner D.; Gerwert K. (2008) Structural changes of membrane-anchored native PrP(C). Proc. Natl. Acad. Sci. U.S.A. 105, 10815–10819. [DOI] [PMC free article] [PubMed] [Google Scholar]
- Beekes M.; Lasch P.; Naumann D. (2007) Analytical applications of Fourier transform-infrared (FT-IR) spectroscopy in microbiology and prion research. Vet. Microbiol. 123, 305–319. [DOI] [PubMed] [Google Scholar]
- Thomzig A.; Spassov S.; Friedrich M.; Naumann D.; Beekes M. (2004) Discriminating scrapie and bovine spongiform encephalopathy isolates by infrared spectroscopy of pathological prion protein. J. Biol. Chem. 279, 33847–33854. [DOI] [PubMed] [Google Scholar]
- Spassov S.; Beekes M.; Naumann D. (2006) Structural differences between TSEs strains investigated by FT-IR spectroscopy. Biochim. Biophys. Acta 1760, 1138–1149. [DOI] [PubMed] [Google Scholar]
- Lupi S.; Nucara A.; Perucchi A.; Calvani P.; Ortolani M.; Quaroni L.; Kiskinova M. (2007) Performance of SISSI, the infrared beamline of the ELETTRA storage ring. J. Opt. Soc. Am. B 24, 959–964. [Google Scholar]
- Schatzl H. M.; Laszlo L.; Holtzman D. M.; Tatzelt J.; DeArmond S. J.; Weiner R. I.; Mobley W. C.; Prusiner S. B. (1997) A hypothalamic neuronal cell line persistently infected with scrapie prions exhibits apoptosis. J Virol 71, 8821–8831. [DOI] [PMC free article] [PubMed] [Google Scholar]
- Kim H. Y.; Akbar M.; Kim K. Y. (2001) Inhibition of neuronal apoptosis by polyunsaturated fatty acids. J. Mol. Neurosci. 16, 223–227; discussion 279−284. [DOI] [PubMed] [Google Scholar]
- Kulkarni G. V.; McCulloch C. A. (1994) Serum deprivation induces apoptotic cell death in a subset of Balb/c 3T3 fibroblasts. J. Cell Sci. 107(Pt 5), 1169–1179. [DOI] [PubMed] [Google Scholar]
- Boydston-White S.; Chernenko T.; Regina A.; Miljkovic M.; Matthaus C.; Diem M. (2005) Microspectroscopy of proliferating HeLa cells. Vib. Spectrosc. 38, 169–177. [Google Scholar]
- Sandberg M. K.; Low P. (2005) Altered interaction and expression of proteins involved in neurosecretion in scrapie-infected GT1-1 cells. J. Biol. Chem. 280, 1264–1271. [DOI] [PubMed] [Google Scholar]
- Chalmers J. M., and Griffiths P. R. (2002) Classification methods, in Handbook of Vibrational Spectroscopy, John Wiley & Sons Ltd, Chichester. [Google Scholar]
- Lasch P.; Haensch W.; Naumann D.; Diem M. (2004) Imaging of colorectal adenocarcinoma using FT-IR microspectroscopy and cluster analysis. Biochim. Biophys. Acta 1688, 176–186. [DOI] [PubMed] [Google Scholar]
- Boydston-White S.; Romeo M.; Chernenko T.; Regina A.; Miljkovic M.; Diem M. (2006) Cell-cycle-dependent variations in FTIR micro-spectra of single proliferating HeLa cells: principal component and artificial neural network analysis. Biochim. Biophys. Acta 1758, 908–914. [DOI] [PMC free article] [PubMed] [Google Scholar]
- Beekes M.; Baldauf E.; Diringer H. (1996) Sequential appearance and accumulation of pathognomonic markers in the central nervous system of hamsters orally infected with scrapie. J. Gen. Virol. 77(Pt 8), 1925–1934. [DOI] [PubMed] [Google Scholar]
- Banyay M.; Sarkar M.; Graslund A. (2003) A library of IR bands of nucleic acids in solution. Biophys. Chem. 104, 477–488. [DOI] [PubMed] [Google Scholar]
- Barth A. (2000) The infrared absorption of amino acid side chains. Prog. Biophys. Mol. Biol. 74, 141–173. [DOI] [PubMed] [Google Scholar]
- Wolpert M.; Hellwig P. (2006) Infrared spectra and molar absorption coefficients of the 20 alpha amino acids in aqueous solutions in the spectral range from 1800 to 500 cm−1. Spectrochim. Acta, Part A 64, 987–1001. [DOI] [PubMed] [Google Scholar]
- Peters P. J.; Mironov A. Jr.; Peretz D.; van Donselaar E.; Leclerc E.; Erpel S.; DeArmond S. J.; Burton D. R.; Williamson R. A.; Vey M.; Prusiner S. B. (2003) Trafficking of prion proteins through a caveolae-mediated endosomal pathway. J. Cell Biol. 162, 703–717. [DOI] [PMC free article] [PubMed] [Google Scholar]
- Kovacs G. G.; Gelpi E.; Strobel T.; Ricken G.; Nyengaard J. R.; Bernheimer H.; Budka H. (2007) Involvement of the endosomal-lysosomal system correlates with regional pathology in Creutzfeldt-Jakob disease. J. Neuropathol. Exp. Neurol. 66, 628–636. [DOI] [PubMed] [Google Scholar]
- Mohlenhoff B.; Romeo M.; Diem M.; Wood B. R. (2005) Mie-Type Scattering and Non-Beer-Lambert Absorption Behavior of Human Cells in Infrared Microspectroscopy. Biophys. J. 88, 3635–3640. [DOI] [PMC free article] [PubMed] [Google Scholar]
- McKinley M. P.; Taraboulos A.; Kenaga L.; Serban D.; Stieber A.; DeArmond S. J.; Prusiner S. B.; Gonatas N. (1991) Ultrastructural localization of scrapie prion proteins in cytoplasmic vesicles of infected cultured cells. Lab. Invest. 65, 622–630. [PubMed] [Google Scholar]
- Veith N. M.; Plattner H.; Stuermer C. A.; Schulz-Schaeffer W. J.; Burkle A. (2009) Immunolocalisation of PrPSc in scrapie-infected N2a mouse neuroblastoma cells by light and electron microscopy. Eur. J. Cell Biol. 88, 45–63. [DOI] [PubMed] [Google Scholar]
- Laszlo L.; Lowe J.; Self T.; Kenward N.; Landon M.; McBride T.; Farquhar C.; McConnell I.; Brown J.; Hope J.; et al. (1992) Lysosomes as key organelles in the pathogenesis of prion encephalopathies. J. Pathol. 166, 333–341. [DOI] [PubMed] [Google Scholar]
- Borchelt D. R.; Taraboulos A.; Prusiner S. B. (1992) Evidence for synthesis of scrapie prion proteins in the endocytic pathway. J. Biol. Chem. 267, 16188–16199. [PubMed] [Google Scholar]
- Adibhatla R. M.; Hatcher J. F. (2008) Altered lipid metabolism in brain injury and disorders. Subcell. Biochem. 49, 241–268. [DOI] [PMC free article] [PubMed] [Google Scholar]
- Riemer C.; Neidhold S.; Burwinkel M.; Schwarz A.; Schultz J.; Kratzschmar J.; Monning U.; Baier M. (2004) Gene expression profiling of scrapie-infected brain tissue. Biochem. Biophys. Res. Commun. 323, 556–564. [DOI] [PubMed] [Google Scholar]
- Sorensen G.; Medina S.; Parchaliuk D.; Phillipson C.; Robertson C.; Booth S. A. (2008) Comprehensive transcriptional profiling of prion infection in mouse models reveals networks of responsive genes. BMC Genomics 9, 114. [DOI] [PMC free article] [PubMed] [Google Scholar]
- Xiang W.; Hummel M.; Mitteregger G.; Pace C.; Windl O.; Mansmann U.; Kretzschmar H. A. (2007) Transcriptome analysis reveals altered cholesterol metabolism during the neurodegeneration in mouse scrapie model. J. Neurochem. 102, 834–847. [DOI] [PubMed] [Google Scholar]
- Harris D. A. (1998) Clathrin-coated vescicles and detergent-resistant rafts in prion biology. Bull. Inst. Pasteur 96, 207–210. [Google Scholar]
- Godsave S. F.; Wille H.; Kujala P.; Latawiec D.; DeArmond S. J.; Serban A.; Prusiner S. B.; Peters P. J. (2008) Cryo-immunogold electron microscopy for prions: toward identification of a conversion site. J. Neurosci. 28, 12489–12499. [DOI] [PMC free article] [PubMed] [Google Scholar]
- Marijanovic Z.; Caputo A.; Campana V.; Zurzolo C. (2009) Identification of an intracellular site of prion conversion. PLoS Pathog. 5, e1000426. [DOI] [PMC free article] [PubMed] [Google Scholar]
- Greenwood A. D.; Horsch M.; Stengel A.; Vorberg I.; Lutzny G.; Maas E.; Schadler S.; Erfle V.; Beckers J.; Schatzl H.; Leib-Mosch C. (2005) Cell line dependent RNA expression profiles of prion-infected mouse neuronal cells. J. Mol. Biol. 349, 487–500. [DOI] [PubMed] [Google Scholar]
- Kovacs G. G.; Budka H. (2008) Prion diseases: from protein to cell pathology. Am. J. Pathol. 172, 555–565. [DOI] [PMC free article] [PubMed] [Google Scholar]
- Funabashi T.; Suyama K.; Uemura T.; Hirose M.; Hirahara F.; Kimura F. (2001) Immortalized gonadotropin-releasing hormone neurons (GT1- cells) exhibit synchronous bursts of action potentials. Neuroendocrinology 73, 157–165. [DOI] [PubMed] [Google Scholar]
- Kretlow A.; Wang Q.; Kneipp J.; Lasch P.; Beekes M.; Miller L.; Naumann D. (2006) FTIR-microspectroscopy of prion-infected nervous tissue. Biochim. Biophys. Acta 1758, 948–959. [DOI] [PubMed] [Google Scholar]
- Mellon P. L.; Windle J. J.; Goldsmith P. C.; Padula C. A.; Roberts J. L.; Weiner R. I. (1990) Immortalization of hypothalamic GnRH neurons by genetically targeted tumorigenesis. Neuron 5, 1–10. [DOI] [PubMed] [Google Scholar]
- Lattemann M.; Nold E.; Ulrich S.; Leiste H.; Holleck H. (2003) Investigation and characterisation of silicon nitride and silicon carbide thin films. Surf. Coat. Technol. 174−175, 365–369. [Google Scholar]
- Voskerician G.; Shive M. S.; Shawgo R. S.; Recum H. v.; Anderson J. M.; Cima M. J.; Langer R. (2003) Biocompatibility and biofouling of MEMS drug delivery devices. Biomaterials 24, 1959–1967. [DOI] [PubMed] [Google Scholar]
- Gazi E.; Dwyer J.; Lockyer N. P.; Miyan J.; Gardner P.; Hart C.; Brown M.; Clarke N. W. (2005) Fixation protocols for subcellular imaging by synchrotron-based Fourier transform infrared microspectroscopy. Biopolymers 77, 18–30. [DOI] [PubMed] [Google Scholar]
- Taylor D. M. (2000) Inactivation of transmissible degenerative encephalopathy agents: A review. Vet. J. 159, 10–17. [DOI] [PubMed] [Google Scholar]
- Garidel P. and Boese M. (2007) Non-Invasive Fourier Transform infrared Microspectroscopy and Imaging Techniques: Basic Principles and Application, in Modern Research and Educational Topics in Microscopy (Méndez-Vilas A. and Diaz J. Eds.). [Google Scholar]
- Kretlow A.; Wang Q.; Beekes M.; Naumann D.; Miller L. M. (2008) Changes in protein structure and distribution observed at pre-clinical stages of scrapie pathogenesis. Biochim. Biophys. Acta 1782, 559–565. [DOI] [PMC free article] [PubMed] [Google Scholar]
- Alberts B., Johnson A., Lewis J., Raff M., K. R., and Walter P. (2008) Cell Chemistry and Biosynthesis, in Molecular Biology of the Cell, Garland Science. [Google Scholar]
- Jackson M.; Mantsch H. (1995) The use and Misuse of FTIR Spectroscopy in the Determination of Protein structure. Crit. Rev. Biochem. Mol. Biol. 30, 95–120. [DOI] [PubMed] [Google Scholar]
- Naumann D. (1998) FT-IR and FT-NIR Raman spectroscopy in biomedical research. AIP Conf. Proc. 430, 96–109. [Google Scholar]