

Abstract
Background
The AT-motif Binding Factor 1 (ATBF1) gene is frequently altered at the genetic level in several types of cancer, but its protein expression and subcellular localization have not been well studied in human cancers including head and neck squamous cell carcinomas (HNSCCs).
Methods
ATBF1 expression and localization were examined in five cell lines and 197 clinical specimens of HNSCC, and correlated with pathological and clinical characteristics.
Results
ATBF1 was predominantly localized in the nucleus of hyperplastic squamous epithelium. Whereas nuclear ATBF1 dramatically decreased in invasive tumors (p=0.0012), cytoplasmic ATBF1 levels progressively increased from dysplasia to invasive tumors (p<0.0001), and the increase correlated with poor survival. Reduced nuclear ATBF1 level was also detected in HNSCC cell lines.
Conclusions
Nuclear localization of ATBF1 is frequently interrupted in HNSCC, and the interruption is significantly associated with the progression of HNSCC. The cytoplasmic ATBF1 level could be useful for predicting patient survival.
Keywords: HNSCC, ATBF1, mislocalization, survival, tumor suppressor
Introduction
Head and neck squamous cell carcinoma (HNSCC) includes malignancies arising in the oral cavity, larynx and pharynx. It is one of the six most prevalent cancers in the world, with approximately 49,260 new cases diagnosed and an estimated 11,480 deaths in the United States in 2010.(1) In the past three decades, the five-year survival rate for HNSCC patients has only slightly improved. The poor survival rate is partially attributed to our limited understanding of molecular mechanisms of HNSCC initiation and progression. Characterization of oncogenes and tumor suppressor genes in HNSCC could facilitate the detection and treatment of HNSCC.
The AT-motif Binding Factor 1 (ATBF1) gene was originally identified to negatively regulate alpha-fetoprotein (AFP) by binding to its promoter region.(2, 3) The gene has two isoforms, ATBF1-A and -B. The predominant isoform, ATBF1-A, encodes a 404-kD transcription factor containing both zinc-finger domains and homeodomains and is 920 amino acids longer than the ATBF1-B isoform.(2, 4) Studies suggest that ATBF1 participates in brain development and neuronal differentiation by regulating several differentiation markers including AFP, aminopeptidase N and neurod1.(4–8)
Recent studies suggest that ATBF1 is involved in the pathogenesis of multiple types of human cancer, because ATBF1 has alterations at both the mRNA and genomic DNA levels. In prostate cancer, the ATBF1 gene undergoes frequent genomic deletion, somatic mutations and reduced expression in both cells lines and primary tumor specimens.(9, 10) Re-expression of ATBF1 inhibits cancer cell proliferation.(9) ATBF1 mRNA levels are also reduced in breast cancer and hepatocellular carcinoma, and lower levels of ATBF1-A mRNA correlate with worse prognosis in breast cancer.(11–13) Moreover, in AFP-producing gastric cancer, which is highly malignant, ATBF1 expression is absent, consistent with the observation that ATBF1 acts as a transcriptional repressor of oncogenic AFP.(3, 14) In addition to reduced mRNA levels of ATBF1, somatic mutations have also been detected in gastric cancer.(15) A recent study of cancer specimens showed that nuclear ATBF1 could significantly suppress the expression of the cancer biomarker MUC5AC, and ATBF1 expression may be associated with a better prognosis in gastric cancer.(16) These results suggest a tumor suppressor function of ATBF1 in multiple human tissues.
The molecular pathways regulated by ATBF1 are poorly understood. As a transcription factor, ATBF1 inhibits the expression of several tumor biomarkers such as AFP and MUC5AC, and promotes the expression of the p21WAF1 tumor suppressor.(3, 16, 17) In addition to its function in gene transcription, ATBF1 also interacts with several oncoproteins to negatively regulate their functions. For example, signal transducer and activator of transcription 3 (STAT3) is inhibited by a ring domain-containing protein named protein inhibitor of activated STAT3 (PIAS3), and the interaction between ATBF1 and PIAS3 enhances the inhibitory effect of PIAS3 on STAT3 activity.(18, 19) The activity of another oncoprotein, c-Myb, is also repressed by ATBF1 through protein interaction.(20) It has been reported that overexpression or activation of STAT3 and c-Myb frequently occurs in human HNSCCs.(21–23) These oncoproteins contribute to tumor initiation and progression by altering the cell cycle, preventing apoptosis, or mediating cancer invasion.(24–26) It is thus important to analyze the expression of their inhibitor, ATBF1, in HNSCCs.
In this study, we examined the expression of ATBF1 in human HNSCC, including both cell lines and tissue specimens, using an anti-ATBF1 antibody.(7, 11) We found that mislocalization of ATBF1 frequently occurred in HNSCC and correlated with the histopathologic progression of HNSCC.
Materials and Methods
Cell lines and tissue specimens
The HNSCC cell lines Tu212, 212LN, Tu177, 886LN and Sqccy1 were maintained in DMEM/Ham's F-12 (1:1) medium supplemented with 10% fetal bovine serum in a 37°C, 5% CO2 humidified incubator.
Archived formalin-fixed and paraffin-embedded tissue specimens of HNSCC from patients with (98 cases) and without (99 cases) lymph node metastasis were used for immunohistochemical (IHC) staining of ATBF1. After the initial surgery, none of the patients received chemotherapy or radiation therapy. Clinical characteristics of the patients were retrieved from the files in the Department of Pathology and Laboratory Medicine at Emory University. The histopathologic grade of HNSCC was determined by one of the pathologists (SM) according to standard criteria using hematoxylin and eosin (HE) stained sections. All specimens evaluated in this study were prior to the Health Insurance Portability and Accountability Act (HIPPA) regulations (March 2003), and use of tissue specimens and clinical information was approved by the Emory University Institutional Review Board (#8607).
RT-PCR and immunoblotting
Total RNA from cancer cell lines was isolated using Trizol reagent (Invitrogen, Carlsbad, CA). One microgram of RNA was reversely transcribed into cDNA using the iScript cDNA synthesis kit (Bio-Rad Laboratories, Hercules, CA). The mRNA level of ATBF1 was determined by semi-quantitative RT-PCR with primers 5'-CATCAAGGAGGGCGGCAA-3' and 5'-CTCTCGCTTCGCTGGTGCTT-3' for ATBF1 and 5'-GAAATCGTGCGTGACATTAAG-3' and 5'-CTAGAAGCATTTGCGGTGGACGATGGAGGGGCC-3' for β-actin (ACTB).(9)
For immunoblotting, total cell lysates were collected in RIPA buffer (50 mM Tris (pH 7.5), 150 mM NaCl, 1 mM EDTA, 0.1% SDS, 10% glycerol, 20 mM ß-glycerophosphate, and 1% protease inhibitor cocktail (Sigma-Aldrich, St. Louis, MO)). Protein concentrations were determined by the Bradford assay (Bio-Rad Laboratories, Hercules, CA). Eighty μg of total protein lysate were separated by 4% (for ATBF1) or 12% (for ACTB) SDS-polyacrylamide gel electrophoresis (PAGE), and electrophoretically transferred to nitrocellulose membranes, which were then blocked with 5% fat-free milk and incubated with the anti-ATBF1 antibody (1:1,000 dilution) or anti-ACTB antibody (1:1,500 dilution, Sigma-Aldrich, St. Louis, MO). The blots were then incubated with horseradish peroxidase-conjugated anti-IgG secondary antibodies (Sigma-Aldrich, St. Louis, MO) and visualized with an enhanced chemiluminescence system (Pierce Protein Research Products, Thermo Scientific, Rockford, IL).
Immunofluorescence staining
The HNSCC cell lines were cultured in Lab-Tek™ II-chamber slides for 48 hours before fixation in 4% paraformaldehyde for 10 min at room temperature. After washing in PBS, cells were permeabilized and blocked for 30 min in PBS containing 10% (v/v) normal goat serum and 0.3% (v/v) Triton X-100. Cells were then incubated with the primary antibodies at 4°C overnight and washed three times for 10 min each in PBS. After washing, cells were incubated with Alexa Fluor® 555 goat anti–rabbit IgG antibody (Invitrogen, Carlsbad, CA) for 60 min at room temperature. After three washes in PBS, nuclei were counterstained with 4',6-diamidino-2-phenylindole (DAPI) for 5 min. The chamber on each slide was then removed, and slides were mounted and imaged under the Zeiss Axioplan 2 fluorescent microscope.
Immunohistochemistry (IHC) staining
Tissue sections were deparaffinized and rehydrated following the regular procedure. Sections were then blocked in Peroxidase-Blocking Solution (Dako, Carpinteria, CA), and antigen retrieval was done in a citrated buffer (pH 6.0, 10 mM trisodium citrate) for 15 min in a microwave. Tissue sections were incubated with the anti-ATBF1 antibody (1:500) at 4°C overnight, followed by incubation with the EnVision Polymer-HPR anti-rabbit antibody (Dako, Carpinteria, CA) at room temperature for 40 min. After the application of DAB-chromogen, tissue sections were mounted and visualized under microscopes. Staining on all tissue sections was performed under nearly identical conditions.
All immunohistochemically stained slides were independently reviewed by two pathologists (GS and SQF), and some of the slides were further reviewed by a third pathologist (YW). Since most cases had adjacent precancerous lesions available, both cancer and adjacent lesions were scored for ATBF1 expression in the nucleus and the cytoplasm separately, and the percentage of positive cells was calculated. The intensity of IHC staining was measured using a numerical scale (0 = no staining, 1 = weak staining, 2 = moderate staining, and 3 = strong staining). The weight index (WI) was calculated by multiplying staining intensity by the percentage of positive cells.
Statistical Analyses
Patients' clinical and pathological characteristics were summarized and compared between those with metastasis and those without metastasis. Age at diagnosis was presented with median (range) and compared by using the Wilcoxon's rank sum test. Other variables, including gender, smoking status, tumor site, primary tumor classification (T classification), regional lymph node classification (N classification), stage grouping (stage), chemotherapy, radiation therapy, and differentiation, were treated as categorical variables and evaluated by using the Chi-square test.
Because the sample size was relatively large and the residuals from the methods satisfy the normality and homoscedasticity assumptions, the expression levels of ATBF1 in the cytoplasmic and the nuclear portions were treated as a continuous outcome.
The correlation of ATBF1 expression in each stratum by different subcellular portion and pathological variables, metastasis status, gender or smoking status was tested with an independent two sample t-test. Correlation of ATBF1 expression with age at diagnosis was determined by using the Pearson's correlation coefficient and tested with the t-test. The correlation of ATBF1 expression with tumor site, T classification, N classification, or stage grouping was determined by using the general linear model (GLM) approach. The GLM approach was also used to compare the difference in cytoplasmic ATBF1 or nuclear ATBF1 across different pathology strata. We further evaluated pairwise differences by using Tukey's method when the overall difference was significant at a p-value of 0.05.
In the survival analyses, nuclear or cytoplasmic staining of ATBF1 in tumor cells was dichotomized into two groups (high vs. low) by the median WI. Overall survival (OS) was calculated as the time from study enrollment to death or last contact. Disease free survival (DFS) was calculated as the time from study enrollment to disease progression date, death date, or last contact, whichever came first. DFS or OS were estimated by the Kaplan and Meier method, and the log-rank test was used to test the difference in OS or DFS between different staining groups.
The SAS statistical package (SAS Institute, Cary, NC) was used for all data management and analyses.
Results
Patient Characteristics
Specimens from a total of 197 patients with HNSCC were used in this study, including 98 non-metastatic (non-Met) and 99 metastatic (Met) cases. Characteristics of all patients are summarized in Table 1. There were more males than females in this study, consistent with the fact that HNSCC is more prevalent in males.(1) The age was marginally significantly older among non-metastatic patients than metastatic patients (p=0.04). Smoking was significantly more common among metastatic patients than non-metastatic patients (p=0.0485), supporting the idea that smoking is a risk factor for metastasis of HNSCC. Among non-metastatic patients, the primary tumor site was predominantly in the oral cavity (62%) and seldom at the oropharynx (7%), whereas the tumor site in metastatic patients was more evenly distributed. As expected, primary tumors in the metastatic group tended to be more poorly differentiated and at higher stages (Table 1). In addition, patients with metastasis were more likely to be treated with radiation therapy (p<0.0001).
Table 1.
Characteristics of patients with HNSCC.
| Characteristics | No met (n =98) | Met (n =99) | p value |
|---|---|---|---|
| Age | 0.04* | ||
| Median (range) | 64 (16 – 89) | 58 (22 – 93) | |
|
| |||
| Gender | 0.16** | ||
| Male | 58 (59%) | 68 (69%) | |
| Female | 40 (41%) | 31 (31%) | |
|
| |||
| Smoking | 0.0485** | ||
| Yes | 69 (78%) | 84 (88%) | |
| No | 20 (22%) | 11 (12%) | |
| Unknown | 9 | 4 | |
|
| |||
| Tumor site | <.0001** | ||
| Oropharynx | 7 (7%) | 33 (34%) | |
| Larynx | 30 (31%) | 28 (28%) | |
| Oral cavity | 61 (62%) | 38 (38%) | |
|
| |||
| T classification | 0.09** | ||
| T1 | 40 (41%) | 24 (24%) | |
| T2 | 30 (31%) | 38 (38%) | |
| T3 | 12 (12%) | 15 (15%) | |
| T4 | 15 (15%) | 22 (22%) | |
| Unknown | 1 | 0 | |
|
| |||
| N classification | <.0001** | ||
| N0 | 97 (100%) | 0 (0%) | |
| N1 | 0 (0%) | 19 (19%) | |
| N2 | 0 (0%) | 72 (73%) | |
| N3 | 0 (0%) | 8 (8%) | |
| Unknown | 1 | 0 | |
|
| |||
| Stage grouping | <.0001** | ||
| I | 40 (41%) | 0 (0%) | |
| II | 30 (31%) | 0 (0%)) | |
| III | 12 (12%) | 17 (17%) | |
| IV | 15 (15%) | 82 (83%) | |
| Unknown | 1 | 0 | |
|
| |||
| Chemotherapy | 0.005** | ||
| Yes | 5 (5%) | 18 (18%) | |
| No | 91 (95%) | 80 (82%) | |
| Unknown | 2 | 1 | |
|
| |||
| Radiation therapy | <.0001** | ||
| Yes | 35 (36%) | 85 (89%) | |
| No | 61 (64%) | 10 (11%) | |
| Unknown | 2 | 4 | |
|
| |||
| Differentiation | <.0001** | ||
| WD | 28 (30%) | 3 (3%) | |
| MD | 58 (60%) | 73 (74%) | |
| PD | 10 (10%) | 23 (23%) | |
| Unknown | 2 | 0 | |
Notes: p-values were determined by the Wilcoxon's rank sum test (*) or by the Chi-square test (**). Met, metastasis; WD, well differentiated; MD, moderately differentiated; PD, poorly differentiated.
Expression of ATBF1 in primary tumors
Expression of ATBF1 in HNSCC was examined by IHC staining in 197 primary tumors and their adjacent precancerous lesions. While ATBF1 was reportedly a nuclear transcription factor, we noticed significant cytoplasmic staining in some cancers, so we scored staining signals in both the cytoplasm and the nucleus in each case. In addition, ATBF1 expression was evaluated in the adjacent noncancerous epithelium when present, which included hyperplasia, low-grade dysplasia, high-grade dysplasia, and carcinoma in situ (CIS). In all patients, nuclear ATBF1 expression was significantly associated with the histopathologic progression of HNSCC (Table 2), as its expression was at a moderate level in hyperplasia (WI=83.9±7.3) but at higher levels in both low- and high-grade dysplasia (WI=109.1±8.3 and WI=125.7±6.9). Invasive carcinomas, however, had significantly lower levels of nuclear ATBF1 (WI=62.1±5.0), and the mean WI of nuclear ATBF1 in invasive tumors was even lower than that in hyperplasia, although this difference was only marginal (p=0.0638). We noticed that in normal tissues and simple hyperplastic lesions, ATBF1 expression was more heterogeneous. With a paired t-test analysis in 87 cases that had both invasive tumors and simple hyperplasia, we found that nuclear ATBF1 expression decreased dramatically in cancers compared to matched hyperplastic cells (p=0.0012). Meanwhile, the cytoplasmic ATBF1 level continuously increased throughout the progression from hyperplasia, low-grade dysplasia, high-grade dysplasia/carcinoma in situ, to invasive carcinoma (p<0.0001) (Table 2). The same trend was also observed when metastatic and non-metastatic cases were analyzed separately (Table 3). Representative IHC staining is shown in Figure 1.
Table 2.
ATBF1 expression in HNSCCs and their precancerous lesions.
| Pathological status | ATBF1 WI |
Significant pairwise p value* | Overall p value** | ||||
|---|---|---|---|---|---|---|---|
| Mean | SE | (1) | (2) | (3) | (4) | ||
| Nuclear ATBF1 | <.0001 | ||||||
| Simple hyperplasia (1) | 83.9 | 7.3 | - | ||||
| Low-grade dysplasia (2) | 109.1 | 8.3 | 0.1038 | - | |||
| High-grade dysplasia / CIS (3) | 125.7 | 6.9 | 0.0002 | 0.4221 | - | ||
| Invasive tumor (4) | 62.1 | 5.0 | 0.0638 | <0.0001 | <0.0001 | - | |
|
| |||||||
| Cytoplasmic ATBF1 | <.0001 | ||||||
| Simple hyperplasia (1) | 109.1 | 7.7 | - | ||||
| Low-grade dysplasia (2) | 117.5 | 8.8 | 0.8884 | - | |||
| High-grade dysplasia / CIS (3) | 157.1 | 7.3 | <0.0001 | 0.0033 | - | ||
| Invasive tumor (4) | 161.6 | 5.3 | <0.0001 | <0.0001 | 0.9596 | - | |
Abbreviations: ATBF1, AT-motif binding factor 1; WI, weight index; SE, standar error; GLM, general linear model; CIS, carcinoma in situ.
Notes: p values were determined by the Tukey's test (*) or by the F-test with GLM (**).
Table 3.
ATBF1 expression in metastatic and nonmetastatic HNSCCs and their precancerous lesions.
| Pathology status | Non-met | Met | p value* |
|---|---|---|---|
|
| |||
| ATBF1 WI (SE) | ATBF1 WI (SE) | ||
| Nuclear ATBF1 | |||
| Simple hyperplasia | 86.2 (8.8) | 81.4 (12.8) | .76 |
| Low-grade dysplasia | 114.5 (9.9) | 104.0 (11.3) | .49 |
| High-grade dysplasia / CIS | 134.8 (9.8) | 113.2 (12.2) | .17 |
| Invasive tumor | 67.5 (7.5) | 56.8 (5.7) | .26 |
|
| |||
| Cytoplasmic ATBF1 | |||
| Simple hyperplasia | 110.9 (13.3) | 107.1 (13.5) | .85 |
| Low-grade dysplasia | 108.1 (13.7) | 126.7 (11.8) | .30 |
| High-grade dysplasia / CIS | 157.7 (7.6) | 156.4 (8.5) | .91 |
| Invasive tumor | 159.8 (7.5) | 163.4 (7.1) | .73 |
Abbreviations: ATBF1, AT-motif binding factor 1; WI, weight index; SE, standar error; CIS, carcinoma in situ; met, metastasis.
Note: p value was determined by the t-test (*).
Figure 1. ATBF1 protein detected by immunohistochemical staining in primary tumors of head and neck cancer.

A & B, highly heterogeneous and mainly nuclear staining of ATBF1 in squamous epithelial cells of simple hyperplasia. C & D, positive nuclear staining and slightly increased cytoplasmic staining of ATBF1 in low-grade dysplasia. E & F, significantly increased cytoplasmic ATBF1 staining in high-grade dysplasia. G & H, strong cytoplasmic but reduced or absent nuclear staining of ATBF1 in invasive tumors. Panels at the right (B, D, F, and H) are higher magnification views of the panels at the left (A, C, E, and G respectively). All scale bars are 50 μm.
Correlations of ATBF1 expression with clinical characteristics
To determine whether ATBF1 expression correlates with the metastatic potential of HNSCC, ATBF1 WI in HNSCC with and without metastatic disease were compared. Although non-metastatic patients tended to have slightly higher ATBF1 expression in the nucleus, the difference was not statistically significant (Table 3). Cytoplasmic ATBF1 levels were not different among the two groups either, suggesting that the ATBF1 protein level is not associated with the metastatic potential of HNSCC.
The ATBF1 level was not associated with other clinical characteristics including gender, tumor site, T classification, N classification, and stage grouping (Table 4), except that the nuclear ATBF1 level was significantly higher in well differentiated carcinomas (WI=85.1±11.8) when compared to moderately differentiated carcinomas (WI=53.4±5.7) (p=0.03).
Table 4.
Correlation of ATBF1 expression in the nucleus or the cytoplasm with histopathologic and clinical characteristics.
| Characteristics | Nuclear ATBF1 WI (SE) | p value | Cytoplasmic ATBF1 WI (SE) | p value |
|---|---|---|---|---|
| Sex | ||||
| Male | 62.0 (5.9) | .98 | 157.8 (6.2) | .33 |
| Female | 62.2 (7.9) | 168.1 (9.0) | ||
|
| ||||
| Smoking | ||||
| Yes | 60.8 (5.2) | .52 | 162.1 (5.7) | .99 |
| No | 69.5 (13.8) | 162.2 (13.9) | ||
|
| ||||
| Tumor site | ||||
| Oropharynx | 56.2 (10.5) | .48 | 141.4 (11.4) | .12 |
| Larynx | 56.5 (8.6) | 171.5 (9.4) | ||
| Oral cavity | 67.8 (6.7) | 164.0 (7.2) | ||
|
| ||||
| T classification | ||||
| T1 | 78.7 (8.4) | .11 | 160.6 (9.3) | .97 |
| T2 | 58.9 (8.0) | 160.0 (8.8) | ||
| T3 | 50.1 (12.3) | 167.1 (13.6) | ||
| T4 | 51.1 (10.5) | 159.1 (11.7) | ||
|
| ||||
| N classification | ||||
| N0 | 67.8 (6.8) | .57 | 158.6 (7.4) | .91 |
| N1 | 59.0 (14.9) | 158.8 (16.3) | ||
| N2 | 58.3 (7.9) | 165.9 (8.6) | ||
| N3 | 39.0 (22.9) | 152.9 (25.1) | ||
|
| ||||
| Stage grouping | ||||
| I | 84.5 (10.7) | .09 | 152.8 (11.8) | .65 |
| II | 68.1 (11.9) | 154.0 (13.1) | ||
| III | 52.3 (11.9) | 157.5 (13.1) | ||
| IV | 54.9 (6.6) | 167.6 (7.3) | ||
|
| ||||
| Differentiation | ||||
| WD | 85.1 (11.8) | .03* | 176.3 (13.0) | .10 |
| MD | 53.4 (5.7) | 164.8 (6.2) | ||
| PD | 74.9 (11.4) | 139.2 (12.6) | ||
Abbreviations: ATBF1, AT-motif binding factor 1; WI, weight index; SE, standar error; WD, well differentiated; MD, moderately differentiated; PD, poorly differentiated.
Notes: p value was determined by the t-test.
To determine the correlation of ATBF1 expression with patient survival, we defined ATBF1 expression as low or high level based on the median. No correlation was found between the nuclear ATBF1 level and patient survival. However, an increased cytoplasmic ATBF1 level was significantly associated with shorter overall survival (p=0.0386) and disease free survival (p=0.0253) (Fig. 2A, B), suggesting that higher levels of ATBF1 protein in the cytoplasm predict a poorer clinical outcome.
Figure 2. Correlation between cytoplasmic ATBF1 and worse overall survival and disease free survival as determined by Kaplan and Meier analysis.

Patients were divided into two groups based on the median weight index of cytoplasmic ATBF1 (high and low ATBF1), and the percentage of patients was plotted against overall survival (in years) (A) or disease-free survival (B). Higher levels of cytoplasmic ATBF1 significantly correlate with shorter overall survival (p=0.0386) and disease-free survival (p=0.0253).
ATBF1 expression in HNSCC cell lines
We analyzed ATBF1 expression at both the mRNA and protein levels in five HNSCC cell lines. All five cell lines had detectable ATBF1, although the mRNA levels did not correlate with their protein levels (Fig. 3A, B). Among the five cell lines, Tu177 had a highest protein level of ATBF1, while 212LN, Tu686, and Sqccy1 cells expressed little ATBF1 protein. ATBF1 protein expression was further confirmed by immunofluorescent staining (Fig. 3C). Interestingly, although Tu212 and Tu177 cells expressed the ATBF1 protein at a higher level, ATBF1 was predominantly localized in the cytoplasm, which is consistent with the observations in primary HNSCCs (Fig. 3C).
Figure 3. Expression and subcellular localization of ATBF1 in HNSCC cell lines.
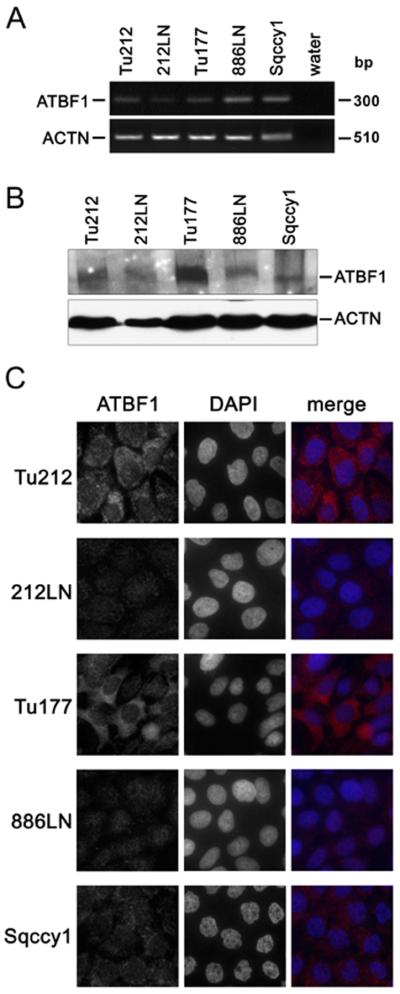
A. ATBF1 mRNA level determined by semi-quantitative RT-PCR in five cell lines. B. ATBF1 protein level in the same five cell lines detected by western blotting. ACTB served as the internal control in both A and B. C. Subcellular localization of ATBF1 detected by immunofluorescent staining. Nuclei were counterstained with DAPI. Endogenous ATBF1 was notably detected in the cytoplasm of the Tu212 and Tu177 cancer cell lines. Scale bars are 10 μm.
Discussion
In this study, we examined ATBF1 expression in tissues from different stages of HNSCC, and found that nuclear ATBF1 expression had a biphasic pattern during the development of HNSCC, since it increased from simple hyperplasia to high-grade dysplasia/carcinoma in situ but was significantly reduced when precancerous lesions progressed into invasive tumors. Although ATBF1 expression is more heterogeneous in normal tissues and simple hyperplasia than in dysplasia and invasive tumors, which resulted in a lower percentage of ATBF1-positive cells and led to smaller weight index for ATBF1 expression in normal tissues and simple hyperplasia, nuclear ATBF1 was still lower in invasive tumors when compared to simple hyperplasia and the difference was statistically significant in paired samples assay (p=0.0012). This result indicates that nuclear ATBF1 expression is reduced in HNSCC when compared to its adjacent precancerous tissues. The biphasic pattern of nuclear ATBF1 expression suggests that loss of nuclear ATBF1 might not contribute to the initiation steps of HNSCC but is associated with invasive cancers.
Unlike the biphasic pattern of nuclear ATBF1 expression in HNSCC, cytoplasmic ATBF1 was quite low in normal cells but increased during the histopathologic progression of HNSCC from hyperplasia/low-grade dysplasia to high-grade dysplasia/CIS and carcinoma. Furthermore, higher levels of cytoplasmic ATBF1 were significantly associated with poorer overall survival and early recurrence. These results suggest that increase in cytoplasmic ATBF1 expression could play an oncogenic role in the development and progression of HNSCC, and thus could be useful for predicting clinical outcomes in HNSCC patients.
An increase in both the nuclear and cytoplasmic ATBF1 in dysplasia suggests a transient increase in ATBF1 production in precancerous lesions of HNSCC, which could result from increased transcription or protein stability. Although the biological significance of this increase is unknown, one could speculate that cells might upregulate ATBF1 as a response to malignant transformation or as a mechanism to prevent tumor progression. Several known tumor suppressors have been found to be transiently upregulated in premalignant lesions, including p53, maspin and p16Ink4a.(27–29)
Interestingly, we observed mislocalization of ATBF1 in a significant number of cancers. Reduced nuclear ATBF1 and increased cytoplasmic ATBF1 suggest an interruption of ATBF1 entry into the nucleus during the histopathologic progression of HNSCC. A similar mislocalization of ATBF1 was also observed in HNSCC cell lines, where immunofluorescence staining showed that ATBF1 protein was mostly localized in the cytoplasm in HNSCC cell lines that have higher levels of ATBF1 protein. Mislocalization of ATBF1 was also observed in other types of cancer including breast cancer, where specific ATBF1 staining was detected in the nucleus of some normal epithelial cells but in the cytoplasm of many cancer cells.(11) In addition, nuclear ATBF1 level was associated with lower expression of MUC5AC, predicting a better prognosis in gastric cancer.(16, 30, 31) We also detected an increase of ATBF1 expression in the cytoplasm of prostate cancer cells (unpublished data). It seems mislocalization of ATBF1 to the cytoplasm frequently occurs in human malignancies and could play a causal role.
The mechanism of ATBF1 mislocalization in cancer cells is currently unknown. Since the majority of cancer specimens examined showed increased ATBF1 in the cytoplasm, it is unlikely that mutations in the ATBF1 gene caused the mislocalization, although we cannot exclude this possibility in some cases. Another possibility is that nuclear import of ATBF1 is hampered. We recently identified the nuclear localization sequence (NLS) of ATBF1 in a serine/threonine-rich region (unpublished data). It is possible that activation of certain oncogenic pathway(s) modifies this region and prevents ATBF1 from entering the nucleus in cancer cells.(32) A recent study showed that the runt domain transcription factor 3 (RUNX3) interacts with ATBF1 and translocates into the nucleus with ATBF1 in response to TGF-β signal transduction.(33) Staining of gastric cancers showed a significant correlation between ATBF1 and RUNX3 nuclear localization.(33) Although these findings could not explain our results in HNSCC because RUNX3 is only expressed in some basal cells of squamous epithelium, it highlights the possibility that the nuclear import cargo of ATBF1 may malfunction in cancer cells.(34) We are currently testing how ATBF1 mislocalization occurs.
Our previous studies revealed that ATBF1 may function as a tumor suppressor in the prostate and breast.(9, 12) Unexpectedly, although the current study suggests that nuclear ATBF1 might have lost its tumor suppressor function, cytoplasmic ATBF1 might have acquired an oncogenic function that predicts a poorer prognosis. This notion is not entirely new, as one of the CDK inhibitors, p27Kip1, inhibits the cyclin-E/CDK2 complex in the nucleus to negatively regulate the cell cycle, and suppresses tumorigenesis both in vitro and in vivo, while cytoplasmic p27Kip1 gained oncogenic activity that led to aberrant stem and progenitor cell expansion in the lung and retina.(35–38) Therefore, the molecular function of ATBF1 in HNSCC merits further investigation.
In summary, we analyzed the protein expression and subcellular distribution of ATBF1 in cell lines and tissue specimens of HNSCC, and observed that the entry of ATBF1 into the nucleus was often interrupted, and the mislocalization of ATBF1 protein in the cytoplasm was significantly associated with the histopathologic progression of HNSCC. The results suggest that mislocalization is a common mechanism by which ATBF1's normal function is interrupted in squamous epithelial cells, and that cytoplasmic ATBF1 may contribute to the tumorigenesis of HNSCC. Additional studies are needed to determine the function of nuclear and cytoplasmic ATBF1 in head and neck squamous cells, which would improve our understanding of HNSCC and benefit clinical treatment.
Acknowledgement
This work was supported in part by NIH grant R01 CA85560 (JT Dong) and a pilot project from the Head and Neck Cancer SPORE grant P50 CA128613 directed by DM Shin (X Sun).
Footnotes
*The work was presented in the 102th American Association for Cancer research annual meeting, Orlando, FL, 2011.
References
- 1.Jemal A, Siegel R, Xu J, Ward E. Cancer statistics, 2010. CA Cancer J Clin. 2010;60(5):277–300. doi: 10.3322/caac.20073. [DOI] [PubMed] [Google Scholar]
- 2.Morinaga T, Yasuda H, Hashimoto T, Higashio K, Tamaoki T. A human alpha-fetoprotein enhancer-binding protein, ATBF1, contains four homeodomains and seventeen zinc fingers. Mol Cell Biol. 1991;11(12):6041–9. doi: 10.1128/mcb.11.12.6041. [DOI] [PMC free article] [PubMed] [Google Scholar]
- 3.Yasuda H, Mizuno A, Tamaoki T, Morinaga T. ATBF1, a multiple-homeodomain zinc finger protein, selectively down-regulates AT-rich elements of the human alpha-fetoprotein gene. Mol Cell Biol. 1994;14(2):1395–401. doi: 10.1128/mcb.14.2.1395. [DOI] [PMC free article] [PubMed] [Google Scholar]
- 4.Miura Y, Tam T, Ido A, et al. Cloning and characterization of an ATBF1 isoform that expresses in a neuronal differentiation-dependent manner. J Biol Chem. 1995;270(45):26840–8. doi: 10.1074/jbc.270.45.26840. [DOI] [PubMed] [Google Scholar]
- 5.Ido A, Miura Y, Tamaoki T. Activation of ATBF1, a multiple-homeodomain zinc-finger gene, during neuronal differentiation of murine embryonal carcinoma cells. Dev Biol. 1994;163(1):184–7. doi: 10.1006/dbio.1994.1134. [DOI] [PubMed] [Google Scholar]
- 6.Watanabe M, Miura Y, Ido A, et al. Developmental changes in expression of the ATBF1 transcription factor gene. Brain Res Mol Brain Res. 1996;42(2):344–9. doi: 10.1016/s0169-328x(96)00204-5. [DOI] [PubMed] [Google Scholar]
- 7.Ishii Y, Kawaguchi M, Takagawa K, et al. ATBF1-A protein, but not ATBF1-B, is preferentially expressed in developing rat brain. J Comp Neurol. 2003;465(1):57–71. doi: 10.1002/cne.10807. [DOI] [PubMed] [Google Scholar]
- 8.Jung CG, Kim HJ, Kawaguchi M, et al. Homeotic factor ATBF1 induces the cell cycle arrest associated with neuronal differentiation. Development. 2005;132(23):5137–45. doi: 10.1242/dev.02098. [DOI] [PubMed] [Google Scholar]
- 9.Sun X, Frierson HF, Chen C, et al. Frequent somatic mutations of the transcription factor ATBF1 in human prostate cancer. Nat Genet. 2005;37(4):407–12. doi: 10.1038/ng1528. [DOI] [PubMed] [Google Scholar]
- 10.Xu J, Sauvageot J, Ewing CM, et al. Germline ATBF1 mutations and prostate cancer risk. Prostate. 2006;66(10):1082–5. doi: 10.1002/pros.20430. [DOI] [PubMed] [Google Scholar]
- 11.Zhang Z, Yamashita H, Toyama T, et al. ATBF1-a messenger RNA expression is correlated with better prognosis in breast cancer. Clin Cancer Res. 2005;11(1):193–8. [PubMed] [Google Scholar]
- 12.Sun X, Zhou Y, Otto KB, et al. Infrequent mutation of ATBF1 in human breast cancer. J Cancer Res Clin Oncol. 2007;133(2):103–5. doi: 10.1007/s00432-006-0148-y. [DOI] [PMC free article] [PubMed] [Google Scholar]
- 13.Kim CJ, Song JH, Cho YG, et al. Down-regulation of ATBF1 is a major inactivating mechanism in hepatocellular carcinoma. Histopathology. 2008;52(5):552–9. doi: 10.1111/j.1365-2559.2008.02980.x. [DOI] [PubMed] [Google Scholar]
- 14.Kataoka H, Miura Y, Joh T, et al. Alpha-fetoprotein producing gastric cancer lacks transcription factor ATBF1. Oncogene. 2001;20(7):869–73. doi: 10.1038/sj.onc.1204160. [DOI] [PubMed] [Google Scholar]
- 15.Cho YG, Song JH, Kim CJ, et al. Genetic alterations of the ATBF1 gene in gastric cancer. Clin Cancer Res. 2007;13(15 Pt 1):4355–9. doi: 10.1158/1078-0432.CCR-07-0619. [DOI] [PubMed] [Google Scholar]
- 16.Mori Y, Kataoka H, Miura Y, et al. Subcellular localization of ATBF1 regulates MUC5AC transcription in gastric cancer. Int J Cancer. 2007;121(2):241–7. doi: 10.1002/ijc.22654. [DOI] [PubMed] [Google Scholar]
- 17.Miura Y, Kataoka H, Joh T, et al. Susceptibility to killer T cells of gastric cancer cells enhanced by Mitomycin-C involves induction of ATBF1 and activation of p21 (Waf1/Cip1) promoter. Microbiol Immunol. 2004;48(2):137–45. doi: 10.1111/j.1348-0421.2004.tb03491.x. [DOI] [PubMed] [Google Scholar]
- 18.Nojiri S, Joh T, Miura Y, et al. ATBF1 enhances the suppression of STAT3 signaling by interaction with PIAS3. Biochem Biophys Res Commun. 2004;314(1):97–103. doi: 10.1016/j.bbrc.2003.12.054. [DOI] [PubMed] [Google Scholar]
- 19.Chung CD, Liao J, Liu B, et al. Specific inhibition of Stat3 signal transduction by PIAS3. Science. 1997;278(5344):1803–5. doi: 10.1126/science.278.5344.1803. [DOI] [PubMed] [Google Scholar]
- 20.Kaspar P, Dvorakova M, Kralova J, Pajer P, Kozmik Z, Dvorak M. Myb-interacting protein, ATBF1, represses transcriptional activity of Myb oncoprotein. J Biol Chem. 1999;274(20):14422–8. doi: 10.1074/jbc.274.20.14422. [DOI] [PubMed] [Google Scholar]
- 21.Nagpal JK, Mishra R, Das BR. Activation of Stat-3 as one of the early events in tobacco chewing-mediated oral carcinogenesis. Cancer. 2002;94(9):2393–400. doi: 10.1002/cncr.10499. [DOI] [PubMed] [Google Scholar]
- 22.Hardisson D. Molecular pathogenesis of head and neck squamous cell carcinoma. Eur Arch Otorhinolaryngol. 2003;260(9):502–8. doi: 10.1007/s00405-003-0581-3. [DOI] [PubMed] [Google Scholar]
- 23.Brabender J, Lord RV, Danenberg KD, et al. Increased c-myb mRNA expression in Barrett's esophagus and Barrett's-associated adenocarcinoma. J Surg Res. 2001;99(2):301–6. doi: 10.1006/jsre.2001.6186. [DOI] [PubMed] [Google Scholar]
- 24.Leeman RJ, Lui VW, Grandis JR. STAT3 as a therapeutic target in head and neck cancer. Expert Opin Biol Ther. 2006;6(3):231–41. doi: 10.1517/14712598.6.3.231. [DOI] [PubMed] [Google Scholar]
- 25.Wheeler SE, Suzuki S, Thomas SM, et al. Epidermal growth factor receptor variant III mediates head and neck cancer cell invasion via STAT3 activation. Oncogene. 2010;29(37):5135–45. doi: 10.1038/onc.2009.279. [DOI] [PMC free article] [PubMed] [Google Scholar]
- 26.Kim SY, Yang YS, Hong KH, et al. Adenovirus-mediated expression of dominant negative c-myb induces apoptosis in head and neck cancer cells and inhibits tumor growth in animal model. Oral Oncol. 2008;44(4):383–92. doi: 10.1016/j.oraloncology.2007.05.004. [DOI] [PubMed] [Google Scholar]
- 27.Chen Z, Trotman LC, Shaffer D, et al. Crucial role of p53-dependent cellular senescence in suppression of Pten-deficient tumorigenesis. Nature. 2005;436(7051):725–30. doi: 10.1038/nature03918. [DOI] [PMC free article] [PubMed] [Google Scholar]
- 28.Pierson CR, McGowen R, Grignon D, Sakr W, Dey J, Sheng S. Maspin is up-regulated in premalignant prostate epithelia. Prostate. 2002;53(4):255–62. doi: 10.1002/pros.10107. [DOI] [PubMed] [Google Scholar]
- 29.Michaloglou C, Vredeveld LC, Soengas MS, et al. BRAFE600-associated senescence-like cell cycle arrest of human naevi. Nature. 2005;436(7051):720–4. doi: 10.1038/nature03890. [DOI] [PubMed] [Google Scholar]
- 30.Kocer B, Soran A, Kiyak G, et al. Prognostic significance of mucin expression in gastric carcinoma. Dig Dis Sci. 2004;49(6):954–64. doi: 10.1023/b:ddas.0000034554.96191.66. [DOI] [PubMed] [Google Scholar]
- 31.Yu CJ, Shih JY, Lee YC, Shun CT, Yuan A, Yang PC. Sialyl Lewis antigens: association with MUC5AC protein and correlation with post-operative recurrence of non-small cell lung cancer. Lung Cancer. 2005;47(1):59–67. doi: 10.1016/j.lungcan.2004.05.018. [DOI] [PubMed] [Google Scholar]
- 32.Reed SI. Keeping p27(Kip1) in the cytoplasm: a second front in cancer's war on p27. Cell Cycle. 2002;1(6):389–90. doi: 10.4161/cc.1.6.261. [DOI] [PubMed] [Google Scholar]
- 33.Mabuchi M, Kataoka H, Miura Y, et al. Tumor suppressor, AT motif binding factor 1 (ATBF1), translocates to the nucleus with runt domain transcription factor 3 (RUNX3) in response to TGF-beta signal transduction. Biochem Biophys Res Commun. 2010;398(2):321–5. doi: 10.1016/j.bbrc.2010.06.090. [DOI] [PubMed] [Google Scholar]
- 34.Tsunematsu T, Kudo Y, Iizuka S, et al. RUNX3 has an oncogenic role in head and neck cancer. PLoS ONE. 2009;4(6):e5892. doi: 10.1371/journal.pone.0005892. [DOI] [PMC free article] [PubMed] [Google Scholar]
- 35.Besson A, Hwang HC, Cicero S, et al. Discovery of an oncogenic activity in p27Kip1 that causes stem cell expansion and a multiple tumor phenotype. Genes Dev. 2007;21(14):1731–46. doi: 10.1101/gad.1556607. [DOI] [PMC free article] [PubMed] [Google Scholar]
- 36.Polyak K, Lee MH, Erdjument-Bromage H, et al. Cloning of p27Kip1, a cyclin-dependent kinase inhibitor and a potential mediator of extracellular antimitogenic signals. Cell. 1994;78(1):59–66. doi: 10.1016/0092-8674(94)90572-x. [DOI] [PubMed] [Google Scholar]
- 37.Majumder PK, Grisanzio C, O'Connell F, et al. A prostatic intraepithelial neoplasia-dependent p27 Kip1 checkpoint induces senescence and inhibits cell proliferation and cancer progression. Cancer Cell. 2008;14(2):146–55. doi: 10.1016/j.ccr.2008.06.00. [DOI] [PMC free article] [PubMed] [Google Scholar]
- 38.Sicinski P, Zacharek S, Kim C. Duality of p27Kip1 function in tumorigenesis. Genes Dev. 2007;21(14):1703–6. doi: 10.1101/gad.1583207. [DOI] [PubMed] [Google Scholar]