

Abstract
Migrant Japanese populations in both the USA and Brazil have for a long time shown a higher prevalence of type 2 diabetes than native Japanese, suggesting an interaction of lifestyle and genetic predisposition in the etiology of type 2 diabetes. The overall objective of the Seattle Japanese American Community Diabetes Study was to learn more about the etiology and pathogenesis of type 2 diabetes in Japanese Americans. This metabolically based epidemiological study included extensive assessments of insulin sensitivity, insulin response, and adiposity with the latter including measurements of body fat distribution by both anthropometry and computed tomography. Because of this, the importance of visceral adiposity as a risk factor for abnormal glucose tolerance, hypertension, coronary heart disease and the metabolic syndrome was shown. In conjunction with an examination of diet and physical activity patterns, the result was a clearer understanding of the etiology and pathogenesis of type 2 diabetes in Japanese Americans. We propose that a lifestyle that fosters increased weight gain, especially in the visceral adipose depot, promotes the development of insulin resistance, which in turn exposes an underlying reduced β‐cell reserve in susceptible individuals, resulting in glucose intolerance and, eventually in many, the development of diabetes. We have shown that it might be possible to delay or prevent the development of diabetes through dietary and exercise interventions in individuals identified as having impaired glucose tolerance. The lessons learned from studying migrant Japanese in Seattle might in many ways be applicable to other populations of Asian origin. (J Diabetes Invest, doi: 10.1111/j.2040‐1124.2012.00195.x, 2012)
Keywords: Japanese Americans, Lifestyle, Obesity
Introduction
Historically, the prevalence of type 2 diabetes was low in Japan when compared with the USA. However, reports that diabetes prevalence is higher in Japanese Americans than in white Americans suggest that Japanese are not necessarily protected from developing hyperglycemia. Sloan reported in 1963 that the age‐adjusted rate for diabetes (per 1,000 person years) in Hawaii was 20.1 for Japanese and 7.3 in Caucasians1. This showed that Japanese might be inherently at risk of developing diabetes and that this is manifest on exposure to factors related to living in the USA. This possibility was further supported by research showing higher rates of abnormal glucose tolerance among Japanese Americans in Hawaii and California than in native Japanese2,3.
West described, in a seminal paper that appeared in 1974, the epidemic of diabetes among Native Americans who had previously not experienced much diabetes4. He wrote that environmental factors were exerting powerful influences and that obesity was a significant risk factor. Obesity, through its strong association with insulin resistance, is now widely accepted to significantly increase the risk for type 2 diabetes5,6. However, Japanese Americans, who like many other Asians had a body mass index (BMI) on average lower than of other populations, are still at risk of developing obesity‐related diseases7.
A pilot study was begun in 1979 and completed in 1981 to compare body size among diabetic Japanese American and Caucasian men in Seattle, and diabetic native Japanese men in Tokyo8,9. Japanese Americans were not as heavy as Caucasians, but were heavier on average than native Japanese. Dietary patterns were examined using 1‐day dietary recall interviews or 3‐day diet records. Daily kilocalories consumed by Japanese Americans and native Japanese were similar and less than consumed by Caucasians, but Japanese Americans took in much more total fat and less carbohydrate than native Japanese. The proportion of food consumed as fat was similar between Japanese Americans and Caucasians8,9. Thus, the diet pattern of Japanese Americans was closer to the Western diet than the Japanese diet, suggesting that one component of a ‘Westernized’ lifestyle – higher consumption of dietary fat – was followed by Japanese Americans and might play a role in their development of obesity and diabetes.
Because of these preliminary findings, the Seattle Japanese American Community Diabetes Study was begun to learn more about the interaction of ‘nature’ and ‘nurture’ in the development of type 2 diabetes in Japanese Americans (Figure 1). In the present review, we cover many of our key observations.
Figure 1.
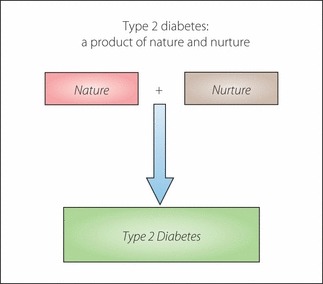
The overarching hypothesis for the Seattle Japanese American Community Diabetes Study was that nature and nurture interacted in the development of type 2 diabetes.
Seattle Japanese American Community Diabetes Study: Background and Design
When we first became interested in the study of diabetes in Japanese Americans, they were the third largest Asian ethnic group in the USA, after Chinese and Filipino10. Because of lower Japanese immigration to the USA compared with other Asian ethnicities, Japanese Americans now rank as the sixth largest Asian population after Chinese, Filipino, Asian Indians, Vietnamese and Koreans10,11. Most Japanese Americans belong to families that have a long history of being in the USA, an attractive characteristic for examining the influence of lifestyle factors in the development of type 2 diabetes.
The original immigrants from Japan to the USA arrived during a discrete and relatively short interval from the late 1800s until passage of the Immigration Act of 1924 stopped further immigration from Asia. This prohibition resulted in the isolation of Japanese couples in the USA to create a discrete, well‐defined immigrant generation that produced two fairly discrete succeeding generations. The first immigrant generation is called ‘Issei’ (first generation), with their children born in the USA being ‘Nisei’ (second generation) and their grandchildren being ‘Sansei’ (third generation). The Japanese American Community Diabetes Study included only individuals of pure Japanese ancestry residing in King County, Washington, who were Nisei or Sansei. This Japanese American population had already been exceptionally well characterized12.
Recruitment began in 1983 with a volunteer sample of Nisei men (n = 229). The study sample was expanded in 1986 to include Nisei women (n = 191) and Sansei men (n =120) and women (n = 118)13–15. As education in the USA is an important aspect of the Nisei life experience, American‐born Nisei who returned to Japan for their education were excluded. Nisei participants were selected to oversample diabetic individuals in order to compare diabetic with non‐diabetic individuals. Oversampling of diabetic individuals was not carried out for Sansei. Because of the large number of individuals with impaired glucose tolerance (IGT), impaired fasting glucose (IFG) or both found among the non‐diabetic participants, this sampling protocol also made it possible to compare persons with normal glucose tolerance (NGT), IFG, IGT, IFG/IGT and diabetes. Finally, although the study participants were volunteers, they were shown to be very similar in terms of several demographic characteristics to the overall Japanese American population of King County, Washington13,14.
The protocol for the present study was reviewed and approved by the Human Subjects Review Committee at the University of Washington, and signed informed consent was received from all participants. Baseline examinations were carried out from 1983 to 1986 for Nisei men, from 1986 to 1988 for Nisei women, and from 1988 to 1991 for all Sansei. In this prospective cohort study, participants were followed for 10 years with overall return rates of 72.9% for Nisei men, 72.3% for Nisei women, 80.8% for Sansei men and 80.5% for Sansei women. Among the large amount of baseline information obtained on each participant was information regarding lifestyle (diet, physical activity); blood pressure; bodyweight, height and BMI; anthropometry (waist and hip circumference, skinfold thickness); fasting lipids (cholesterol, low‐density lipoprotein [LDL] cholesterol, high‐density lipoprotein [HDL] cholesterol and triglycerides); glucose, insulin and C‐peptide at 0‐, 30‐, 60‐, 90‐ and 120‐min of a 75‐g oral glucose tolerance test (OGTT); and body fat areas measured by computed tomography (CT) with single slice scans of the thorax (nipples), abdomen (umbilicus) and thigh (mid‐thigh) to measure subcutaneous fat areas and, in the abdominal scan, visceral fat area. Measurements were repeated at follow‐up examinations scheduled at 5 and 10 years (a 2.5‐year follow‐up examination was also carried out in Nisei men).
Diabetes, Body Fat and Lifestyle in Nisei: Early Findings in Nisei Men
We estimated the prevalence of diabetes in Nisei men and women in the study population to be 20 and 16%, respectively13,14. In contrast, published prevalence rates of diabetes in Tokyo were 5% in men and 4% in women16. Also notable was that the prevalence of diabetes in Nisei was higher than in the adult USA population.
The earliest clues to the etiopathogenesis of type 2 diabetes in Japanese Americans came from the Nisei men with whom we began the present research. In order to learn more about possible differences in pathophysiology of diabetes between Nisei and Japanese, we compared Nisei diabetic men with diabetic men in Tokyo17. Both groups had similar mean ages and showed no significant difference in glucose levels during a 3‐h 75‐g OGTT (Figure 2). However, Nisei men had much higher insulin levels (Figure 3). Tokyo men all had diabetes duration of ≥2 years, whereas many Nisei had a shorter duration of diabetes, but a comparison of insulin levels with Nisei men having diabetes duration of ≥2 years still showed significantly higher insulin in Nisei. Thus, Nisei were very insulin resistant when compared with Tokyo men. Nisei men and Tokyo men had similar mean ages, but the former were heavier – mean BMI 25.7 kg/m2 in Nisei vs 21.8 kg/m2 in native Japanese – and insulin levels were significantly and positively correlated with BMI in Nisei. After adjustment for BMI, only the fasting insulin levels remained significantly different between Nisei and native Japanese, suggesting that factors other than body size also played a role in the greater insulin resistance in Nisei.
Figure 2.
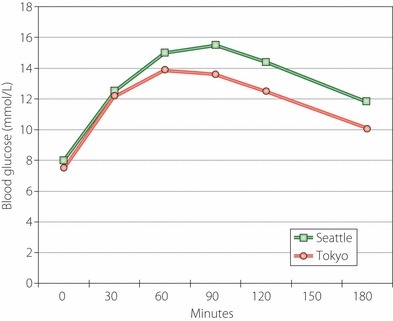
Mean blood glucose levels with 3‐h oral glucose tolerance test were not significantly different between diabetic men in Tokyo (n = 26) and Seattle (n = 68).
Figure 3.
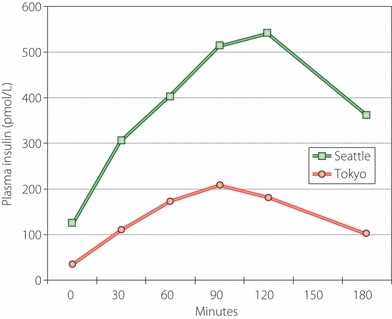
Mean plasma insulin levels with 3‐h oral glucose tolerance test were significantly higher (P < 0.006) in diabetic men in Seattle (n = 68) than in Tokyo (n = 26). Comparison of insulin assays between Seattle and Tokyo showed an excellent correlation (r = 0.885, P < 0.001) with Seattle levels tending to be slightly, but not significantly, lower than in Tokyo.
In addition to total body fat, body shape is also an important factor related to diabetes prevalence. After Vague18 reported that diseases such as diabetes are associated with body shape, the latter has been usually assessed by anthropometry; for example, measuring waist and hip circumference and skinfold thickness at several body surface sites. To distinguish central adiposity into visceral and subcutaneous adiposity, we also chose to use CT scans to examine body fat distribution by measuring subcutaneous fat areas in the chest and thigh, and both subcutaneous and visceral fat areas in the abdomen19–21. Soon after we began using this technique, we found that diabetic Nisei men tended to have more intra‐abdominal fat than Nisei men with NGT (Figure 4)22. A more extensive analysis of the baseline data in Nisei men that included measurements of general fatness as well as site‐specific fat deposition (BMI, subcutaneous skinfold thickness and CT) clearly identified the diabetes group as possessing disproportionately larger amounts of central fat compared with the IGT and NGT groups, whereas increased intra‐abdominal fat accompanied both IGT and diabetes23.
Figure 4.
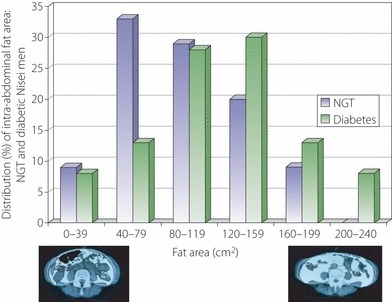
Diabetic Nisei men tended to have greater intra‐abdominal fat area by computed tomography (CT) than normal glucose tolerance (NGT) Nisei men. Two representative abdominal CT scans with low and high intra‐abdominal fat areas are shown at the bottom with intra‐abdominal fat colored white.
Diet was clearly a lifestyle‐related risk factor for diabetes in the Nisei men. Nisei men with type 2 diabetes consumed greater amounts of both total and animal fat and animal protein, less carbohydrate, and similar total kilocalories compared with non‐diabetic Nisei men24. Among men who entered the study without a prior history of diabetes, but who were found to have diabetes at the time of their baseline OGTT, there was increased intake of animal fat and protein, but not lower consumption of carbohydrate. The difference between men with previously diagnosed and undiagnosed diabetes was because the latter did not curtail intake of refined carbohydrate like those who already had a history of diabetes, showing that this behavior might be a conscious, self‐imposed change in response to their disease. These results suggested that increased consumption of animal fat and protein might be an important diabetes risk factor in Japanese Americans.
In a prospective analysis of Nisei men who had IGT at baseline, both dietary animal fat and animal protein intake at baseline were significantly correlated with 2‐h glucose levels during an OGTT at 5 years of follow up and also related to future diabetes25. Furthermore, baseline energy expenditure (physical activity) tended to be lower in those men who had higher glucose levels at 5 years. Interestingly, these detrimental effects were especially true for those with a positive family history of diabetes; that is, those who might already have a hereditary predisposition (Figure 5). In contrast, cross‐sectional data in Nisei men showed that diabetes was associated with increased BMI, waist circumference and intra‐abdominal fat only among those without a family history of diabetes26. As diabetes risk related to adiposity is presumably through insulin resistance, this suggested that the risk imposed by family history was more strongly attributable to other factors related to glucose metabolism; for example, β‐cell function.
Figure 5.
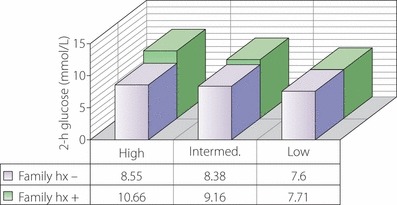
The mean 2‐h plasma glucose levels at 5 years of follow up in Nisei men who were impaired glucose tolerance at baseline were progressively higher as level of risk increased and were higher in those with a family history (hx) of diabetes. The trend with level of risk was significant (P < 0.05) in those with a family history of diabetes. Low risk: low dietary animal fat and protein plus high physical activity; intermediate risk: low dietary animal fat and protein and low physical activity or high dietary animal fat and protein and high physical activity; high risk: high dietary animal fat and protein and low physical activity.
Similar observations have come from Brazil, home of the largest Japanese population outside Japan. Japanese migration to Brazil increased markedly after immigration to the USA stopped in 1924 and continued until the start of the Second World War. The Japanese‐Brazilian population is therefore younger than their Japanese American counterparts. Consequently, a study carried out in the city of Bauru, Sao Paulo, included a substantial number of Issei, as well as Nisei and Sansei. This population had a high risk for type 2 diabetes, hypertension and dyslipidemia27. Whether born in Japan or in Brazil, the intake of energy from fat (approximately 32%) by Japanese Brazilians was substantially increased when compared with the usual intake reported in Japan (approximately 25%)28. In addition, the prevalence of BMI ≥ 30 kg/m2 was 7.5%, much higher than in Japan29,30. Notably, those Japanese Brazilians who had BMI ≥ 25.0 kg/m2 or central adiposity (waist circumference >80 cm for women and >90 cm for men) consumed higher proportions of energy as fat and lower proportions of energy as carbohydrate than those with BMI < 25.0 kg/m2 and without central adiposity31.
Importance of Body Fat Distribution as a Risk Factor: Further Studies
After showing that visceral adiposity was associated with prevalent diabetes, we found an association of visceral adiposity with prevalent coronary heart disease32, hypertension33,34 and dyslipidemia35. In prospective analyses, intra‐abdominal fat at baseline was more closely associated with incident diabetes than were baseline BMI, waist circumference or skinfold thickness at as early as 2.5 years of follow up in Nisei men36. These incident cases also had higher fasting C‐peptide levels and lower 30‐min insulin responses after oral glucose (incremental insulin response). In subsequent longer 10‐year follow‐up studies, we found that increased amounts of intra‐abdominal fat at baseline were independently related to incident coronary heart disease in Nisei men37 and to incident hypertension38, impaired glucose tolerance39, diabetes40 and metabolic syndrome41 in Nisei and Sansei men and women. Regarding incident diabetes, baseline data and the results of several multivariate models are shown in Tables 1 and 2.
Table 1. Characteristics of Nisei at baseline according to whether diabetes developed by the end of 10‐year follow up.
| Characteristic (mean) | Did not progress to diabetes (n = 211) | Progressed to diabetes (n = 65) | Odds ratio (95% CI) | P‐value |
|---|---|---|---|---|
| Age (years) | 61.1 | 63.3 | 1.7 (1.2–2.3) | 0.003 |
| Family history of diabetes (%) | 35 | 52 | 2.2 (1.3–3.6) | 0.004 |
| IGT at baseline (%) | 39 | 82 | 6.5 (3.4–12.5) | <0.001 |
| Fasting C‐peptide (pmol/L) | 0.86 | 0.98 | 1.3 (1.0–1.6) | 0.022 |
| Incremental insulin response | 46.7 | 32.4 | 0.4 (0.2–0.7) | 0.003 |
| Intra‐abdominal fat area (cm2) | 96.5 | 115.9 | 1.4 (1.1–1.8) | 0.018 |
| Subcutaneous abdominal fat area (cm2) | 163.1 | 160.2 | 1.0 (0.8–1.3) | 0.887 |
| Total fat area (cm2) | 494.1 | 500.7 | 1.0 (0.8–1.4) | 0.780 |
| BMI (kg/m2) | 24.1 | 24.9 | 1.0 (0.8–1.4) | 0.664 |
BMI, body mass index; CI, confidence interval; IGT, impaired glucose tolerance.
Table 2. Multivariate models of incident diabetes in Nisei (adjusted for age, female sex, impaired glucose tolerance at baseline, family history, fasting C‐peptide and incremental insulin response).
| Model | Variables | OR (95% CI) | P‐value |
|---|---|---|---|
| 1 | Intra‐abdominal fat area | 1.6 (1.1–2.3) | 0.019 |
| Non‐intra‐abdominal fat area | 0.7 (0.5–1.0) | 0.064 | |
| 2 | Intra‐abdominal fat area | 1.6 (1.1–2.4) | 0.023 |
| BMI | 0.8 (0.5–1.2) | 0.251 | |
| 3 | Intra‐abdominal fat area | 1.8 (1.1–2.8) | 0.012 |
| Total fat area | 0.7 (0.4–1.0) | 0.064 | |
| 4 | Intra‐abdominal fat area | 1.6 (1.1–2.3) | 0.013 |
| Subcutaneous abdominal fat area | 0.7 (0.5–1.0) | 0.078 |
BMI, body mass index.
As a result of the importance of the visceral adipose depot as a metabolic risk factor in Japanese Americans, we examined whether visceral adiposity might be associated with greater future insulin resistance independent of other adipose depots42. Non‐diabetic Japanese Americans were followed for 10 years and baseline variables were examined with respect to insulin resistance at 10 years. Insulin sensitivity was evaluated by the?homeostasis model assessment for insulin resistance (HOMA‐IR)43, fasting plasma insulin, Matsuda index44 and area under the OGTT curve of insulin (AUC insulin). Because the fasting insulin level as an estimate of insulin sensitivity might be confounded by differences in β‐cell function45, the difference between the insulin response at 30 min and fasting insulin divided by the difference between the glucose level at 30 min and fasting glucose was used to assess insulin release in all analyses of insulin sensitivity46. Both baseline intra‐abdominal fat area and all measurements of insulin sensitivity were independently associated with increased insulin resistance at follow up, and intra‐abdominal fat remained a significant predictor of increased insulin resistance even after adjustment for total subcutaneous fat area and total fat area by CT, BMI or waist circumference (Table 3). Therefore, visceral fat was the most important fat depot in the relationship between obesity and insulin resistance.
Table 3. Multiple linear regression analysis of Model 1 of homeostasis model assessment for insulin resistance at follow up.
| Independent variables (baseline) | Loge(HOMA‐IR) | |
|---|---|---|
| β | P‐value | |
| Intra‐abdominal fat area | 0.0361 | <0.001 |
| Abdominal subcutaneous fat area* | −0.0003 | 0.554 |
| HOMA‐IR† | 0.1327 | <0.001 |
| Incremental insulin response | 0.0003 | 0.665 |
| 2‐h plasma glucose | 0.0002 | 0.791 |
| Age | −0.0033 | 0.151 |
| Sex | −0.0692 | 0.227 |
| Model R2 | 0.362 | |
*Similar findings when total subcutaneous fat area or total fat area by computed tomography, body mass index or waist circumference was substituted for abdominal subcutaneous fat area.
†Similar findings when fasting insulin, Matsuda index, or area under the curve insulin was substituted for homeostasis model assessment for insulin resistance (HOMA‐IR).
We also examined over a 10‐year follow‐up interval whether increases in bodyweight and fat varied by age and sex in non‐diabetic Japanese American men and women47. The youngest participants gained the most weight, subcutaneous abdominal fat and intra‐abdominal fat. However, older individuals with comparable weight changes had relatively greater accumulation of fat within the intra‐abdominal and subcutaneous abdominal depots, showing that a smaller degree of weight gain at older ages might still result in adverse metabolic consequences similar to those seen in younger individuals. No effect of sex on changes in either bodyweight or fat was observed. Thus, it appeared that efforts aimed at preventing weight gain might best be directed towards younger age groups in order to reduce overall fat mass and especially visceral fat mass.
In addition to the relationship of age to intra‐abdominal fat accumulation, we have found baseline plasma leptin levels to be positively correlated over 5‐ and 10‐years follow up with change in bodyweight, BMI, total fat (measured by CT), and intra‐abdominal fat in non‐diabetic Japanese American men and women, suggesting that fat accumulation is preceded by increased leptin levels and thus might be associated with leptin resistance48,49. Furthermore, elevated baseline plasma leptin levels were shown to be associated with an increased risk of developing diabetes in Japanese American men, but not in women50. An additional risk factor for the development of central adiposity in men is low serum testosterone51. At 7.5‐years follow up of non‐diabetic Japanese American men, baseline total testosterone (measured at 2.5 years of follow up, ‘baseline’ for this analysis) was significantly and negatively correlated with increase in intra‐abdominal fat area, but not with BMI, total fat or subcutaneous fat52.
Although measurement of visceral adipose fat is clearly the gold standard for estimating obesity‐related disease risk in Japanese Americans, this measurement is not clinically practical. In contrast, waist circumference can be easily measured in a clinical?setting. Two of the most widely used sets of diagnostic criteria for the metabolic syndrome include waist circumference (≥102 cm for men and ≥88 cm for women) as being essential53,54. However, very few Japanese Americans meet these waist guidelines55. Because of this, we examined cross‐sectionally in Japanese Americans which waist circumference cut‐points (measured at the level of the umbilicus) had the strongest associations with at least two of the non‐adipose components of the metabolic syndrome as defined by the International Diabetes Federation56. Using receiver–operating characteristic (ROC) curves, the values that resulted in maximizing the Youden index were defined as ‘optimal’57,58. Optimal waist circumference cut‐points were found to be 84.5 cm for women and 90.0 cm for men. The optimal waist circumference for women, but not for men, was slightly different from the recommended waist circumference cut‐points for Asians (80 cm for women and 90 cm for men)59. We also examined BMI and visceral adiposity measured by CT. The optimal cut‐points for BMI were 23.3 kg/m2 for women and 25.3 kg/m2 for men, whereas those for intra‐abdominal fat area were 74.9 cm2 for women and 96.1 cm2 for men. These data are shown in Table 4. Intra‐abdominal fat area was better than either waist circumference or BMI in identifying Japanese Americans at risk for the metabolic syndrome. It should be noted, however, that the measurements of central adiposity were age‐dependent, particularly so in women. When stratified by median age, women aged ≤56 years had optimal cut‐points of 80.8 cm for waist circumference and 51.5 cm2 for intra‐abdominal fat area, whereas for women aged >56 years, the respective values were 89.0 cm and 86.3 cm2. These measurements were not so age‐dependent in men (Table 5). Thus age‐specific optimal cut‐points for waist circumference and intra‐abdominal fat area should be considered for women.
Table 4. Optimal cut‐points for intra‐abdominal fat area, waist and body mass index in men and women.
| Variable | Value | Sensitivity (%) | Specificity (%) | |
|---|---|---|---|---|
| Men | Intra‐abdominal fat area | 96.1 cm2 | 70.3 | 76.5 |
| Waist | 90.0 cm | 55.2 | 75.8 | |
| BMI | 25.3 kg/m2 | 60.4 | 71.2 | |
| Women | Intra‐abdominal fat area | 74.9 cm2 | 74.2 | 75.4 |
| Waist | 84.5 cm | 68.6 | 67.3 | |
| BMI | 23.3 kg/m2 | 60.5 | 70.2 |
BMI, body mass index.
Table 5. Optimal cut‐points for intra‐abdominal fat area and waist in men and women, stratified by median age.
| ≤57 years‐of‐age | >57 years‐of‐age | |
|---|---|---|
| Men | ||
| Intra‐abdominal fat area | 88.6 cm2 | 96.1 cm2 |
| Waist | 90.0 cm | 87.1 cm |
| ≤56 years‐of‐age | >56 years‐of‐age | |
| Women | ||
| Intra‐abdominal fat area | 51.5 cm2 | 86.3 cm2 |
| Waist | 80.8 cm | 89.0 cm |
Insulin Resistance and β‐Cell Dysfunction in Diabetes Pathogenesis
Insulin resistance is associated with obesity and with type 2 diabetes. Reaven proposed insulin resistance to be the primary abnormality in the development of type 2 diabetes60. However, not all obese individuals are diabetic, probably because some of these individuals have adequate β‐cell function to compensate for their insulin resistance. This is exemplified by the hyperbolic relationship between insulin sensitivity and insulin secretion61.
Porte considered islet dysfunction as playing the pivotal role in the pathogenesis of type 2 diabetes, with frequent contribution from insulin resistance62. Among Japanese Americans without diabetes at baseline, the product of OGTT‐derived measures of insulin response and insulin sensitivity, referred to as the oral disposition index, was calculated to assess β‐cell function63. This approach, utilizing the previously shown relationship between insulin sensitivity and insulin response, but using information for insulin sensitivity and insulin response that can be derived from an OGTT, delineated differences in the ability of the β‐cell to compensate for insulin resistance between oral glucose tolerance categories in Japanese Americans.
Clearly, there are persons with type 2 diabetes who are not obese and thus are presumably not very insulin resistant. Based on the relationship between insulin sensitivity and β‐cell function, such individuals develop hyperglycemia because they have more profound β‐cell dysfunction than equally hyperglycemic diabetic persons who are obese. This might explain the appearance of diabetes in native Japanese who are not as heavy as Japanese Americans. In addition, however, the balance between β‐cell dysfunction and insulin resistance in the pathogenesis of hyperglycemia might be somewhat different in Asians. We have proposed that Asian Americans who develop diabetes are a group in whom insulin resistance has been superimposed on a genetically determined reduced β‐cell reserve64. Japanese data?have shown that in individuals with normal fasting glucose, β‐cells begin to show deteriorating function during normoglycemia with a minimal elevation in fasting glucose. However, there are also glucose‐tolerant Japanese with considerable β‐cell dysfunction who presumably are normoglycemic, because they retain insulin sensitivity65. In another study of Japanese patients with normal fasting glucose and glycosylated hemoglobin levels, insulin secretory reserve was shown to be insufficient to compensate for increased insulin resistance66. In the past, it has been suggested that most cases of type 2 diabetes in the Japanese population were primarily a result of diminished β‐cell function; whereas in a much smaller group, especially in the obese, there was a significant contribution from insulin resistance67. These studies in aggregate support the hypothesis that Japanese might have diminished β‐cell reserve and thus might be susceptible to even small decreases in insulin sensitivity. An analysis of β‐cell function and insulin sensitivity among four ethnic groups in the USA, including Asians, also supports this hypothesis68.
The β‐cell abnormalities associated with diabetes fall into two main categories: altered stimulus‐secretion coupling of glucose as an insulin secretagogue and abnormal processing of secretory proteins. As an example of the former, Japanese Americans with abnormal glucose tolerance – either IGT or diabetes – have a later peak of insulin during an OGTT than those with NGT17,37,69. This delay was also a baseline risk factor for incident diabetes at 5 years in non‐diabetic Japanese Americans70. Notably, this group of incident cases at 5 years, although having delayed secretion of insulin after oral glucose, did not have any increase of either fasting insulin or intra‐abdominal fat at baseline, suggesting that the defect in insulin secretion might precede the development of visceral adiposity and insulin resistance during the development of type 2 diabetes. Another product of β‐cells that is co‐secreted with insulin is islet amyloid polypeptide, secretion of which is also reduced in type 2 diabetes. We found decreased secretion of islet amyloid polypeptide in Japanese Americans with either IGT or diabetes71.
An example of abnormal secretory protein processing is shown by disproportionately higher circulating proinsulin levels in type 2 diabetes, showing incomplete processing of proinsulin to insulin72. The concentration of proinsulin as a percentage of total immunoreactive insulin was higher in Japanese Americans with diabetes compared with those with NGT73. Furthermore, baseline proinsulin was higher in non‐diabetic Japanese American men who developed diabetes during 5 years of follow up than in those who remained non‐diabetic74. This was not attributable to over‐representation of IGT among those who developed diabetes, as men with IGT were not significantly different from NGT men. This is not surprising, as many individuals with IGT will not develop diabetes over 5 years of follow up. The magnitude of the relative proinsulinemia observed at baseline in those men who progressed to diabetes was less than observed in diabetic individuals, probably because β‐cell function is much more abnormal in the latter.
Genetic Susceptibility
The possibility has been raised that Japanese might be more genetically susceptible to insulin resistance and diabetes than Caucasians. Because of the importance of obesity, insulin resistance and β‐cell dysfunction in the pathophysiology of type 2 diabetes in Japanese Americans, we have examined the β3‐adrenergic receptor (Trp64Arg variant of its gene), thought to be involved in thermogenesis and lipolysis in humans; the peroxisome proliferator‐activated receptor γ (PPARγ2 gene), a transcription factor that plays an important role in adipocyte differentiation and expression of adipocyte‐specific genes; and glucokinase (GCK gene promoter), which plays an important role in glucose‐stimulated insulin secretion.
The Trp64Arg variant of the β3‐adrenergic receptor had been reported to be associated with higher fasting and 2‐h insulin levels, and HOMA‐IR in Japanese American men with IGT, but not with either NGT or diabetes in Hawaii75. We found that this variant was associated with abnormal glucose tolerance, but not with fasting insulin or body fat distribution in Japanese Americans76.
Considering PPARγ2, we reported that a Pro12Ala substitution in PPARγ2 was associated with lower BMI and improved insulin sensitivity among middle‐aged and elderly Finns, whereas a Pro/Pro genotype was found to be associated with type 2 diabetes among Japanese Americans77. In addition, we found that there was a trend for individuals with the Ala allele to have lower fasting insulin and BMI in each of the three glucose tolerance groups (NGT, IGT and diabetes)77. We found the frequency of the Pro allele to be significantly higher in Japanese Americans with diabetes than those with NGT, but this difference was not observed in native Japanese78. Diabetic Japanese Americans with the Pro/Pro genotype had significantly higher BMI and fasting insulin than diabetic native Japanese, but when the Ala/Ala genotype was present, this difference was not found. We postulated that lifestyle might modulate the effects of the Pro/Pro genotype of the PPARγ2 gene to increase bodyweight and insulin resistance, and thus increase the risk for type 2 diabetes.
We identified six variants of the GCK gene in Japanese Americans who had one or more first‐degree relatives with a history of type 2 diabetes79. The only variant that could possibly be associated with abnormal glucose tolerance was the variant at nucleotide −30 in the β‐cell specific promoter. This G→A polymorphism was examined in non‐diabetic Nisei men and was found to be present more frequently in those with IGT than in those with NGT, and was significantly associated with a lower value for the ratio of incremental plasma insulin response above basal at 30 min after oral glucose divided by incremental glucose80. When this ratio was divided by the fasting plasma insulin, used as a surrogate for insulin sensitivity, the resulting ‘relative insulin response’ was also significantly lower in those with the G→A polymorphism. Thus, the −30 β‐cell GCK gene promoter is associated with reduced β‐cell function and might contribute to the high risk of abnormal glucose tolerance in Japanese Americans.
It should be noted that several genome‐wide association studies in Japanese populations have shown an association with diabetes of polymorphisms in the transcription factor 7‐like gene, TCF7L2, and of variants in KCNQ1, the potassium voltage‐gated channel, subfamily Q, member 1 gene81–83. Most of the diabetes‐related gene variants in Japanese populations seem to be associated with β‐cell dysfunction.
Prevention
Although glucose‐lowering treatment prevents or ameliorates many of the complications associated with type 2 diabetes, the diagnosis might not be made until complications have already developed. Thus, it might be preferable to direct attention to the prevention of this disease. Our observational research had shown that lifestyle (increased dietary saturated fat and low physical activity) appeared to be closely related to the development of type 2 diabetes in Japanese Americans. Therefore, a lifestyle intervention directed towards reducing dietary saturated fat and increasing physical activity was selected for a pilot study intended to examine whether this combination improved factors associated with type 2 diabetes in Japanese Americans who were at increased risk of developing this disease.
Subsequent to our beginning the present study, the feasibility of preventing or delaying type 2 diabetes through lifestyle change (diet and exercise) was shown by clinical trials in China84, Finland85 and the USA86.
Although the measurement of fasting glucose is clinically more practical than an OGTT, we had shown that nearly 40% of 503 Japanese Americans with normal fasting glucose had abnormal glucose tolerance based on oral glucose testing (176 IGT, 20 diabetes)87. These individuals with abnormal glucose tolerance had more intra‐abdominal fat and total adiposity; higher fasting insulin, C‐peptide and triglyceride levels; lower HDL cholesterol levels; and higher blood pressure than those with NGT. Thus, classification by fasting glucose alone misses many Japanese Americans with less favorable cardiovascular risk profiles. Most importantly from the viewpoint of diabetes prevention, fasting glucose screening misses many Japanese Americans with IGT and even some with diabetes. Furthermore, the 2‐h glucose surpassed a clinical model (age, sex, ethnicity, BMI, systolic blood pressure, fasting plasma glucose, HDL cholesterol and family history of diabetes) reported to have been useful in predicting diabetes risk in Mexican Americans and non‐Hispanic white participants in the San Antonio Heart Study88,89. Hence, in Japanese Americans, the OGTT appeared to be essential in identifying persons at risk for development of type 2 diabetes.
We randomized 64 Japanese American men and women with IGT (from two separate OGTT) to 24 months of either an intervention consisting of an American Heart Association (AHA) step 2 diet (<30% of total calories as fat, <7% saturated fat, 55% carbohydrate and <200 mg cholesterol daily) plus endurance exercise for 1 h three times a week, or a control regimen of an AHA step 1 diet (30% of total calories as fat, 10% saturated fat, 50% carbohydrate and <300 mg cholesterol daily) plus stretching exercise three times a week90. Participants were supervised closely during the first 6 months, whereas for the subsequent 18 months, they were instructed to continue with their prescribed program. Measurements included BMI, body composition (% fat) assessed by underwater weighing, body fat distribution by CT and skinfolds, and insulin secretion and sensitivity (Si) by an insulin‐modified, frequently sampled, intravenous glucose tolerance test (FSIGTT) at baseline and at 6 and 24 months of follow up. A 75‐g OGTT was carried out at baseline, and at 6, 12 and 24 months of follow up. Intervention resulted in significant reduction at 6 and 24 months of overall adiposity as measured by bodyweight, BMI and underwater weighing (Figure 6). Body fat distribution, including intra‐abdominal fat, was also improved. Intervention also improved insulin sensitivity, but not β‐cell function (Figure 7). The proportion of participants showing NGT at least once during their 24 months of follow up was significantly greater in the intervention group (67% vs 30%, P = 0.01). The incremental glucose area during the OGTT as a measure of glucose tolerance was significantly lower in the intervention group at 6 months (P = 0.03) and showed a trend towards being lower at 18 months (P = 0.08). In linear regression models, the changes from baseline to 24 months for weight, percent body fat, and intra‐abdominal and subcutaneous fat areas were significantly associated with Si. In multiple linear regression models, the change in intra‐abdominal fat area was independently associated with Si after adjusting for change in subcutaneous fat area, whereas the latter was not independently associated with Si after adjusting for change in intra‐abdominal fat area91. These results suggest that lifestyle modification comprised of dietary saturated fat reduction and aerobic exercise reduces factors associated with diabetes risk, and therefore might delay or prevent type 2 diabetes in Japanese Americans with IGT.
Figure 6.
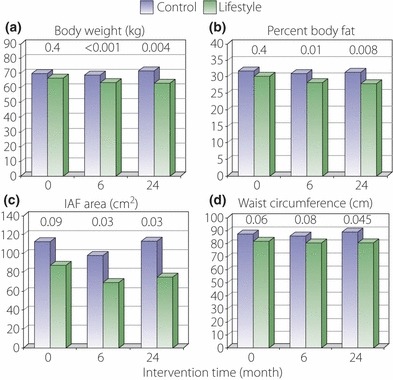
Lifestyle intervention significantly reduced overall adiposity as measured by (a) bodyweight and (b) underwater weighing at 6 and 24 months compared with control. Lifestyle intervention also significantly reduced (c) intra‐abdominal fat (IAF) area at 6 and 24 months and (d) waist circumference at 24 months compared with control. P‐values for control vs intervention group comparisons are shown above the bars.
Figure 7.
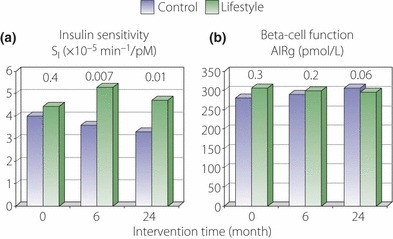
Lifestyle intervention significantly improved (a) insulin sensitivity at 6 and 24 months compared with control, but had no effect upon (b) beta‐cell function. P‐values for control vs intervention group comparisons are shown above the bars. AIRg, acute insulin response to glucose.
Recently, the results of an unmasked, multicenter, randomized, controlled trial of 641 overweight (mean BMI 27.0 kg/m2) native Japanese men and women with IFG have been reported from Japan92. Participants with IFG were tested by OGTT to exclude individuals with diabetes. Those remaining eligible were randomly assigned to a frequent intervention group or a control group. The intervention was the same for both groups (reduce total energy intake, taking into consideration Japan Diabetes Society recommendations for diabetic patients, increase physical activity, with a goal of a 5% reduction in bodyweight), but the frequency of support from study staff differed. The frequent intervention group received support from study staff at least nine times and as much as 11 times over 36 months, whereas the control group received much less frequent contact (four times over 36 months). There was a significant reduction in the cumulative incidence of type 2 diabetes in the frequent intervention group (12.2% vs 16.6%). Notably, this reduction was found in those participants who had IGT at baseline and was not observed in those with isolated impaired fasting glucose.
Thus, it appears that the risk of developing obesity‐related diseases, such as type 2 diabetes, might be reduced by imposition of lifestyle modification among both Japanese Americans and native Japanese.
Conclusions
Many epidemiological studies have shown associations between outcomes and risk factors that suggest cause and effect. The Seattle Japanese American Community Diabetes Study was planned to be a metabolically based epidemiological study with extensive measurements related to glucose metabolism, overall adiposity and body fat distribution, including serial CT measurements. The result is a clearer understanding of the etiology and pathogenesis of diabetes in Japanese Americans that might be applicable to many other populations of Asian origin. To prove the latter, prospective studies and clinical trials are necessary. In addition, to learn more about how hyperglycemia develops, these studies should include appropriate measurements of insulin sensitivity, insulin response, and adiposity, including body fat distribution. However, because of the expense that can be associated with such measurements, the research design will necessarily include a smaller number of study participants than classical epidemiologic research, which often includes hundreds or even thousands of individuals. Such an approach could even be expanded to provide the opportunity to determine how the pathogenesis of diabetes in Asians compares to that in other population groups.
It is not possible to modify one’s genetic background, so the approach to reverse the current epidemic of diabetes in Asian populations is to change lifestyle. A desirable outcome of the latter would be to reduce the development of ‘metabolic obesity’; that is, body fat accumulation that increases the risk of obesity‐related diseases. We have shown that this is feasible. Lifestyle changes can be applied broadly on a population basis, or can be directed to individuals who are judged to be at increased genetic risk for diabetes as ascertained by information, such as a family history of diabetes. Metabolic and genetic profiling might become a tool in the future to identify those individuals who have increased metabolic susceptibility to diabetes and to direct therapies that appropriately address the identified metabolic abnormalities.
In conclusion, a possible scenario for the ‘saga of Japanese in America’, that is, the history of the emigration of Japanese to the USA and the changes that have occurred in the population, is that a lifestyle transition has occurred. The pretransition lifestyle favored individuals who were able to efficiently store available food preferentially in a metabolically active visceral adipose compartment that allowed pancreatic islet β‐cell reserve to be low without detrimental consequence. The post‐transition lifestyle in which efficient fat storage was no longer essential might have caused visceral adiposity and insulin resistance to develop. This interaction of ‘nature’ and ‘nurture’ in turn brought out the shortcomings of a reduced β‐cell reserve, resulting in glucose intolerance and diabetes. The lesson is that if insulin resistance is prevented, it should be possible to prevent or delay progression to diabetes in this population.
Acknowledgements
This work was supported by grants from the Kroc Foundation and American Diabetes Association; National Institutes of Health Grants DK‐02654, DK‐02860, DK‐31170, DK‐48152, DK‐50703, DK‐55460, HL‐07028 and HL‐49293; and facilities and services provided by the Diabetes and Endocrinology Research Center (DK‐17047), Clinical Nutrition Research Unit (DK‐35816), and the General Clinical Research Center (RR‐00037) at the University of Washington. EJB and SEK were also supported by the United States Department of Veterans Affairs. WYF was also supported by a grant from the Japan Society for the Promotion of Science as a Visiting Researcher at the University of Tokyo, and gratefully acknowledges the support and assistance provided by Dr Kinori Kosaka, Dr Yasuo Akanuma and Dr Yasunori Kanazawa at the University of Tokyo and Dr Nobusada Kuzuya at the Asahi Institute in Tokyo. TH was supported by grants from the Uehara Memorial Foundation, the Nakatomi Foundation, and the Japanese Ministry of Education,?Science, Sports, and Culture as a Visiting Scholar at the University of Washington. All of the authors have contributed significantly to the collection and analysis of data, have reviewed and edited the manuscript, and have agreed to its content and submission for publication, and none have any financial relationships or support that might pose a conflict of interest. We thank the many skilled staff members at the University of Washington, especially Pamela Asberry, Jane Shofer, Christine Tsunehara, Pamela Yang and the staff of the General Clinical Research Center for their assistance, and also acknowledge the collaboration of many colleagues whose contributions are documented by their co‐authorship of the many papers that have resulted from this research. Last but not least, we are particularly grateful for the unswerving support and cooperation of the King County Japanese American community and our Community Advisory Board, without which we would not have been able to carry out this study.
References
- 1.Sloan R. Ethnic distribution of diabetes mellitus in Hawaii. JAMA 1963; 183: 419–424 [DOI] [PubMed] [Google Scholar]
- 2.Kagan A, Harris BR, Winkelstein W Jr, et al. Epidemiologic studies of coronary heart disease and stroke in Japanese men living in Japan, Hawaii, and California: demographic, physical, dietary and biochemical characteristics. J Chronic Dis 1974; 27: 345–364 [DOI] [PubMed] [Google Scholar]
- 3.Kawate R, Yamakido M, Nishimoto Y, et al. Migrant studies?among the Japanese in Hiroshima and Hawaii In: Waldhausl WK (ed). Diabetes 1979. Proc 10th Congr Int Diab Fed. Excerpta Med, Amsterdam, 1980; 526–531 [Google Scholar]
- 4.West K. Diabetes in American Indians and other native populations of the new world. Diabetes 1974; 23: 841–855 [DOI] [PubMed] [Google Scholar]
- 5.National Diabetes Data Group . Classification and diagnosis of diabetes mellitus and other categories of glucose intolerance. Diabetes 1979; 28: 1039–1057 [DOI] [PubMed] [Google Scholar]
- 6.Olefsky JM. Insulin resistance and insulin action: an in vitro and in vivo perspective. Diabetes 1981; 25: 1154–1165 [DOI] [PubMed] [Google Scholar]
- 7.McNeely MJ, Boyko EJ. Type 2 diabetes mellitus prevalence in Asian Americans. Diabetes Care 2004; 27: 66–69 [DOI] [PubMed] [Google Scholar]
- 8.Fujimoto WY, Hershon K, Kinyoun J, et al. Type II diabetes mellitus in Seattle and Tokyo. Tohoku J Exp Med 1983; 141(Suppl.): 133–139 [DOI] [PubMed] [Google Scholar]
- 9.Fujimoto WY, Hershon KS, Kinyoun JL, et al. Maturity‐onset diabetes in second generation Japanese American (Nisei) and Caucasian males in Seattle, Washington: a pilot study In: Melish JS, Hanna J, Baba S (eds). Genetic Environmental Interaction in Diabetes Mellitus. Excerpta Medica, Amsterdam, 1982; 101–106 [Google Scholar]
- 10.U.S. Census Bureau . World Wide Web: http://www.census.gov/prod/www/abs/decennial/1980cenpopv1.html
- 11.Reeves TJ, Bennett CE. We the people: Asians in the United States. U.S. Census Bureau, 2004. World Wide Web: http://www.census.gov/prod/2004pubs/censr‐17.pdf
- 12.Leonetti DL, Newell‐Morris L. Exogamy and change in the biosocial structure of a modern urban population. Am Anthropol 1982; 84: 19–36 [Google Scholar]
- 13.Fujimoto WY, Leonetti DL, Kinyoun JL, et al. Prevalence of diabetes mellitus and impaired glucose tolerance among second‐generation Japanese American men. Diabetes 1987; 36: 721–729 [DOI] [PubMed] [Google Scholar]
- 14.Fujimoto WY, Leonetti DL, Bergstrom RW, et al. Glucose intolerance and diabetic complication among Japanese American women. Diabetes Res Clin Pract 1991; 13: 119–130 [DOI] [PubMed] [Google Scholar]
- 15.Fujimoto WY, Bergstrom RW, Leonetti DL, et al. Metabolic and adipose risk factors for NIDDM and coronary disease in third‐generation Japanese American men and women with impaired glucose tolerance. Diabetologia 1994; 37: 524–532 [DOI] [PubMed] [Google Scholar]
- 16.Fujimoto WY. Diabetes in Asian Americans In: Harris MI, Hamman RF (ed). Diabetes in America, Diabetes Data Compiled 1984. U.S. Department of Health and Human Services, Public Health Service, National Institutes of Health, NIADDKD, Washington, D.C., 1985; X‐1–X‐12 [Google Scholar]
- 17.Fujimoto WY, Akanuma Y, Kanazawa Y, et al. Plasma insulin levels in Japanese and Japanese American men with type 2 diabetes may be related to the occurrence of cardiovascular disease. Diabetes Res Clin Pract 1989; 6: 121–127 [DOI] [PubMed] [Google Scholar]
- 18.Vague J. The degree of masculine differentiation of obesities: a factor determining predisposition to diabetes, atherosclerosis, gout, and uric calculous disease. Am J Clin Nutr 1956; 4: 20–34 [DOI] [PubMed] [Google Scholar]
- 19.Borkan GA, Gerzof SG, Robbins AH, et al. Assessment of abdominal fat content by computed tomography. Am J Clin Nutr 1982; 36: 172–177 [DOI] [PubMed] [Google Scholar]
- 20.Borkan GA, Hults DE, Gerzof SG, et al. Relationships between computed tomography tissue areas, thickness and total body composition. Ann Hum Biol 1983; 10: 537–546 [DOI] [PubMed] [Google Scholar]
- 21.Tokunaga K, Matsuzawa Y, Ishikawa K, et al. A novel technique for the determination of body fat by computed tomography. Int J Obes 1983; 7: 437–445 [PubMed] [Google Scholar]
- 22.Shuman WP, Newell‐Morris LL, Leonetti DL, et al. Abnormal body fat distribution detected by computed tomography in diabetic men. Invest Radiol 1986; 21: 483–487 [DOI] [PubMed] [Google Scholar]
- 23.Newell‐Morris LL, Treder RP, Shuman WP, et al. Fatness, fat distribution, and glucose tolerance in second‐generation Japanese American (Nisei) men. Am J Clin Nutr 1989; 50: 9–18 [DOI] [PubMed] [Google Scholar]
- 24.Tsunehara CH, Leonetti DL, Fujimoto WY. Diet of second‐generation Japanese American men with and without non‐insulin‐dependent diabetes. Am J Clin Nutr 1990; 52: 731–738 [DOI] [PubMed] [Google Scholar]
- 25.Leonetti DL, Tsunehara CH, Wahl PW, et al. Baseline dietary intake and physical activity of Japanese American men in relation to glucose tolerance at 5‐year follow‐up. Am J Hum Biol 1996; 8: 55–67 [DOI] [PubMed] [Google Scholar]
- 26.Fujimoto WY, Leonetti DL, Newell‐Morris L, et al. Relationship of absence or presence of a family history of diabetes to body weight and body fat distribution in type 2 diabetes. Int J Obes 1991; 15: 111–120 [PubMed] [Google Scholar]
- 27.Freire RD, Cardoso MA, Shinzato AR, et al. Nutritional status of Japanese‐Brazilian subjects: comparison across gender and generation. Br J Nutr 2003; 89: 705–712 [DOI] [PubMed] [Google Scholar]
- 28.Ferreira SRG, Iunes M, Franco LJ, et al. Disturbances of glucose and lipid metabolism in first and second generation of Japanese Brazilians. Diabetes Res Clin Pract 1996; 34(Suppl.): S59–S63 [DOI] [PubMed] [Google Scholar]
- 29.Gimeno SGA, Ferreira SRG, Cardoso MA, et al. Weight gain in adulthood and risk of developing glucose tolerance disturbance: a study of a Japanese‐Brazilian population. J Epidemiol 2000; 10: 103–110 [DOI] [PubMed] [Google Scholar]
- 30.World Health Organization . Obesity: Preventing and Managing the Global Epidemic. Report of a WHO Consultation on Obesity. World Health Organization, Geneva, 1997. [PubMed] [Google Scholar]
- 31.Ferreira SRG, Lerario DDG, Gimeno SGA, et al. Obesity and central adiposity in Japanese immigrants: role of the western dietary pattern. J Epidemiol 2002; 12: 431–438 [DOI] [PMC free article] [PubMed] [Google Scholar]
- 32.Bergstrom RW, Leonetti DL, Newell‐Morris LL, et al. Association of plasma triglyceride and C‐peptide with coronary heart disease in Japanese American men with a high prevalence of glucose intolerance. Diabetologia 1990; 33: 489–496 [DOI] [PubMed] [Google Scholar]
- 33.Boyko EJ, Leonetti DL, Bergstrom RW, et al. Visceral adiposity, fasting plasma insulin, and blood pressure in Japanese Americans. Diabetes Care 1995; 18: 174–181 [DOI] [PubMed] [Google Scholar]
- 34.Hayashi T, Boyko EJ, Leonetti DL, et al. Visceral adiposity and the prevalence of hypertension in Japanese Americans. Circulation 2003; 108: 1718–1723 [DOI] [PubMed] [Google Scholar]
- 35.Boyko EJ, Leonetti DL, Bergstrom RW, et al. Visceral adiposity, fasting plasma insulin, and lipid and lipoprotein levels in Japanese Americans. Int J Obes 1996; 20: 801–808 [PubMed] [Google Scholar]
- 36.Bergstrom RW, Newell‐Morris LL, Leonetti DL, et al. Association of elevated fasting C‐peptide and increased intra‐abdominal fat distribution with development of NIDDM in Japanese American men. Diabetes 1990; 39: 104–111 [DOI] [PubMed] [Google Scholar]
- 37.Fujimoto WY, Bergstrom RW, Boyko EJ, et al. Visceral adiposity and incident coronary heart disease in Japanese American men. The 10‐year follow‐up results of the Seattle Japanese American Community Diabetes Study. Diabetes Care 1999; 22: 1808–1812 [DOI] [PubMed] [Google Scholar]
- 38.Hayashi T, Boyko EJ, Leonetti DL, et al. Visceral adiposity is an independent predictor of incident hypertension in Japanese Americans. Ann Intern Med 2004; 140: 992–1000 [DOI] [PubMed] [Google Scholar]
- 39.Hayashi T, Boyko EJ, Leonetti DL, et al. Visceral adiposity and the risk of impaired glucose tolerance. A prospective study among Japanese Americans. Diabetes Care 2003; 26: 650–655 [DOI] [PubMed] [Google Scholar]
- 40.Boyko EJ, Fujimoto WY, Leonetti DL, et al. Visceral adiposity and risk of type 2 diabetes. A prospective study among Japanese Americans. Diabetes Care 2000; 23: 465–471 [DOI] [PubMed] [Google Scholar]
- 41.Tong J, Boyko EJ, Utzschneider KM, et al. Intra‐abdominal fat accumulation predicts the development of the metabolic syndrome in non‐diabetic Japanese Americans. Diabetologia 2007; 50: 1156–1160 [DOI] [PubMed] [Google Scholar]
- 42.Hayashi T, Boyko EJ, McNeely MJ, et al. Visceral adiposity, not abdominal subcutaneous fat area, is associated with an increase in future insulin resistance in Japanese Americans. Diabetes 2008; 57: 1269–1275 [DOI] [PubMed] [Google Scholar]
- 43.Matthews DR, Hosker JP, Rudenski AS, et al. Homeostasis model assessment: insulin resistance and beta‐cell function from fasting plasma glucose and insulin concentrations in man. Diabetologia 1985; 28: 412–419 [DOI] [PubMed] [Google Scholar]
- 44.Matsuda M, DeFronzo RA. Insulin sensitivity indices obtained from oral glucose tolerance testing: comparison with the euglycemic insulin clamp. Diabetes Care 2004; 22: 1462–1470 [DOI] [PubMed] [Google Scholar]
- 45.Boyko EJ, Leonetti DL, Bergstrom RW, et al. Fasting insulin level underestimates risk of non‐insulin‐dependent diabetes mellitus due to confounding by insulin secretion. Am J Epidemiol 1997; 145: 18–23 [DOI] [PubMed] [Google Scholar]
- 46.Wareham NJ, Phillips DI, Byrne CD, et al. The 30 minute insulin incremental response in an oral glucose tolerance test as a measure of insulin secretion. Diabet Med 1995; 12: 931 [DOI] [PubMed] [Google Scholar]
- 47.Lee CG, Fujimoto WY, Brunzell JD, et al. Intra‐abdominal fat accumulation is greatest at younger ages in Japanese American adults. Diabetes Res Clin Pract 2010; 89: 58–64 [DOI] [PMC free article] [PubMed] [Google Scholar]
- 48.Chessler SD, Fujimoto WY, Shofer JB, et al. Increased plasma leptin levels are associated with fat accumulation in Japanese Americans. Diabetes 1998; 47: 239–243 [DOI] [PubMed] [Google Scholar]
- 49.Tong J, Fujimoto WY, Kahn SE, et al. Insulin, C‐peptide, and leptin concentrations predict increased visceral adiposity at 5‐ and 10‐year follow‐ups in nondiabetic Japanese Americans. Diabetes 2005; 54: 985–990 [DOI] [PubMed] [Google Scholar]
- 50.McNeely MJ, Boyko EJ, Weigle DS, et al. Association between baseline plasma leptin levels and subsequent development of diabetes in Japanese Americans. Diabetes Care 1999; 22: 65–70 [DOI] [PubMed] [Google Scholar]
- 51.Seidell JC, Bjorntorp P, Sjostrom LS, et al. Visceral fat accumulation in men is positively associated with insulin, glucose, and C‐peptide levels, but negatively with testosterone levels. Metabolism 1990; 39: 897–901 [DOI] [PubMed] [Google Scholar]
- 52.Tsai EC, Boyko EJ, Leonetti DL, et al. Low serum testosterone level as a predictor of increased visceral fat in Japanese American men. Int J Obes 2000; 24: 485–491 [DOI] [PubMed] [Google Scholar]
- 53.Grundy SM, Cleeman JI, Daniels SR, et al. Diagnosis and management of the metabolic syndrome: an American Heart Association/National Heart, Lung, and Blood Institute scientific statement. Circulation 2005; 112: 285–290 [DOI] [PubMed] [Google Scholar]
- 54.Alberti KG, Zimmet P, Shaw J. Metabolic syndrome – a new world‐wide definition. Lancet 2005; 366: 1059–1062 [DOI] [PubMed] [Google Scholar]
- 55.McNeely MJ, Boyko EJ, Shofer JB, et al. Standard definitions of overweight and central adiposity for determining diabetes risk in Japanese Americans. Am J Clin Nutr 2001; 74: 101–107 [DOI] [PubMed] [Google Scholar]
- 56.Hayashi T, Boyko EJ, McNeely MJ, et al. Minimum waist and visceral fat values for identifying Japanese Americans at risk for the metabolic syndrome. Diabetes Care 2007; 30: 120–127 [DOI] [PubMed] [Google Scholar]
- 57.Youden WJ. An index for rating diagnostic tests. Cancer 1950; 3: 32–35 [DOI] [PubMed] [Google Scholar]
- 58.Perkins NJ, Schisterman EF. The inconsistency of “optimal” cut points obtained using two criteria based on the receiver operating characteristic curve. Am J Epidemiol 2006; 163: 670–675 [DOI] [PMC free article] [PubMed] [Google Scholar]
- 59.Steering Committee of the Western Pacific Region of the World Health Organization, the International Association for the Study of Obesity, and the International Obesity Task Force . The Asia‐Pacific Perspective: Redefining Obesity and Its Treatment. Health Communications Australia Pty Limited, Melbourne, 2000. [Google Scholar]
- 60.Reaven GM. Role of insulin resistance in human disease. Diabetes 1988; 37: 1595–1607 [DOI] [PubMed] [Google Scholar]
- 61.Bergman RN, Phillips LS, Cobelli C. Physiologic evaluation of factors controlling glucose tolerance in man: measurement of insulin sensitivity and β‐cell glucose sensitivity from the response to intravenous glucose. J Clin Invest 1981; 68: 1456–1467 [DOI] [PMC free article] [PubMed] [Google Scholar]
- 62.Porte D Jr. β‐cells in type II diabetes mellitus. Diabetes 1991; 40: 166–180 [DOI] [PubMed] [Google Scholar]
- 63.Utzschneider KM, Prigeon RL, Faulenbach MV, et al. Oral disposition index predicts the development of future diabetes above and beyond fasting and 2‐h glucose levels. Diabetes Care 2009; 32: 335–341 [DOI] [PMC free article] [PubMed] [Google Scholar]
- 64.Fujimoto WY, Bergstrom RW, Boyko EJ, et al. Type 2 diabetes and the metabolic syndrome in Japanese Americans. Diabetes Res Clin Pract 2000; 50(Suppl. 2): S73–S76 [DOI] [PubMed] [Google Scholar]
- 65.Sato Y, Komatsu M, Katakura M, et al. Diminution of early insulin response to glucose in subjects with normal but minimally elevated fasting plasma glucose. Evidence for early beta‐cell dysfunction. Diabet Med 2001; 19: 566–571 [DOI] [PubMed] [Google Scholar]
- 66.Kuroe A, Fukushima M, Usami M, et al. Impaired beta‐cell function and insulin sensitivity in Japanese subjects with normal glucose tolerance. Diabetes Res Clin Pract 2003; 59: 71–77 [DOI] [PubMed] [Google Scholar]
- 67.Yoshinaga H, Kosaka K. Heterogenous relationship of early insulin response and fasting insulin level with development of non‐insulin‐dependent diabetes mellitus in non‐diabetic Japanese subjects with or without obesity. Diabetes Res Clin Pract 1999; 44: 129–136 [DOI] [PubMed] [Google Scholar]
- 68.Jensen CC, Cnop M, Hull RL, et al. β‐cell function is a major contributor to oral glucose tolerance in high‐risk relatives of four ethnic groups in the U.S. Diabetes 2002; 51: 2170–2178 [DOI] [PubMed] [Google Scholar]
- 69.Bergstrom RW, Wahl PW, Leonetti DL, et al. Association of fasting glucose levels with a delayed secretion of insulin after oral glucose in subjects with glucose intolerance. J Clin Endocrinol Metab 1990; 71: 1447–1453 [DOI] [PubMed] [Google Scholar]
- 70.Chen KW, Boyko EJ, Bergstrom RW, et al. Earlier appearance of impaired insulin secretion than of visceral adiposity in the pathogenesis of NIDDM. Diabetes Care 1995; 18: 747–753 [DOI] [PubMed] [Google Scholar]
- 71.Kahn SE, Verchere CB, Andrikopoulos S, et al. Reduced amylin release is a characteristic of impaired glucose tolerance and type 2 diabetes in Japanese Americans. Diabetes 1998; 47: 640–645 [DOI] [PubMed] [Google Scholar]
- 72.Duckworth WC, Kitabchi AE, Heinemann M. Direct measurement of plasma proinsulin in normal and diabetic subjects. Am J Med 1972; 53: 418–427 [DOI] [PubMed] [Google Scholar]
- 73.Fujimoto W, Bergstrom R, Leonetti D, et al. Fasting proinsulin and insulin: relationship to NIDDM and coronary heart disease (abstract). Diabetes 1992; 41(Suppl. 1): 124A [Google Scholar]
- 74.Kahn SE, Leonetti DL, Prigeon RL, et al. Proinsulin as a marker for the development of NIDDM in Japanese American men. Diabetes 1995; 44: 173–179 [DOI] [PubMed] [Google Scholar]
- 75.Kawamura T, Egusa G, Okubo M, et al. Association of beta3‐adrenergic receptor gene polymorphism with insulin resistance in Japanese American men. Metabolism 1999; 48: 1367–1370 [DOI] [PubMed] [Google Scholar]
- 76.Stone LM, Kahn SE, Fujimoto WY, et al. Association of the Trp64Arg β3‐adrenergic receptor substitution with abnormal glucose tolerance but not body fat distribution or fasting insulin levels in Japanese Americans. Diabetes 1996; 45(Suppl. 2): 293A [Google Scholar]
- 77.Deeb S, Fajas L, Nemoto M, et al. A Pro12Ala substitution in PPARγ2 associated with decreased receptor activity, lower body mass index and improved insulin sensitivity. Nat Genet 1998; 20: 284–287 [DOI] [PubMed] [Google Scholar]
- 78.Nemoto M, Sasaki T, Deeb SS, et al. Differential effect of PPARγ2 variants in the development of type 2 diabetes between native Japanese and Japanese Americans. Diabetes Res Clin Pract 2002; 57: 131–137 [DOI] [PubMed] [Google Scholar]
- 79.Stone LM, Kahn SE, Deeb SS, et al. Glucokinase gene variations in Japanese Americans with a family history of NIDDM. Diabetes Care 1994; 12: 1480–1483 [DOI] [PubMed] [Google Scholar]
- 80.Stone LM, Kahn SE, Fujimoto WY, et al. A variation at position ‐30 of the β‐cell glucokinase gene promoter is associated with reduced β‐cell function in middle‐aged Japanese American men. Diabetes 1996; 45: 422–428 [DOI] [PubMed] [Google Scholar]
- 81.Miyake K, Horikawa Y, Hara K, et al. Association of TCF7L2 polymorphisms with susceptibility to type 2 diabetes in 4,087 Japanese subjects. J Hum Genet 2008; 53: 174–180 [DOI] [PubMed] [Google Scholar]
- 82.Yasuda K, Miyake K, Horikawa Y, et al. Variants in KCNQ1 are?associated with susceptibility to type 2 diabetes mellitus. Nat Genet 2008; 40: 1092–1097 [DOI] [PubMed] [Google Scholar]
- 83.Yokoi N, Kanamori M, Horikawa Y, et al. Association studies of variants in the genes involved in pancreatic beta‐cell function in type 2 diabetes in Japanese subjects. Diabetes 2006; 55: 2379–2386 [DOI] [PubMed] [Google Scholar]
- 84.Pan XR, Li GW, Hu YH, et al. Effects of diet and exercise in preventing NIDDM in people with impaired glucose tolerance: the Da Qing IGT and Diabetes Study. Diabetes Care 1997; 20: 537–544 [DOI] [PubMed] [Google Scholar]
- 85.Tuomilehto J, Lindstrom J, Eriksson JG, et al. Prevention of type 2 diabetes mellitus by changes in lifestyle among subjects with impaired glucose tolerance. N Engl J Med 2001; 344: 343–350 [DOI] [PubMed] [Google Scholar]
- 86.Diabetes Prevention Program Research Group . Reduction in the incidence of type 2 diabetes with lifestyle intervention or metformin. N Engl J Med 2002; 346: 393–403 [DOI] [PMC free article] [PubMed] [Google Scholar]
- 87.Liao D, Shofer JB, Boyko EJ, et al. Abnormal glucose tolerance and increased risk for cardiovascular disease in Japanese Americans with normal fasting glucose. Diabetes Care 2001; 24: 39–44 [DOI] [PubMed] [Google Scholar]
- 88.McNeely MJ, Boyko EJ, Leonetti DL, et al. Comparison of a clinical model, the oral glucose tolerance test, and fasting glucose for prediction of type 2 diabetes risk in Japanese Americans. Diabetes Care 2003; 26: 758–763 [DOI] [PubMed] [Google Scholar]
- 89.Stern MP, Williams K, Haffner SM. Identification of persons at high risk for type 2 diabetes mellitus: do we need the oral glucose tolerance test? Ann Intern Med 2002; 136: 575–581 [DOI] [PubMed] [Google Scholar]
- 90.Liao D, Asberry PJ, Shofer JB, et al. Improvement of BMI, body composition, and body fat distribution with lifestyle modification in Japanese Americans with impaired glucose tolerance. Diabetes Care 2002; 25: 1504–1510 [DOI] [PubMed] [Google Scholar]
- 91.Carr DB, Utzschneider KM, Boyko EJ, et al. A reduced‐fat diet and aerobic exercise in Japanese Americans with impaired glucose tolerance decreases intra‐abdominal fat and improves insulin sensitivity but not β‐cell function. Diabetes 2005; 54: 340–347 [DOI] [PubMed] [Google Scholar]
- 92.Saito T, Watanabe M, Nishida J, et al. Lifestyle modification and prevention of type 2 diabetes in overweight Japanese with impaired fasting glucose levels. Arch Intern Med 2011; 171: 1352–1360 [DOI] [PubMed] [Google Scholar]