

Abstract
Purpose
To determine the variability in CT measurements of proximal thoracic aortic diameters obtained using double-oblique short axis and semiautomatic centerline analysis techniques.
Methods
Institutional review board approval, with waiver of informed consent, was obtained for this HIPAA-compliant, retrospective study. Cardiac gated thoracic aortic CT scans were evaluated in 25 patients. Maximum aortic diameter measurements at the annulus, sinuses, sinotubular junction and ascending aorta were generated using double-oblique short axis and semiautomatic centerline analysis techniques. Intraobserver and interobserver variability and variability between techniques were assessed using the Wilcoxon signed rank test, Spearman’s correlation coefficients and Bland-Altman plots.
Results
Mean intraobserver diameter differences using double oblique views ranged from −0.3 – 0.6 mm. The 95% confidence interval for difference in diameters was ±2.4 – ±5.1 mm for radiologist #1 and ±2.6 – ±5.2 mm for radiologist #2, depending on location. Mean intraobserver diameter differences using centerline analysis ranged from 0.2 – 2.3 mm, and the 95% confidence interval for difference in diameters was ±2.0 – ±4.6 mm, depending on location. Significant interobserver differences were seen for both double oblique views and centerline analysis. Measurements obtained using the two methods were strongly correlated (r = 0.81 – 0.99), although they were consistently larger using centerline analysis (95% confidence interval, ±1.8 – ±3.2 mm).
Conclusions
Although measurement variability of the proximal thoracic aorta was generally low using double oblique and centerline analysis techniques, differences of up to approximately 5 mm in diameter occurred within the 95% confidence interval. Neither technique was clearly more reliable than the other.
Keywords: Aortic measurements, thoracic aorta, three dimensional imaging, reproducibility of results
Introduction
CT imaging is commonly used to determine aortic caliber and change in caliber over time. Measurements may be obtained using different methods, including manual diameters from axial images and double-oblique short axis views and semiautomatic diameters from 3D centerline analysis [1] [2]. It has been shown that the use of axial images leads to overestimation of aortic size at the root and sinotubular junction, potentially impacting surgical decision making [2]. The double oblique method is commonly available to radiologists using advanced image processing workstations, and is quickly and easily accomplished. On the other hand, semiautomatic centerline analysis is generally performed by trained technologists in a dedicated 3D imaging lab. The measurements generated for and included in clinical reports are relied upon to guide appropriate therapy, including surgical aortic replacement and transcatheter therapies in selected patients [3–7]. However, the repeatability and reproducibility of these measurements, and the correlation between measurements obtained using different methods, is largely unknown, and therefore, the reliability of a single CT measurement and the significance of small changes in diameter over time is unclear. There have been several previous studies that have examined aortic diameter measurement variability at CT; however, the measurement techniques employed in many these studies had a variety of drawbacks, and most of these techniques are no longer used in clinical practice. For example, some studies used only fully automatic contouring of the opacified aortic lumen to determine aortic diameters, without the necessary and essential manual adjustments that are commonly needed to correct erroneous centerline determinations and to include intraluminal thrombus, false lumens, or thickened aortic walls [8,9]. Other studies used only standard axial images rather than double-oblique views, thereby resulting in inaccurate aortic diameters [10]. Thus, the degree of variability in proximal thoracic aortic measurements using current CT techniques remains to be established.
The aim of our study was to determine the variability in CT measurements of proximal thoracic aortic diameters obtained with state of the art tools that are used in daily clinical practice, namely double-oblique short axis and semiautomatic centerline analysis techniques.
Materials and Methods
Institutional review board approval, with waiver of informed consent, was obtained for this HIPAA-compliant, retrospective study.
Study population
37 consecutive, non-operated patients with cardiac gated thoracic aortic CT and transesophageal echocardiography (TEE) were identified via data mining of hospital information systems. (Patients with TEE scans were selected for future correlation between CT measurements and TEE measurements.) Twelve patient CT exams were excluded due to motion artifact, leaving 25 exams (in 25 patients) for further analysis. The 25 patients included 19 men and 6 women, ranging in age from 22–80 years (mean 64 years). CT exams were performed to evaluate a known ascending aortic aneurysm (14 patients), to assess for aortic disease in the setting of known aortic valve disease (10 patients), or to evaluate for a suspected aortic dissection (1 patient). No patients showed a dissection of the proximal aorta on these studies.
CT imaging techniques
CT exams were performed on 64-detector CT scanners (Discovery CT750HD, GE Healthcare, Milwaukee, WI). Images were obtained through the thoracoabdominal aorta and pelvic arteries (lung apices to symphysis pubis) during intravenous injection of 120 ml iopamidol 370mg I/ml (Isovue 370, Bracco Diagnostics, Inc., Princeton, NJ) at 4 ml/second, followed by a 50 ml saline chaser at 4 ml/second. Retrospective ECG-gating was used during scanning of the thoracic portion of the examination, with axial reconstructions at 75% of the R-R cycle. Most of these exams were baseline studies, with no previous CT or MR imaging for comparison. Due to the known association of abdominal aortic aneurysms with thoracic aortic aneurysms [11], we routinely image the entire aorta on baseline exams in order to screen for additional aneurysms. Retrospective, rather than prospective, ECG-gating was employed because, on our scanners, a fast switch between the gated thoracic exam and the ungated abdominal/pelvic exam could only be accomplished with retrospective gating, enabling the use of a single bolus of intravenous contrast material and the ability to seamlessly obtain 3D reconstructions from the entire data set. No pharmacologic agents were used for heart rate control; generally these were unnecessary due to the use of retrospective gating, rather than prospective gating.
CT scanner detector collimation width was 0.625 mm, and images were reconstructed at 1.25 ml thickness and 0.625 ml intervals using a 25 cm field of view. Gantry rotation time was 0.4 second and the scan pitch was 0.23–.026. Depending on the patient size, the maximum tube current ranged from 438 – 700 mA, and kVp was fixed at 100–120. Typical DLP values for the ECG-gated portions of the examinations ranged from approximately 700–1300 mGy-cm.
Measurement techniques
Aortic measurements were obtained using two different techniques. All evaluators were blinded to all clinical data and to any previously obtained measurements. Firstly, two faculty radiologists with 25 and 5 years of experience, respectively, in cross sectional imaging (and with specialization in cross sectional vascular imaging) independently evaluated the CT studies. For each exam, the radiologist generated double-oblique short axis views through the proximal aorta on an independent imaging workstation (Vital Images workstations, Vitrea 6.0.1 3D analysis software, Minnetonka, MN). Measurements were then manually obtained from these images to determine the largest diameter at the following locations: annulus, sinuses (cusp to cusp), sinotubular junction, and mid ascending aorta. In addition, the aortic root was measured from each sinus cusp (right, left, and non-coronary) to the opposite commissure. The thickness of the aortic wall was included in the measurements. For each patient, this entire procedure was repeated by each radiologist, including the creation of new double-oblique reconstructions; an interval of at least two weeks between measurement sessions was used to assure lack of recall bias when remeasuring. Secondly, measurements at the same aortic locations were obtained in the department’s 3D lab by a single experienced CT technologist using standard semiautomatic centerline analysis [1] on an independent workstation (Advantage Windows workstations, software version 4.5, GE Healthcare, Milwaukee, WI); outer aortic wall contours were adjusted by the technologist, as necessary, in order to include the wall and exclude adjacent structures. The same measurements were repeated by the same technologist at least two weeks later, using newly generated centerline analysis images. These measurements were called “research semiautomatic centerline analysis measurements.” All measurements were rounded to the nearest mm. A technologist performed these measurements (rather than a radiologist) in order to simulate day to day clinical practice. As in clinical practice, these measurements were checked by a radiologist for accuracy in delineating aortic contours and choosing short axis planes for measurement.
In addition, measurements at the sinuses (maximum cusp to cusp only), sinotubular junction, and mid ascending aorta were extracted from the clinically generated CT report and used for comparison purposes; the other measurements used for this research study were not included in the clinical report. These clinical measurements were generated in the 3D lab by a variety of trained CT technologists using standard semiautomatic centerline analysis, immediately after the scan was performed; these measurements were called “clinical semiautomatic centerline analysis measurements.”
No specific threshold level of aortic contrast enhancement was needed for performing semiautomatic centerline analysis, as this varies by patient and may be affected by a variety of parameters such as graininess of images (related to body habitus), motion artifact and vessel diameter and shape. Also, the degree of contrast enhancement was generally not important for obtaining radiologist generated double-oblique short axis measurements, because contrast is not needed for this technique, except at the level of the aortic annulus.
Statistical analysis
The first and the second measurements were compared for each radiologist and for the semiautomatic centerline analysis to assess the intraobserver variation. For interobserver variation, the mean measurements from one radiologist were compared to the mean measurements from the other radiologist, and the mean measurements from the research semiautomatic centerline analysis were compared to the clinical semiautomatic centerline analysis measurements. The overall average of the measurements from the double-oblique views from both radiologists was also calculated for comparison with the average of the measurements obtained using research semiautomatic centerline analysis. Both intraobserver and interobserver variation were evaluated using the same methods. The Wilcoxon signed rank test was used and the direction of the differences at each location was noted. Scatter plots were produced to display the data. Bland-Altman plots were created including the range of mean difference (mm) ± 1.96 standard deviation (SD) [12]. Spearman’s correlation coefficients were used to assess the relationships between the double-oblique views and the semiautomatic centerline analyses. A 5% level of significance was used to evaluate statistical significance in all analyses. No adjustment was made for multiple comparisons.
Results
The aortic measurements obtained using different techniques are shown in Table 1. The intraobserver variation analysis results are shown in Table 2. Statistical significance was found at one location for radiologist #1 (largest sinuses diameter cusp to cusp) and at two locations for radiologist #2 (annulus and non-coronary sinus cusp to commissure) using double-oblique views. The range of the mean difference across the locations for radiologist #1 was −0.3 – 0.6 mm; the smallest difference to the largest difference was −6.0 – 9.0 mm. For radiologist #2, the range of the mean difference across the locations was −1.0 – 0.2 mm; the smallest to the largest difference was −4.0 – 11.0 mm. The 95% confidence interval for difference in diameters was ±2.4 – ±5.1 mm for radiologist #1 and ±2.6 – ±5.2 mm for radiologist #2, according to location. Figure 1 shows different measurements for the same anatomic location using the double-oblique method.
Table 1.
Maximum aortic diameters as measured using double-oblique views and semiautomatic centerline analysis (N= 25 patients)a
| Aortic location |
Double-oblique Views Radiologist #1 |
Double-oblique Views Radiologist #2 |
Semiautomatic Centerline Analysis Research measurements |
Semiautomatic Centerline Analysis Clinical measurements |
|---|---|---|---|---|
| Annulus | 30.2±2.9 (26.0, 36.5) | 29.7±3.5 (24.5, 38.0) | 30.6±3.3 (26.0, 39.0) | N/A |
| Sinuses | ||||
| Non-coronary sinus cusp to commissure | 38.4±5.2 (30.0, 50.0) | 37.7±5.8 (28.5, 52.0) | 39.3±5.4 (32.5, 55.0) | N/A |
| Right coronary sinus cusp to commissure | 37.3±5.5 (30.0, 50.5) | 36.3±5.9 (27.0, 50.0) | 38.3±5.8 (31.0, 50.5) | N/A |
| Left coronary sinus cusp to commissure | 38.5±5.8 (27.5, 51.5) | 37.2±6.5 (27.5, 55.0) | 39.7±6.1 (28.5, 56.0) | N/A |
| Largest diameter cusp to cusp | 42.3±5.5 (34.0, 54.5) | 42.7±7.0 (31.0, 60.5) | 43.3±6.4 (34.0, 59.5) | 43.2±6.2 (34.0, 61.0) |
| Sinotubular junction | 37.5±8.1 (28.0, 66.0) | 38.3±7.8 (28.5, 65.0) | 39.8±8.0 (30.0, 65.0) | 40.3±7.6 (31.0, 66.0) |
| Mid ascending | 41.9±7.6 (26.5, 65.0) | 42.8±7.5 (26.5, 64.5) | 42.9±7.3 (25.0, 61.0) | 43.6±7.1 (26.0, 59.0) |
Mean measurements in mm ± SD (min, max)
N/A: measurements not included in clinical report
Table 2.
Intraobserver variability in aortic diameter measurements (N= 25 patients)a
| Aortic location |
Double-oblique Views Radiologist #1 |
Double-oblique Views Radiologist #2 |
Semiautomatic Centerline Analysis Research measurements |
|---|---|---|---|
| Annulus | 0.1±1.2 (−3.0, 2.0) | −1.0±1.7 b (−4.0, 3.0) | 0.2±1.9 (−3.0, 5.0) |
| Sinuses | |||
| Non-coronary sinus cusp to commissure | 0±1.3 (−3.0, 3.0) | −0.8±1.3 b (−4.0, 1.0) | 0.9±1.8 b (−4.0, 5.0) |
| Right coronary sinus cusp to commissure | 0.6±1.3 (−2.0, 4.0) | −0.4±1.5 (−3.0, 3.0) | 1.8±2.3 b (−2.0, 9.0) |
| Left coronary sinus cusp to commissure | 0.6±2.6 (−3.0, 9.0) | 0.1±1.6 (−3.0, 4.0) | 2.3±2.0 b (−1.0, 9.0) |
| Largest diameter cusp to cusp | 0.6±1.4 b (−1.0, 5.0) | 0.1±1.7 (−4.0, 3.0) | 0.8±2.0 b (−2.0, 7.0) |
| Sinotubular junction | 0.2±1.4 (−2.0, 3.0) | 0.2±1.5 (−3.0, 3.0) | 1.8±1.7 b (−2.0, 6.0) |
| Mid ascending | −0.3±1.7 (−6.0, 3.0) | 0.1±2.7 (−2.0, 11.0) | 1.0±1.0 b (−2.0, 2.0) |
Mean difference in mm ± SD (min, max)
p < 0.05
Figure 1.


(a and b): Two different measurements at the level of the mid ascending aorta in the same patient created using radiologist generated double-oblique short axis views. Note that slightly different obliquities result in different maximum diameters.
For six of the measurement locations, intraobserver differences were significantly different using research semiautomatic centerline analysis, and the differences were all in the same direction. The mean difference across locations was 0.2 – 2.3 mm, and the smallest to the largest difference was −4.0 – 9.0 mm. The 95% confidence interval for diameter differences was ±2.0 – ±4.6 mm, according to location. Figure 2 shows different measurements for the same anatomic location using the semiautomatic centerline analysis method.
Figure 2.


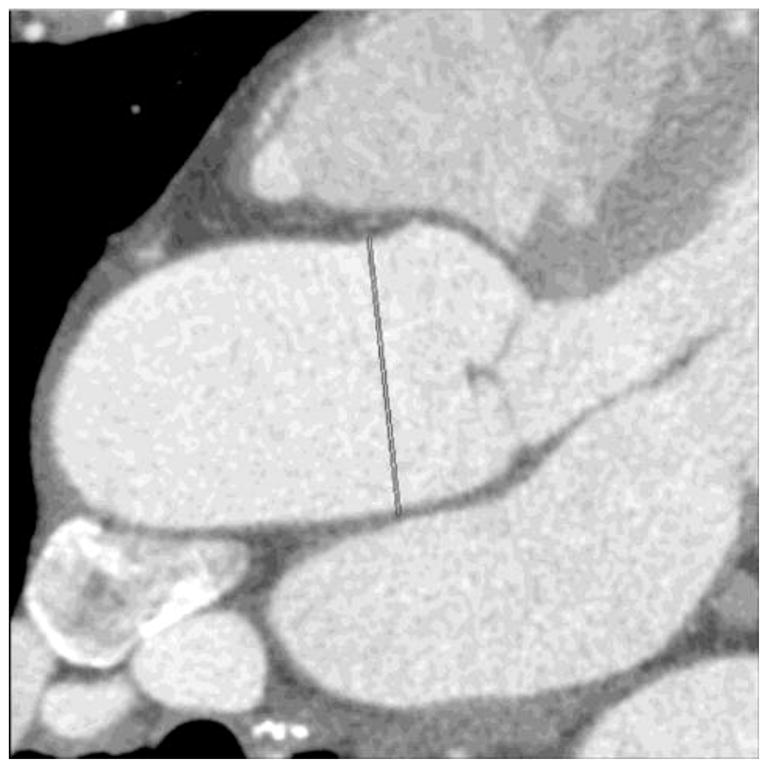
Two different measurements at the sinotubular junction in the same patient created using semiautomatic centerline analysis. Figures 2a and 2d show the aortic centerline and the locations of the oblique short axis views depicted in Figures 2b and 2e, respectively. The corresponding orthogonal views are shown in 2c and 2f; lines on these images show the planes for 2b and 2d, respectively. Note that slightly different obliquities result in different maximum diameters.
There were no obvious trends in the Bland-Altman plots (not shown) for the double-oblique views when evaluating intraobserver variation. Furthermore, the direction of the differences for the radiologists did not appear to be systematically different from each other. The Bland-Altman plots (not shown) of the research semiautomatic centerline analysis showed signs of intraobserver variation, and the measurements were consistently smaller the second time.
The interobserver variation analysis results are shown in Table 3. When comparing between radiologists, double-oblique views showed significant differences for all cusp to commissure sinus measurements, as well as at the sinotubular junction and mid ascending aorta. The average measurements of each radiologist did not vary consistently in the same direction compared to the other radiologist. The range of the mean difference across locations was −0.9 – 1.3 mm, and the smallest difference to the largest difference was −6.0 – 5.5 mm. The 95% confidence interval for difference in diameters was ±2.6 – ±4.8 mm, according to location. Semiautomatic centerline analysis measurements showed significant interobserver variability only in the mid ascending aorta; however, clinical reports did not include annulus or cusp to commissure measurements, and therefore interobserver variability could not be ascertained for these measurements. The range of the mean difference across the locations was −0.7 – 0.1 mm, and the smallest difference to the largest difference was − 3.0 – 5.0 mm. The 95% confidence interval for diameter differences was ±2.3 – ±3.6 mm, according to location.
Table 3.
Variability in maximum aortic diameter measurements by observer and technique (N= 25 patients)a
| Aortic location |
Double-oblique Views Radiologist #1 vs. Radiologist #2 |
Semiautomatic Centerline Analysis Research measurements vs. Clinical measurements |
Double-oblique Views vs. Semiautomatic Centerline Analysis |
|---|---|---|---|
| Annulus | 0.4 ± 1.5 (−3.0, 4.0) | N/A | −0.7±1.6 (−4.0, 1.8) |
| Sinuses | |||
| Non-coronary sinus cusp to commissure | 0.6±1.3 b (−3.0, 3.5) | N/A | −1.3±1.3 b (−4.5, 0.8) |
| Right coronary sinus cusp to commissure | 0.9±1.8 b (−5.0, 3.5) | N/A | −1.5±1.0 b (−3.5, 0.3) |
| Left coronary sinus cusp to commissure | 1.3±2.0 b (−4.5, 5.5) | N/A | −1.8±1.4 b (−4.3, 2.0) |
| Largest diameter cusp to cusp | −0.4±2.4 (−6.0, 4.0) | 0.1±1.4 (−2.5, 4.5) | −0.9±0.9 b (−2.3, 0.8) |
| Sinotubular junction | −0.7±1.3 b (−3.0, 2.0) | −0.4±1.8 (−3.0, 5.0) | −2.0±1.2 b (−4.8, 0.5) |
| Mid ascending | −0.9±1.4 b (−5.5, 1.0) | −0.7±1.2 b (−3.0, 2.0) | −0.5±1.4 b (−3.8, 3.8) |
Mean difference in mm ± SD (min, max)
p < 0.05
N/A: measurements not included in clinical report
Comparison between double-oblique views and semiautomatic centerline analysis showed statistically significant differences at all locations except the annulus (Table 3). The measurements obtained using the two methods were strongly correlated (r = 0.81 – 0.99), although they were consistently larger using semiautomatic centerline analysis compared to double-oblique views (Table 3, Figures 3 and 4). The mean difference across the locations was −2.0 – −0.5 mm, and the smallest to the largest difference was −4.8 – 3.8 mm. The 95% confidence interval for the difference in diameters was ±1.8 – ±3.2 mm, according to location. There was no relationship between the standard deviation of the differences and the aortic diameter.
Figure 3.


(a–d): Linear regression plots showing the correlation between double-oblique short axis and semiautomatic centerline analysis techniques in the assessment of maximum aortic diameters at the annulus, sinuses, sinotubular junction and mid ascending aorta. Spearman’s correlation coefficients were 0.81, 0.99, 0.97, and 0.98, respectively (p<0.01 for each).
Figure 4.


(a–d): Bland-Altman plots showing the correlation between double-oblique short axis and semiautomatic centerline analysis techniques in the assessment of maximum aortic diameters at the annulus, sinuses, sinotubular junction and mid ascending aorta.
Discussion
Normal adult thoracic aortic diameters have been reported according to gender and specific location, and it is known that the normal diameter increases with progressing age [13]. An increase in the aortic diameter of greater than 5 mm per year is considered rapid growth, prompting consideration for intervention [13]. However, the significance of small diameter measurement changes on serial CT exams is largely unknown due to the uncertainty of measurement variability. Our study found low overall intraobserver and interobserver variability for measurements obtained using double-oblique views, with mean measurement differences of no more than 1.3 mm. However, within the 95% confidence interval, there was up to 5.2 mm in variability, and there were occasional outliers of up to 11 mm measurement differences. The major cause of this variability was likely due to the manual generation of slightly different obliquities that led to different cross sectional diameters. This problem tends to be minimized for aortas that ascend along the z axis in the body, and is exacerbated for tortuous or curvaceous aortas or for sections of the aorta (such as the root) that tend to ascend oblique to the z axis. Similarly, intraobserver and interobserver variability for measurements obtained using semiautomatic centerline analysis was low overall, showing mean measurement differences of no more than 2.3 mm. However, within the 95% confidence interval, there was up to 4.6 mm in variability, and there were occasional outliers of up to 9 mm measurement differences. The software used for this study (and for routine clinical work) is sometimes unable to automatically define the centerline at the aortic root, and manual centerline definition or adjustment may be necessary. In addition, the presence of atheromatous disease in the aortic wall, intraluminal thrombus, or the presence of an aortic dissection may result in erroneous centerline identification, requiring manual editing. Such manual adjustments may lead to variations in diameter measurements. Furthermore, measurement variability using either technique (double-oblique or semiautomatic centerline analysis) may arise from differences in defining the outer contours of the aortic wall; occasionally these contours are difficult to ascertain and definition is somewhat arbitrary, particularly if contours are obscured by motion artifact or streak artifact from contrast in the superior vena cava. In addition, diameter variations may arise from the choice of a slightly different location along the length of the aorta.
It is difficult to compare our results with those in the medical literature due to differences in measurement techniques. The study of Lu and colleagues found an intraobserver variability of only 0.8 mm [−0.8, +0.8] using fully automatic centerline analysis (without editing) to obtain the largest mid ascending aortic intraluminal diameter (excluding the aortic wall) [8]. Using double-oblique short axis images, Lin et al. also found low intraobserver variability for intraluminal measurements of the ascending aorta, with correlation coefficients of 0.97 for AP and 0.96 for lateral measurements; the authors did not measure short and long axis diameters [9]. Interobserver correlation coefficients in this study were 0.94 and 0.92, respectively. Neither of these studies involved manual adjustments to include the aortic wall; however, in clinical practice it is necessary to make such adjustments in order to include any intraluminal thrombus, aortic wall atheroma, non-opacified false lumen (in the setting of aortic dissection) and/or thickened aortic wall, to reflect the correct aortic diameter.
Mao and colleagues found intra- and interobserver variabilities of 3% and 3.2%, respectively, for measuring ascending aortic diameters with cardiac gated CT [10]; however, they used only standard axial images, without double-oblique views or centerline analysis. Standard axial plane images are not optimal for assessing aortic diameters due to the potential for obliquity or tortuosity of the aorta, which may lead to erroneous measurements. Altiok and colleagues found low intraobserver and interobserver variability for measurements of the aortic annulus using dual source CT, with correlation coefficients of 0.91 and 0.81, respectively, and standard error of estimates of 0.79 and 1.13 mm, respectively, for measurements obtained from oblique sagittal images; for measurements obtained from standard coronal images, the correlation coefficients were 0.95 and 0.91, respectively, and standard error of estimates were 0.62 and 0.79 mm, respectively [6]. These authors did not obtain measurements from double-oblique axial images, and it is unclear if repeated measurements entailed the creation of new reconstructions vs. measurements from the original reconstructions.
In our study, the reliability of semiautomatic centerline analysis was similar to that of double-oblique axial image measurements. In comparison, Rengier and colleagues reported slightly higher interobserver variability for double-oblique CT views vs. centerline analysis (8.2% ± 7.2 vs 6.6% ± 8.2), for outer wall - outer wall measurements of aneurysms in the aortic arch or descending aorta by non-expert readers (proximal aortic measurements were not obtained) [14].
Study limitations
One limitation of our study was the inclusion of only patients with relatively motion free CT exams; aortic measurements would presumably show greater variation on exams with more motion artifact, due to the difficulty of defining the outer edge of the aortic wall. In addition, our study included few patients with marked aortic dilatation; however, although measurement variation could be different in larger caliber aortas, we did not find any correlation between measurement variability and aortic diameter in the patients we scanned. In addition, the patients in this study did not have extremely thickened or irregular aortic walls; such features could potentially lead to greater measurement variability due to the need for extra editing of semiautomatic centerline analysis contours.
In conclusion, although there was low mean measurement variability of the proximal aorta using double-oblique short axis or semiautomatic centerline analysis techniques, variability of up to approximately 5 mm in diameter occurred within the 95% confidence interval. Neither technique was clearly more reliable than the other. Given this variability, apparent small changes in proximal aortic diameters on serial CT exams (≤ 3 mm) should be viewed with skepticism, realizing that they may be within the range of measurement error. When measurements are made using 3D analysis, the operator should directly compare with images from any previous 3D analyses, to ensure comparable obliquities and measurement locations.
Acknowledgments
Supported by NIH UL1RR024986
We thank Karen Overbay for her assistance in the 3D Imaging Lab.
References
- 1.Rengier F, Weber TF, Giesel FL, Bockler D, Kauczor HU, von Tengg-Kobligk H. Centerline Analysis of Aortic CT Angiographic Examinations: Benefits and Limitations. American Journal of Roentgenology. 2009;192:5–W263. doi: 10.2214/ajr.08.1488. [DOI] [PubMed] [Google Scholar]
- 2.Mendoza DD, Kochar M, Devereux RB, Basson CT, Min JK, Holmes K, Dietz HC, Milewicz DM, LeMaire SA, Pyeritz RE, Bavaria JE, Maslen CL, Song H, Kroner BL, Eagle KA, Weinsaft JW. Impact of Image Analysis Methodology on Diagnostic and Surgical Classification of Patients With Thoracic Aortic Aneurysms. The Annals of Thoracic Surgery. 2011;92(3):904–912. doi: 10.1016/j.athoracsur.2011.03.130. [DOI] [PubMed] [Google Scholar]
- 3.Ng ACT, Delgado V, van der Kley F, Shanks M, van de Veire NRL, Bertini M, Nucifora G, van Bommel RJ, Tops LF, de Weger A, Tavilla G, de Roos A, Kroft LJ, Leung DY, Schuijf J, Schalij MJ, Bax JJ. Comparison of Aortic Root Dimensions and Geometries Before and After Transcatheter Aortic Valve Implantation by 2- and 3-Dimensional Transesophageal Echocardiography and Multislice Computed Tomography. Circulation: Cardiovascular Imaging. 2009;3(1):94–102. doi: 10.1161/circimaging.109.885152. [DOI] [PubMed] [Google Scholar]
- 4.Rubio DM, Conde JSdLC, Alvarez-Osorio MP, Ortiz MR, Ortega MD, del Pino MdCL, Delgado FT, Saint-Gerons JS, Pineda SO, Fuertes DG, Crespín MC, Espejo S, Ysamat R. Measurement of Aortic Valve Annulus Using Different Cardiac Imaging Techniques in Transcatheter Aortic Valve Implantation: Agreement with Finally Implanted Prosthesis Size. Echocardiography. 2011;28(4):388–396. doi: 10.1111/j.1540-8175.2010.01353.x. [DOI] [PubMed] [Google Scholar]
- 5.Messika-Zeitoun D, Serfaty J-M, Brochet E, Ducrocq G, Lepage L, Detaint D, Hyafil F, Himbert D, Pasi N, Laissy J-P, Iung B, Vahanian A. Multimodal Assessment of the Aortic Annulus Diameter. J Am Coll Cardiol. 2010;55(3):186–194. doi: 10.1016/j.jacc.2009.06.063. [DOI] [PubMed] [Google Scholar]
- 6.Altiok E, Koos R, Schroder J, Brehmer K, Hamada S, Becker M, Mahnken AH, Almalla M, Dohmen G, Autschbach R, Marx N, Hoffmann R. Comparison of two-dimensional and three-dimensional imaging techniques for measurement of aortic annulus diameters before transcatheter aortic valve implantation. Heart. 2011;97(19):1578–1584. doi: 10.1136/hrt.2011.223974. [DOI] [PubMed] [Google Scholar]
- 7.Pontone G, Andreini D, Bartorelli AL, Annoni A, Mushtaq S, Bertella E, Formenti A, Cortinovis S, Alamanni F, Fusari M, Bona V, Tamborini G, Muratori M, Ballerini G, Fiorentini C, Biglioli P, Pepi M. Feasibility and accuracy of a comprehensive multidetector computed tomography acquisition for patients referred for balloon-expandable transcatheter aortic valve implantation. American Heart Journal. 2011;161(6):1106–1113. doi: 10.1016/j.ahj.2011.03.003. [DOI] [PubMed] [Google Scholar]
- 8.Lu TLC, Rizzo E, Marques-Vidal PM, Segesser LKv, Dehmeshki J, Qanadli SD. Variability of ascending aorta diameter measurements as assessed with electrocardiography-gated multidetector computerized tomography and computer assisted diagnosis software. Interactive CardioVascular and Thoracic Surgery. 2009;10(2):217–221. doi: 10.1510/icvts.2009.216275. [DOI] [PubMed] [Google Scholar]
- 9.Lin FY, Devereux RB, Roman MJ, Meng J, Jow VM, Jacobs A, Weinsaft JW, Shaw LJ, Berman DS, Gilmore A, Callister TQ, Min JK. Assessment of the thoracic aorta by multidetector computed tomography: age- and sex-specific reference values in adults without evident cardiovascular disease. J Cardiovasc Comput Tomogr. 2008;2(5):298–308. doi: 10.1016/j.jcct.2008.08.002. S1934-5925(08)00553-4 [pii] [DOI] [PubMed] [Google Scholar]
- 10.Mao SS, Ahmadi N, Shah B, Beckmann D, Chen A, Ngo L, Flores FR, Gao Yl, Budoff MJ. Normal Thoracic Aorta Diameter on Cardiac Computed Tomography in Healthy Asymptomatic Adults. Academic Radiology. 2008;15(7):827–834. doi: 10.1016/j.acra.2008.02.001. [DOI] [PMC free article] [PubMed] [Google Scholar]
- 11.Larsson E, Vishnevskaya L, Kalin B, Granath F, Swedenborg J, Hultgren R. High Frequency of Thoracic Aneurysms in Patients with Abdominal Aortic Aneurysms. Annals of Surgery. 2011;253(1):180–184. doi: 10.1097/SLA.0b013e3181d96498. [DOI] [PubMed] [Google Scholar]
- 12.Bland JM, Altman DG. Statistical methods for assessing agreement between two methods of clinical measurement. Lancet. 1986;1 (8476):307–310. [PubMed] [Google Scholar]
- 13.Hiratzka LF, Bakris GL, Beckman JA, Bersin RM, Carr VF, Casey DE, Eagle KA, Hermann LK, Isselbacher EM, Kazerooni EA, Kouchoukos NT, Lytle BW, Milewicz DM, Reich DL, Sen S, Shinn JA, Svensson LG, Williams DM. 2010 ACCF/AHA/AATS/ACR/ASA/SCA/SCAI/SIR/STS/SVM Guidelines for the Diagnosis and Management of Patients With Thoracic Aortic Disease: A Report of the American College of Cardiology Foundation/American Heart Association Task Force on Practice Guidelines, American Association for Thoracic Surgery, American College of Radiology, American Stroke Association, Society of Cardiovascular Anesthesiologists, Society for Cardiovascular Angiography and Interventions, Society of Interventional Radiology, Society of Thoracic Surgeons, and Society for Vascular Medicine. Circulation. 2010;121(13):e266–e369. doi: 10.1161/CIR.0b013e3181d4739e. [DOI] [PubMed] [Google Scholar]
- 14.Rengier F, Weber TF, Partovi S, Müller-Eschner M, Böckler D, Kauczor HU, von Tengg-Kobligk H. Reliability of Semiautomatic Centerline Analysis versus Manual Aortic Measurement Techniques for TEVAR among Non-experts. European Journal of Vascular and Endovascular Surgery. 2011;42(3):324–331. doi: 10.1016/j.ejvs.2011.04.019. [DOI] [PubMed] [Google Scholar]