

Abstract

We describe a computational method, plane of best fit (PBF), to quantify and characterize the 3D character of molecules. This method is rapid and amenable to analysis of large diverse data sets. We compare PBF with alternative literature methods used to assess 3D character and apply the method to diverse data sets of fragment-like, drug-like, and natural product compound libraries. We show that exemplar fragment libraries underexploit the potential of 3D character in fragment-like chemical space and that drug-like molecules in the libraries examined are predominantly 2D in character.
Introduction
Analyzing and visualizing the diversity of chemical space is increasingly important, particularly for the characterization and design of compound libraries used for hit discovery.1 Approaches include analyses of physicochemical properties, scaffold diversity, and compound shape; for example, physicochemical property descriptors (typically molecular weight, calculated logP, and polar surface area) are often used to map chemical space with upper and lower limits set on such parameters in compound library design2,3 while scaffold composition has been introduced as a tool for analyzing the diversity of compound libraries.4 Compound shape has long been recognized as an important factor in molecular recognition between a ligand and its biological targets, and the optimal spatial orientation of pharmacophoric features is essential for ligand efficient binding of small molecules.5−7 Natural products frequently incorporate scaffolds with significant three-dimensional (3D) character8 and recent important breakthroughs in the discovery of protein–protein interaction inhibitors often involve scaffolds incorporating 3D character;9 for example, inhibitors of the bromodomain BRD4/chromatin interaction,10 the LEDGF/p75 integrase interaction,11 the Bcl2 family proteins,12 and of the MDM2/p53 interaction (Figure 1).13 For each ligand shown in Figure 1, a conformation with pronounced 3D shape has been captured in the respective protein binding site by X-ray crystallography.10−13 In addition, molecules which incorporate significant 3D shape often display desirable aqueous solubility due to increased solvation and poorer solid state crystal lattice packing.14,15 Thus, there is an increasing drive to design and synthesize molecules and scaffolds with enhanced 3D shape.
Figure 1.

Structures of protein–protein interaction inhibitors with pronounced 3D shape in the respective protein–ligand X-ray crystal structures: (a) (+)-JQ1, an inhibitor of bromodomain BRD4/chromatin interactions,10 (b) inhibitor of LEDGF/p75 integrase interaction,11 (c) Nutlin-3, an inhibitor of Bcl2/BH3 domain interactions,12 and (d) ABT737, an inhibitor of MDM2/p53 interactions.13
A number of methods have been reported which characterize molecular shape. Sauer and Schwarz reported principal moments of inertia (PMI) to classify the shape of compounds with rods, discs, and spheres as the apexes of a triangular visualization plot16 while Lovering et al. introduced the fraction of sp3 carbon atoms (Fsp3) to describe the degree of lead-likeness.17 Molecular globularity has also been used as a descriptor of molecular shape.18 A number of alternative descriptors of 3D shape have been published, including volume, surface, spherosity, and ovality; these descriptors are summarized by Todeschini and Consonni.19 The identification of an objective and invariant method that unambiguously characterizes the three-dimensionality of chemical structures is important in the analysis of chemical space, and we sought a rapid and quantitative method with which to characterize the shape diversity of large compound libraries.
While every molecule has three dimensions in the classical definition, namely length, width, and depth, we considered it useful to differentiate between flat and non-flat molecules by application of the following definitions: A molecule has zero dimensions (0D) if it consists of only one heavy atom. A molecule is one-dimensional (1D) if the centers of mass of all the heavy atoms lie in a straight line. A molecule is two-dimensional (2D) if the centers of mass of all the heavy atoms lie in a plane. A molecule is three-dimensional (3D) if it is not 2D.
These simple definitions result in a binary value for 3D, nonflat versus flat, and we therefore wish to extend the definition to give a quantitative measure of how removed any molecule is from 2D. We introduce the plane of best fit (PBF) across all the heavy atoms of a molecule in a given conformation. The average distance of all heavy atoms from the PBF describes how far removed the molecule is from 2D shape and therefore provides a quantitative description of 3D shape.
Here we study molecules in their CORINA-derived conformation, a literature standard method.20,21 The “conformer problem” is a significant challenge in molecular modeling: namely, the identification of biologically relevant conformations that a molecular structure may adopt. A number of methods exist to explore conformational space using both energy-minimized conformations in vacuo100 and those that are presumed relevant in the biological context;101 these methods may not necessarily concur. Here, we do not consider such conformational exploration but take a single conformer from standard software (CORINA) as a reference conformer.20 The method we propose in this article is amenable to the analysis of many conformers of a single molecule, but this approach is not applied here consistent with other 3D descriptor methods reported in the literature.16,18
Methods
Plane of Best Fit
Each molecule was prepared by removing salts, and then, the coordinates were generated using CORINA; hydrogens were omitted from this output.20 The coordinates were then used to calculate the plane of best fit. The plane of best fit is solved using a least-squares method.22−24 An error function E(A, B, C) is calculated to give the total error in the z coordinate from the plane with equation Ax + By + C = z. This error function is given by
| 1 |
where (xi,yi,zi) are the coordinates of the ith atom. This error is minimal at the point Grad(E(A,B,C)) = (0,0,0). Applying this operator leads to the system of linear equations,
| 2 |
This can be simplified to,
 |
3 |
This set of linear equations is solved using a QL algorithm, which is the factorization of a matrix in the product of an orthogonal matrix Q and a lower triangular matrix L. This solution gives the values for A, B, and C. There is then a normalization step to give the equation of the plane in the form Ax + By + Cz = D as required.
The equation of best fit is then used to give the distance, Δ, of each heavy atom from the plane, where
| 4 |
and Ax + By + Cz + D = 0 is the equation of the plane. The output of the method is given as the average of these distances in angstroms. This output, the plane of best fit (PBF) score, has a mathematically theoretical range of [0,∞). However, in practice, the PBF score tends to be below two for small drug-like molecules and below ten for proteins. The PBF program was coded in C++ and runs on a 2.4 GHz Intel Core 2 Duo processor; using this system specification, the program is capable of processing on average ∼2600 drug-like molecules per second; the rate-limiting factor is conformer generation, in common with other methods of this type. As an illustrative example, a schematic of the PBF for cyclohexane in its CORINA-derived chair conformation is depicted in Figure 2.
Figure 2.
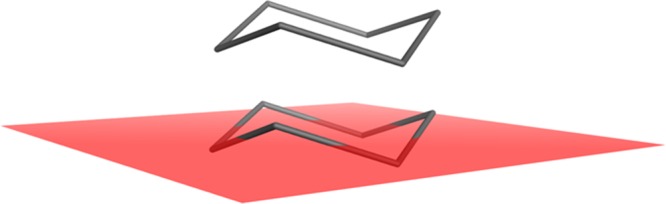
Example depiction of plane of best fit (PBF) for cyclohexane in a chair conformation.
Other Resources
A set of established methods was required for comparison and validation purposes. The descriptors used were normalized principal moments of inertia ratio (NPR),16 molecular globularity (MolGlob),18 and fraction of sp3 hybridized carbons (Fsp3).17 Pipeline Pilot version 8.0 was used to preprocess the molecules, and a PilotScript script was written to calculate the fraction of sp3 hybridized carbons.25 Other descriptors were generated using the Molecular Operating Environment (MOE).26 Spotfire DecisionSite was used for graphical analysis.27 For the larger data sets, an implementation of the quick sort algorithm28 was written in Python to process data and to generate statistics. The density plots for the larger data sets were created in a Processing script.29
Data Sets
ICR Screening Library (ICRSL).
74 603 compounds were from the Institute of Cancer Research (ICR) in-house screening collection. This library includes compounds selected from commercial vendors and compounds synthesized in-house.
ICR Fragment Library (ICRFL).
The fragment library contains 2465 fragment-like molecules, either synthesized at the ICR or purchased from vendors. Fragment definition parameters: 150 ≤ molecular weight ≤ 320 Da, AlogP ≤ 3, rotatable bonds ≤ 4, heavy atoms ≥ 10, 1 ≤ number of rings ≤ 3, 3 ≤ ring size ≤ 7 atoms, fused rings ≤ 2, number of sulfur atoms ≤ 1, number of halogen atoms ≤ 1 (except fluorine).4
ChEMBLdb V.1130
The ChEMBL database contains 1 060 258 compounds from the EBI-ChEMBL. It consists of bioactive compounds taken from the medicinal chemistry literature and is manually curated by the EBI-ChEMBL team.
ChEMBLdb V.11 Natural Products (ChemNat).30
This is a subset of the ChEMBLdb V.11 containing 491 compounds marked as natural products.
DrugBank 3.031
The database contains 6707 drug entries including 1436 FDA-approved small molecule drugs, 134 FDA-approved (protein/peptide) drugs, 83 nutraceuticals, and 5086 experimental drugs.
BioFocus Kinase Focused Library (BFK).32
A library of 10 000 compounds, designed to inhibit protein kinases.
eMolecules (eMol).33
These are 5.2 million commercially available, unique compounds from the eMolecules database.
Maybridge Rule of 3 (Ro3)34 Complete Fragment Library (MayB).35
A library comprising 2791 Ro3 compliant fragments.
GDB-1336
One million randomly selected molecules from GDB-13 which enumerates small organic molecules up to 13 atoms of C, N, O, S, and Cl following simple chemical stability and synthetic feasibility rules.37
Results and Discussion
Application of PBF to Diverse Data Sets
Initially, we compared PBF analysis of diverse data sets with literature shape analysis methods. Figure 3 shows the comparison of PBF with NPR for the ICR fragment library (ICRFL, see Methods section). The NPR plot denoting rods, discs, and spheres is colored by binned PBF values; a strong correlation was observed between the two methods with low PBF scores matching compounds with 2D rod- or disc-like character in the NPR method and compounds with high PBF score correlating with sphere-like 3D compounds in the PMI plot. Using the sum of NPRs as one variable and PBF score as the other, a good correlation was observed (Pearson correlation coefficient = 0.825). Comparing the PBF score with the molecular globularity (MolGlob) score for the ICRFL data set showed a greater numerical range for the PBF score and therefore greater granularity of 3D-shape description (Figure 4). Again, correlation between the two methods for this data set was good (Pearson correlation coefficient = 0.786). However, the PBF score correlated poorly with Fsp3 for the ICRFL data set (Pearson correlation = 0.360) (Figure 5).
Figure 3.

PMI plot for the ICRFL data set. Four evenly distributed bins across the range of the average distance from the plane of best fit (PBF score) are represented by the color of the points (red ≤ 0.2709, 0.2709 < blue ≤ 0.5418, 0.5418 < yellow ≤ 0.8128, black > 0.8128).
Figure 4.

Scatter graph measuring the correlation between molecular globularity (MolGlob) and PBF score for the ICR fragment library data set.
Figure 5.

Scatter graph depicting the correlation between fraction of sp3 hybridized carbons (Fsp3) and PBF score for the ICR fragment library data set.
To assess the generality of these observations, comparison of PBF with literature methods was repeated across eight other diverse data sets representing the spectrum from large compound collections (eMolecules and ChEMBLdb V.11) to small focused kinase, natural product, and marketed drug libraries (see Supporting Information Figures S1–S18). Taken together, these analyses demonstrated that the PBF score correlates well with the NPR and MolGlob scores across all data sets examined but does not correlate with Fsp3 (Table 1).
Table 1. Comparison of Pearson Correlation Coefficients for Fsp3, NPR, and MolGlob Methods with PBF over Nine Diverse Compound Data Sets.
| data set | Fsp3 | NPR1 + NPR2 | MolGlob |
|---|---|---|---|
| ChemNat | 0.0854 | 0.755 | 0.719 |
| MayBridge | 0.451 | 0.780 | 0.711 |
| BioFocus Kinase | 0.0392 | 0.771 | 0.732 |
| DrugBank | 0.173 | 0.642 | 0.600 |
| eMolecules | 0.184 | 0.784 | 0.737 |
| ChEMBL | 0.259 | 0.683 | 0.643 |
| GDB-13 | 0.500 | 0.872 | 0.826 |
| ICRSL | 0.213 | 0.772 | 0.722 |
| ICRFL | 0.360 | 0.826 | 0.786 |
One explanation for the lack of correlation between PBF and Fsp3 is that while a high Fsp3 value indicates a high ratio of sp3carbons to all carbons, a high Fsp3 score does not characterize whether these sp3 carbon atoms are connected to extended vectors out of the plane of the dominant ring system; i.e. significant 3D shape. In addition, molecules with Fsp3 = 0 have no sp3 carbon atoms but may not be planar; for example, (1) and (2) have structures where all carbon atoms are aromatic (Fsp3 = 0); however, the CORINA-derived conformations indicate that (1) is planar whereas (2) is puckered out of plane due to the presence of a pyramidal, pseudo-sp3 hybridized nitrogen atom in the conformation adopted in the small molecule X-ray crystal structure (CSD CBMZPN01)38 (Figure 6). This difference is not considered in the Fsp3 score but is reflected in the PBF, NPR, and MolGlob scores (Table 2).
Figure 6.

Chemical structures and CORINA-derived conformation comparison for molecules (1) and (2) for which Fsp3 = 0.
Table 2. Descriptor Values and Percentage Difference in Values between Molecules (1) and (2) Depicted in Figure 6a.
| method | (1) | (2) | percentage difference |
|---|---|---|---|
| NPR1 | 0.0899 | 0.446 | 133% |
| NPR2 | 0.910 | 0.817 | 10.8% |
| Fsp3 | 0 | 0 | 0% |
| MolGlob | 0.000000852 | 0.188 | 200% |
| PBF Score | 0.00313 | 0.768 | 198% |
Percentage difference is defined as the modulus of the difference divided by the average of two values.
Two compounds with near identical Fsp3 scores, namely, NADPH (3) (Fsp3 = 0.476) and the fused tricyclic compound (4) (Fsp3 = 0.474), show differing NPR1, MolGlob, and PBF scores which clearly differentiate their 3D character (Figure 7 and Table 3). Thus, while Fsp3, a 2D descriptor, usefully indicates the ratio of sp3 carbons to all carbons in a molecule, it does not always differentiate their 3D character.
Figure 7.

Chemical structures and CORINA-derived conformation comparison for molecules (3) (Fsp3 = 0.476) and (4) (Fsp3 = 0.474).
Table 3. Descriptor Values and Percentage Difference in Values between Molecules (3) and (4) Depicted in Figure 7.
| method | (3) | (4) | percentage difference |
|---|---|---|---|
| NPR1 | 0.233 | 0.0545 | 124% |
| NPR2 | 0.926 | 0.946 | 2.14% |
| Fsp3 | 0.476 | 0.474 | 0.528% |
| MolGlob | 0.0882 | 0.00000138 | 200% |
| PBF Score | 1.53 | 0.00475 | 199% |
To further illustrate the utility and quantitative value of the PBF method, a small number of molecules from the same data set (ICRFL) with PBF scores covering the dynamic range of PBF score were selected and compared (Figure 8). As expected, for p-bromobenzamidine (5), a planar monocyclic aromatic fragment, PBF = 0. Progression up the PBF scale is consistent with increased 3D shape in the CORINA-derived conformations of molecules (6–11). For example, the pyridyl-triazole linkage in compound (6) is essentially planar while the presence of a flanking methyl substituent in the aryl–aryl fused compound (8) drives increased rotation and deviation from planarity consistent with an increased PBF score. Compounds (9) and (10) have a high PBF score due to the presence of a quaternary carbon center with substituents extending along each of the four vectors. 2-Methoxy-5-methylsulfonyl-p-fluoroaniline (11) has the highest score (PBF = 1.06) consistent with the increased 3D character imparted by the sulfonamide linker in the CORINA-derived conformation.
Figure 8.

Example molecules selected from the ICRFL data set (5–11) and their respective PBF scores depicted on a linear scale.
Pairwise comparison of molecules with similar scores using literature methods revealed some interesting differences. For example, p-isobutylphenol (12) and the oligonucleotide (13) share similar NPR, MolGlob, and Fsp3 scores; however, they are clearly differentiated by PBF score (Figure 9; Table 4). A probable reason for the similarity in NPR scores is the normalization step applied in their calculation such that the scale of the object is not fully represented by NPR1 and NPR2. With drug-like small molecules this is not an issue; however, the shape characteristics for larger molecules are lost: for example, the extended scaffold in (13) overwhelms the smaller extended vectors from the scaffold chain such that (13) lies proximal to (12) on a PMI plot. The PBF score for (13) indicates that, even though (13) is a significantly larger molecule than (12) (315 versus 11 heavy atoms respectively), the average distance of all heavy atoms from the PBF is higher for (13) consistent with greater 3D character.
Figure 9.

Shape comparison of molecules (12) and (13) which score similarly according to literature methods.
Table 4. Difference in Values between Molecules (12) and (13) Depicted in Figure 9.
| method | (12) | (13) | percentage difference |
|---|---|---|---|
| NPR1 | 0.152 | 0.152 | 0.167% |
| NPR2 | 0.972 | 0.970 | 0.148% |
| Fsp3 | 0.4 | 0.546 | 13.6% |
| MolGlob | 0.0733 | 0.0701 | 4.48% |
| PBF Score | 0.398 | 4.21 | 166% |
We next applied the PBF method to the selection of compounds for a 3D-focused compound library from the eMolecules data set. Applying drug-like physicochemical property filters to the eMolecules data set (Lipinski Ro5 compliance39 and number of rings > 0) generated a data set of ∼4 million compounds for selection based upon their 3D-shape. Using the sum of NPRs as a metric and setting NPR1 + NPR2 ≥ 1.07 to select out flat, or nearly flat molecules removed 58.8% of the data set. However, when applying a PBF selection filter (PBF ≥ 0.6) to the same ∼4 million set, we “rescued” 13.4% of molecules that were selected out by the NPR method (molecules contained in the bottom right quadrant of Figure 10). Due to the nature of the population density distribution, this rescue effect occurs irrespective of the NPR cutoff applied; thus, the greater granularity of PBF score, in comparison with NPR assessment, facilitates the analysis and differentiation of compounds in highly populated regions of 3D space (for example the exemplified compounds in Figure 10). The top right and bottom left quadrants of Figure 10 contain molecules where the NPR and PBF methods concur. The top left quadrant contains molecules characterized as more 3D by the NPR than by the PBF method using the cutoffs defined here. This top left quadrant is sparsely populated (4% of the filtered molecules) and is generally made up of smaller molecules with a mean weight of 307.3 Da (Figure 10).
Figure 10.

Density plot of PBF score versus the sum of normalized principal moments of inertia (NPR) for the eMolecules data set with acyclic and Ro5 noncompliant compounds removed. The horizontal black line represents a cutoff for 3D molecules for NPR1 + NPR2, and the vertical line, a corresponding cutoff for PBF.
We also used our PBF method to interrogate the 3D character of all nine data sets, both with and without application of a Lipinski Ro5 filter39 to the nonfragment data sets in order to assess the observed upper limit of PBF score for both Ro5-compliant and noncompliant molecules (Figure 11). The Lipinski filter constrained the upper quartile of PBF score for the data sets to which it was applied, notably the ChEMBL and eMolecules data sets, indicating that many molecules in these data sets with high 3D character (PBF > 1) are nondrug-like as determined by the Lipinski Ro5 analysis. Similarly, the ChEMBL natural product library has a wide PBF score distribution which is significantly eroded with the Lipinski Ro5 filter applied. The BioFocus kinase-focused library has lower 3D character as measured by the PBF method; its distribution in PBF-space is unchanged by application of Lipinski filters, consistent with the trend for kinase-targeted inhibitors to be comparatively flat Ro5-compliant small molecules compatible with the ATP binding site of the kinase gene family. Comparison of the two fragment-like libraries is informative: ICRFL has a wider range of PBF scores in comparison with the Maybridge fragment library; however, for both sets, the distribution of PBF scores is skewed toward lower PBF values, indicating wider coverage of flat or nearly flat chemical space. By contrast, GDB-13 exhibits an almost normal distribution of PBF score. This latter data set contains 1 million randomly selected molecules taken from all theoretical combinatorial linkages for 12 or 13 heavy atoms and illustrates the virtual shape space possible within fragment-like compounds.
Figure 11.

Range of PBF scores depicted as box and whisker plots across all nine data sets. Yellow plots include all members of the data sets, red plots are after a Lipinski Ro5 filter has been applied.
To further examine the 3D character of fragment-like chemical space, we next analyzed medicinal chemistry relevant fragments by applying the Retrosynthetic Combinatorial Analysis Procedure40 (RECAP) algorithm to both the DrugBank and ChEMBL data sets. Filters were then applied to these results, first a Python script using RDKit was written to remove dummy atoms representing substituent vectors from the fragments; second, application of fragment-like filters [number of atoms > 10, molecular weight < 320 Da, number of rings > 0] for each data set gave a set of fragments derived from known drugs (DrugBank) and medicinal chemistry literature (ChEMBL); third, all acyclic compounds were removed from the GDB-13 data set. The distribution of PBF score across the fragment libraries (ICRFL and Maybridge), two RECAP-generated libraries (from DrugBank and ChEMBL), and GDB-13 subset is shown in Figure 12. The Maybridge, ICR fragment libraries, and DrugBank-RECAP sets all have a significant proportion of flat and near flat molecules where PBF < 0.035 (30%, 14%, and 21%, respectively), while for the GDB13 and ChEMBL-RECAP sets, the proportion of molecules with PBF < 0.035 is lower (<5%). In addition, the peak of PBF score for the GDB13 and ChEMBL-RECAP sets is shifted to the right (0.56 for both sets). Taken together, these analyses suggest that the ICRFL and Maybridge fragment libraries underexploit the potential of 3D character in fragment-like chemical space and that the enrichment of fragment libraries for 3D character would complement existing fragment screening collections.
Figure 12.

Histogram of PBF scores of ICR and Maybridge fragment libraries, the GDB-13 data set, DrugBank, and ChEMBL libraries subject to RECAP algorithm, and application of fragment-like filters.
Conclusion
We introduce a new method, plane of best fit (PBF), for quantitative analysis of molecular 3D character using CORINA-derived conformations. PBF quantifies the average distance in angstroms of all heavy atoms away from the plane of best fit through all heavy atoms. The PBF score has a mathematically theoretical range of zero to infinity; however in practice, we observe that the PBF score tends to be less than two for drug-like small molecules and tends to be less than ten for proteins. We propose the PBF method as a useful addition to the computational tools available to medicinal chemistry for the following reasons: (1) the method is high throughput and quantitative on a linear scale with values derived from molecular dimensions, i.e. the average distance of all heavy atoms from the plane of best fit; (2) the method is applicable irrespective of molecular size since the PBF score is normalized according to the number of heavy atoms; and (3) the PBF score separates molecules closely clustered in NPR space, thereby allowing greater granularity of 3D shape characterization in molecular design and compound selection. We propose that a main use of PBF is for quantitative characterization of 3D shape which is becoming a more important tool as synthetic and medicinal chemists become increasingly interested in out-of-plane molecules.41 We also envisage that PBF may be used in conjunction with NPR for detailed analysis of molecular shape across compound libraries, for example by principal component analysis.
Application of the PBF method to nine diverse compound data sets ranging from fragment-like libraries (ICRFL and Maybridge) to large diverse compound collections (eMolecules and ChEMBL) showed a good correlation with two literature methods used to characterize 3D shape (NPR and MolGlob). We observe a poor correlation with Fsp3; however, it is important to note that Fsp3 was first introduced as a measure of molecular complexity which, along with the number of chiral centers, was found to correlate with higher clinical success rates and higher aqueous solubility.17 Analysis of the range of PBF score for the nine diverse data sets studied shows the following: (1) molecules which populate the upper ranges of 3D character in ChEMBL and eMolecules data sets, as measured by PBF score, have a propensity to be non-Ro5 compliant (Figure 11); (2) a propensity for 2D character in the fragment-like compound libraries studied here when compared with the possible range of synthesized or virtual fragment space (as defined by the GDB13 data set and by application of RECAP fragmentation to the ChEMBL and DrugBank data sets) (Figure 12); and (3) the ICRFL and Maybridge fragment libraries underexploit the potential of 3D character in fragment-like chemical space and that the enrichment of fragment libraries for 3D character would complement existing fragment screening collections.
Acknowledgments
N.F. is funded by the Institute of Cancer Research, N.B. and J.B. are funded by Cancer Research UK Grant No. C309/A8274. We thank Sarah Langdon, Lewis Vidler, Dennis Waalboer, Jonathan Macdonald, and the Med. Chem. 1 team for valuable discussion.
Supporting Information Available
Supplementary Figures S1–S18. This material is available free of charge via the Internet at http://pubs.acs.org.
The authors declare no competing financial interest.
Supplementary Material
References
- Reutlinger M.; Schneider G. Nonlinear dimensionality reduction and mapping of compound libraries for drug discovery. J. Mol. Graphics Modell. 2012, 34, 108–117and references therein. [DOI] [PubMed] [Google Scholar]
- Clemons P. A.; Wilson J. A.; Dančík V.; Muller S.; Carrinski H. A.; Wagner B. K.; Koehler A. N.; Schreiber S. L. Quantifying structure and performance diversity for sets of small molecules comprising small-molecule screening collections. Proc.Natl. Acad. Sci. USA 2011, 108(17), 6817–6822. [DOI] [PMC free article] [PubMed] [Google Scholar]
- Djuric S. W.; Akritopoulou-Zanze I.; Cox P. B.; Galasinski S. Compound collection enhancement and paradigms for high-throughput screening-an update. Annu. Rep. Med. Chem. 2010, 45, 409–428. [Google Scholar]
- Langdon S. R.; Brown N.; Blagg J. Scaffold Diversity of Exemplified Medicinal Chemistry Space. J. Chem. Inf. Model. 2011, 51, 2174–2185. [DOI] [PMC free article] [PubMed] [Google Scholar]
- Grant J. A.; Gallardo M. A.; Pickup B. T. A fast method of molecular shape comparison: A simple application of a Gaussian description of molecular shape. J. Comput. Chem. 1996, 17, 1653. [Google Scholar]
- DesJarlais R. L.; Sheridan R. P.; Seibel G. L.; Dixon J. S.; Kuntz I. D.; Venkataraghavan R. Using shape complementarity as an initial screen in designing ligands for a receptor binding site of known three-dimensional structure. J. Med. Chem. 1988, 31, 722–729. [DOI] [PubMed] [Google Scholar]
- Ebalunode J. O.; Zheng W. Molecular shape technologies in drug discovery: methods and applications. Curr. Top. Med. Chem. 2010, 10, 669–679. [DOI] [PubMed] [Google Scholar]
- Clemons P. A.; Bodycombe N. E.; Carrinski H. A.; Wilson J. A.; Shamji A. F.; Wagner B. K.; Koehler A. N.; Schreiber S. L. Small molecules of different origins have distinct distributions of structural complexity that correlate with protein-binding profiles. Proc. Natl. Acad. Sci. U.S.A. 2010, 107(44), 18787–18792. [DOI] [PMC free article] [PubMed] [Google Scholar]
- Sperandio O.; Reynes C. H.; Camproux A.-C.; Villoutreix B. O. Rationalizing the chemical space of protein-protein interaction inhibitors. Drug Discovery Today 2010, 15, 220–228. [DOI] [PubMed] [Google Scholar]
- Filippakopoulos P.; Qi J.; Picaud S.; Shen Y.; Smith W. B.; Fedorov O.; Morse E. M.; Keates T.; Hickman T. T.; Felletar I.; Philpott M.; Munro S.; McKeown M. R.; Wang Y.; Christie A. L.; West N.; Cameron M. J.; Schwartz B.; Heightman T. D.; La Thangue N.; French C.; Wiest O.; Kung A. L.; Knapp S.; Bradner J. E. Selective inhibition of BET bromodomains. Nature 2010, 468, 1067–1073. [DOI] [PMC free article] [PubMed] [Google Scholar]
- Christ F.; Voet A.; Marchand A.; Nicolet S.; Desimmie B. A.; Marchand D.; Bardiot D.; van der Veken N. J.; van Remoortel B.; Strelkov S. V.; de Maeyer M.; Chaltin P.; Debyser Z. Rational design of small-molecule inhibitors of the LEDGF/p75-integrase interaction and HIV replication. Nat. Chem. Biol. 2010, 6, 442–448. [DOI] [PubMed] [Google Scholar]
- Oltersdorf T.; Elmore S. W.; Shoemaker A. R.; Armstrong R. C.; Augeri D. J.; Belli B. A.; Bruncko M.; Deckwerth T. L.; Dinges J.; Hajduk P. J.; Joseph M. K.; Kitada S.; Korsmeyer S. J.; Kunzer A. R.; Letai A.; Li C.; Mitten M. J.; Nettesheim D. G.; Ng S.; Nimmer P. M.; O’Connor J. M.; Oleksijew A.; Petros A. M.; Reed J. C.; Shen W.; Tahir S. K.; Thompson C. B.; Tomaselli K. J.; Wang B.; Wendt M. D.; Zhang H.; Fesik S. W.; Rosenberg S. H. An inhibitor of Bcl-2 family proteins induces regression of solid tumours. Nature 2005, 435, 677–681. [DOI] [PubMed] [Google Scholar]
- Vassilev L. T.; Vu B. T.; Graves B.; Carvajal D.; Podlaski F.; Filipovic Z.; Kong N.; Kammlott U.; Lukacs C.; Klein C.; Fotouhi N.; Liu E. A. In Vivo Activation of the p53 Pathway by Small-Molecule Antagonists of MDM2. Science 2004, 303, 844–848. [DOI] [PubMed] [Google Scholar]
- Yang Y.; Engkvist O.; Llinàs A.; Chen H. Beyond Size, Ionization State, and Lipophilicity: Influence of Molecular Topology on Absorption, Distribution, Metabolism, Excretion, and Toxicity for Druglike Compounds. J. Med. Chem. 2012, 55, 3667–3677. [DOI] [PubMed] [Google Scholar]
- Ishikawa M.; Hashimoto Y. Improvement in Aqueous Solubility in Small Molecule Drug Discovery Programs by Disruption of Molecular Planarity and Symmetry. J. Med. Chem. 2011, 55, 3667–3677. [DOI] [PubMed] [Google Scholar]
- Sauer W. H. B.; Schwarz M. K. Molecular shape diversity of combinatorial libraries: a prerequisite for broad bioactivity. J. Chem. Inf. Comput. Sci. 2003, 43, 987–1003. [DOI] [PubMed] [Google Scholar]
- Lovering F.; Bikker J.; Humblet C. Escape from Flatland: Increasing Saturation as an Approach to Improving Clinical Success. J. Med. Chem. 2009, 52, 6752–6756. [DOI] [PubMed] [Google Scholar]
- Meyer A. Y. Molecular mechanics and molecular shape. III. Surface area and cross-sectional areas of organic molecules. J. Comput. Chem. 1986, 7, 144–152. [DOI] [PubMed] [Google Scholar]
- Todeschini R.; Consonni V.. Molecular Descriptors for Chemoinformatics; Wiley-VCH: Germany, 2009. [Google Scholar]
- Sadowski J. K. G.; Gasteiger J. Comparison of Automatic Three-Dimensional Model Builders Using 639 X-ray Structures. J. Chem. Inf. Comput. Sci. 1994, 34, 1000–1008. [Google Scholar]
- CORINA, version 3.4, Molecular Networks GmbH: Erlangen, Germany, 2006. [Google Scholar]
- Schwab C. H. Conformations and 3D pharmacophore searching. Drug Discovery Today: Technol. 2010, 7, 245–253. [DOI] [PubMed] [Google Scholar]
- Perola E.; Charifson P. S. Conformational Analysis of Drug-Like Molecules Bound to Proteins: An Extensive Study of Ligand Reorganization upon Binding. J. Med. Chem. 2004, 47, 2499–2510. [DOI] [PubMed] [Google Scholar]
- Schomaker V.; Waser J.; Marsh R. E.; Bergman G. To fit a plane to a set of points by least squares. Acta Crystallogr. 1959, 12, 600–604. [Google Scholar]
- Least Squares Fitting of Data. http://www.geometrictools.com/Documentation/LeastSquaresFitting.pdf (accessed March 15, 2012).
- Best Fit Plane. http://codesuppository.blogspot.com/2006/03/best-fit-plane.html (accessed March 15, 2012).
- PipelinePilot, version 8.0; Accelrys: SanDiego, CA, USA, 2010. [Google Scholar]
- MOE, version 2010.10; Chemical Computing Group: Montreal, Quebec, Canada, 2010. [Google Scholar]
- Spotfire, version 9.1.1; TIBCO Software, Somerville, MA, 2010.
- Hoare C. A. R. Quicksort. Comput. J. 1962, 5, 10–15. [Google Scholar]
- Processing. http://processing.org/ (accessed March 15, 2012)
- ChEMBL. https://www.ebi.ac.uk/chembl/ (accessed March 15, 2012)
- DrugBank. http://www.drugbank.ca/downloads (accessed March 15, 2012)
- BioFocus. http://www.biofocus.com/offerings/compound-libraries/kinase.htm (accessed March 15, 2012)
- eMolecules. http://www.emolecules.com/ (accessed March 15, 2012)
- Congreve M.; Carr R.; Murray C.; Jhoti H. A ‘Rule of Three’ for fragment-based lead discovery?. Drug Discov. Today 2004, 8, 876–877. [DOI] [PubMed] [Google Scholar]
- Maybridge. http://www.maybridge.com (accessed March 15, 2012)
- Blum L. C.; Reymond J.-L. 970 Million Drug-like Small Molecules for Virtual Screening in the Chemical Universe Database GDB-13. J. Am. Chem. Soc. 2009, 131, 8732–8733. [DOI] [PubMed] [Google Scholar]
- Reymond Group Cheminformatics Website. http://reymond.dcb.unibe.ch/gdb/home.html (accessed March 15, 2012)
- Allen F. H. The Cambridge Structural Database: a quarter of a million crystal structures and rising. Acta Crystallogr. 2002, 380–388. [DOI] [PubMed] [Google Scholar]
- Lipinski C. A.; Lombardo F.; Dominy B. W.; Feeney P. J. Experimental and computational approaches to estimate solubility and permeability in drug discovery and development settings. Adv. Drug. Del. Rev. 1997, 23, 3–25. [DOI] [PubMed] [Google Scholar]
- Lewell X. Q.; Judd D. B.; Watson S. P.; Hann M. M. RECAP:Retrosynthetic Combinatorial Analysis Procedure: A Powerful New Technique for Identifying Privileged Molecular Fragments with Useful Applications in Combinatorial Chemistry. J. Chem. Inf. Model. 1998, 38, 511–522. [DOI] [PubMed] [Google Scholar]
- BioFocus eUpdate: 3D fragments now available. http://www.biofocus.com/e-update-october-2011.htm (accessed July 28, 2012).
Associated Data
This section collects any data citations, data availability statements, or supplementary materials included in this article.
Data Citations
- ChEMBL. https://www.ebi.ac.uk/chembl/ (accessed March 15, 2012)
- DrugBank. http://www.drugbank.ca/downloads (accessed March 15, 2012)
- BioFocus. http://www.biofocus.com/offerings/compound-libraries/kinase.htm (accessed March 15, 2012)