

Background: Selective serotonin reuptake inhibitors (SSRIs) are used for the treatment of mood and anxiety disorders.
Results: SSRIs inhibit insulin action and secretion, promote the unfolded protein response, and induce apoptosis of pancreatic β cells.
Conclusion: SSRIs inhibit insulin signaling and beta cell function.
Significance: SSRIs might accelerate the transition from an insulin-resistant state to overt diabetes.
Keywords: Beta Cell, Cell Death, Cell Signaling, Insulin Resistance, Insulin Secretion, insulin Receptor Substrate Proteins, Selective Serotonin Reuptake Inhibitors
Abstract
Selective serotonin reuptake inhibitors (SSRIs) are antidepressants used for the treatment of mood and anxiety disorders. Here, we demonstrate that incubation (2 h) of murine islets or Min6 β cell line with the SSRIs paroxetine, fluoxetine, or sertraline inhibited insulin-induced Tyr phosphorylation of insulin receptor substrate (IRS)-2 protein and the activation of its downstream targets Akt and the ribosomal protein S6 kinase-1 (S6K1). Inhibition was dose-dependent with half-maximal effects at ∼15–20 μm. It correlated with a rapid dephosphorylation and activation of the IRS kinase GSK3β. Introduction of GSK3β siRNAs eliminated the inhibitory effects of the SSRIs. Inhibition of IRS-2 action by 30 μm SSRI was associated with a marked inhibition of glucose-stimulated insulin secretion from murine and human pancreatic islets. Secretion induced by basic secretagogues (KCl and Arg) was not affected by these drugs. Prolonged treatment (16 h) of Min6 cells with sertraline resulted in the induction of inducible nitric oxide synthase; activation of endoplasmic reticulum stress, and the initiation of the unfolded protein response, manifested by enhanced transcription of ATF4 and C/EBP homologous protein. This triggered an apoptotic process, manifested by enhanced caspase 3/7 activity, which resulted in β cell death. These findings implicate SSRIs as inhibitors of IRS protein function and insulin action through the activation of GSK3β. They further suggest that SSRIs inhibit insulin secretion; induce the unfolded protein response; activate an apoptotic process, and trigger β cell death. Given that SSRIs promote insulin resistance while inhibiting insulin secretion, these drugs might accelerate the transition from an insulin-resistant state to overt diabetes.
Introduction
Antidepressants are widely used for the treatment of mood and anxiety disorders. There are several classes of antidepressants, all affecting brain neurotransmission. Tricyclic antidepressants and tetracyclic antidepressants block the reuptake of both norepinephrine and serotonin, whereas selective serotonin reuptake inhibitors (SSRIs)2 (e.g. sertraline and paroxetine) block only the serotonin transporter (1, 2).
Long term use of SSRIs is associated with an increased risk of diabetes (3–5). This could be attributed to weight gain, a frequent side effect of treatment with SSRIs (6). Weight gain that leads to obesity is associated with an increased incidence of hypertension, dyslipidemia, coronary artery disease, insulin resistance, and overt diabetes (3, 7). Despite these findings, little is known about the pathophysiology of SSRIs as direct inducers of insulin resistance. Insulin resistance is a common pathological state in which target cells fail to respond to ordinary levels of circulating insulin (8). Individuals with insulin resistance suffer from impaired insulin action and are predisposed to developing type 2 diabetes, a 21st century epidemic (9).
Insulin action is mediated by the insulin receptor (IR), which functions as Tyr-specific protein kinase (10). IR engages with a set of intracellular adaptor proteins that modulate its biological activity. Major among them are the insulin receptor substrate (IRS) proteins, IRS-1 and IRS-2, which integrate many of the pleiotropic effects of insulin. IRS proteins undergo phosphorylation on multiple Tyr residues that serve as a docking sites for SH2-containing proteins similar to the p85α regulatory subunit of PI3K, which further propagates insulin signals (11, 12). IRS proteins play a key role in growth and survival of pancreatic β cells. Irs2−/− mice develop diabetes 8–10 weeks after birth due to reduced β cell mass and impaired β cell function (13). Conversely, β cell-specific expression of Irs2 promotes β cell growth, survival, and insulin secretion and prevents diabetes in Irs2−/− mice, obese mice, and streptozotocin-treated mice (14). IRS-2-mediated signaling also protects β cells from undergoing apoptosis (15).
IRS proteins contain over eighty potential Ser/Thr phosphorylation sites for kinases like protein kinas A, PKC, AMPK, GSK3β, IKKβ, and JNK (reviewed in Refs. 16 and17). We have previously shown (18, 19) that insulin-induced Ser/Thr phosphorylation of IRS proteins dissociates them from the IR, prevents their Tyr phosphorylation, and inhibits their interactions with downstream effectors. This serves as a physiological feedback control mechanism, utilized by insulin and insulin-like growth factor-1, to turn off signaling cascades. However, inducers of insulin and insulin-like growth factor-1 resistance take advantage of this mechanism. By triggering the phosphorylation of IRS proteins on inhibitory Ser/Thr sites, they lead to the uncoupling of the IRS proteins from IR or insulin-like growth factor-1 receptor and thus inhibit their biological activities (16, 17). Indeed, increased Ser phosphorylation of IRS proteins has been observed as a result of hyperglycemia (20), after treatment of cells with activators of PKC (21–23), or after incubation of cells with proinflammatory cytokines (18, 24–28). These results implicate IRS kinases activated by inducers of insulin resistance as potential inhibitors of IRS proteins function (16, 17).
In addition to their action on IRS proteins, certain inducers of insulin resistance disrupt the homeostasis of the endoplasmic reticulum (ER) and trigger the activation of the unfolded protein response (UPR) (24–27). The latter serves to reduce ER stress through attenuation of protein translation and through activation of transcriptional programs that ultimately increase ER protein folding and maturation (28). However, prolonged and severe ER stress activates the apoptosis program, which is executed by a number of transcription factors such as CHOP (29). Because of their high rate of protein synthesis, β cells are particularly susceptible to ER stress leading to CHOP expression and apoptosis (24, 30).
We have previously shown that SSRIs act as inducers of insulin resistance through the promotion of Ser/Thr phosphorylation of IRS-1 (31). In the present study, we set to investigate whether SSRIs affect IRS-2 and β cell function. We could demonstrate that short term treatment with selected SSRIs increases Ser/Thr phosphorylation of IRS-2, mediated by GSK3β. This inhibits IRS-2 functions and impairs glucose-stimulated insulin secretion from murine pancreatic islets. We could further show that long-term treatment with these drugs induces ER stress, followed by activation of the UPR that results in cellular apoptosis. These findings implicate SSRIs as potential inducers of insulin resistance and death of pancreatic β cells.
EXPERIMENTAL PROCEDURES
Materials
Insulin, fluoxetine, sertraline, collagenase (type XI), and protease inhibitor mixture were from Sigma. Paroxetine maleate was from Tocris Bioscience (Ellisvile, MO). Hank's solution, DMEM, and RPMI were from Biological industries (Beit Haemek, Israel). Protein A-agarose beads were from Santa Cruz Biotechnology (Santa Cruz, CA). GSK3β inhibitor (BIO) X was from EMD Chemicals (San Diego, CA). Enzolyte-caspaseTM RH110 caspase 3/7 assay kit was from AnaSpec, Ltd. (San Jose, CA). Mouse insulin ELISA kit was from Mercodia (Uppsala, Sweden). CellTiter-Blue assay kit was from Promega.
Antibodies
Monoclonal p-Tyr (PY-20) antibodies were from BD Biosciences. Monoclonal phospho-Akt (Thr-308), polyclonal phospho-S6K1 (Thr-389), monoclonal GSK3β, polyclonal phospho-c-JUN (Ser-63), polyclonal phospho-SAPK/JNK (Thr-183/Tyr-185), and polyclonal SAPK/JNK antibodies were from Cell Signaling Technology, Inc. (Beverly, MA). Polyclonal PI3K p85α, actin, and Akt antibodies were from Santa Cruz Biotechnology. Polyclonal phospho-p38 MAPK antibodies were from R&D Systems (Minneapolis, MN). Polyclonal IRS-2 antibodies were generated as described (18). Polyclonal phospho-ERK MAPK and p38 MAPK were kindly provided by Rony Seger (Weizmann Institute). Goat anti-rabbit, anti-mouse, anti-goat, and anti-donkey antibodies were from Jackson ImmunoResearch Laboratories (West Grove, PA).
Mice
Male C57BL/6J (age 8–10 weeks) mice were housed under standard light/dark conditions and were given access to food and water ad libitum. Experiments were approved by the Animal Care and Use Committee of the Weizmann institute of Science.
Treatment of Cells and Preparation of Cell Extracts
Mouse insulinoma (Min6) cells were grown in Dulbecco's Modified Eagle's Medium (DMEM) supplemented with 10% FBS to 70–80% confluence. Cells were then incubated with the indicated drug and/or insulin. Treated cells were washed three times with PBS and were harvested in buffer A (25 mm Tris-HCl, 2 mm sodium orthovanadate, 0.5 mm EGTA, 10 mm NaF, 10 mm sodium pyrophosphate, 80 mm β-glycerophosphate, 25 mm NaCl, 1% Triton X-100, protease inhibitor mixture (diluted 1:1,000, pH 7.4). Cell extracts were centrifuged at 20,000 × g for 15 min at 4 °C, and the supernatants were collected. Samples (40–150 μg) were mixed with 5× Laemmli sample buffer, boiled, and resolved by 8% SDS-PAGE under reducing conditions. The proteins were transferred to nitrocellulose membrane for Western blotting with the different antibodies.
Immunoprecipitation
Protein A-agarose beads were washed with ice-cold 0.1 m Tris-HCl (pH 8.0) and were incubated with polyclonal IRS-2 antibodies in 0.1 m Tris-HCl (pH 8.0) for 4 h at 4 °C. Supernatants (centrifuged at 12,000 × g) of cell extracts in buffer A, containing 0.8–1.2 mg of protein, were incubated overnight at 4 °C with the immobilized antibodies. Immunocomplexes were washed three times with buffer A and were mixed with Laemmli sample buffer.
Transfection of siRNAs
Chemically synthesized, double-strand siRNAs (SMARTpools) targeting mouse JNK1/2 (NM_016700/016961) and GSK3β (NM_019827) as well as a control (non targeting) siRNA were purchased from Dharmacon (Lafayette, CO). Min6 cells were transiently transfected with siRNAs using Dharmafect transfection reagent (version 4, Dharmacon). 48 h post-transfection cells were deprived of serum for additional 14 h before being incubated with the indicated drug and/or insulin.
Mass Spectrometry Analysis and Nano-LC-ESI-MS/MS
Analysis was carried out as described in the supplemental data.
Isolation of Murine Islets
Murine islets were isolated as we described (32, 33). In brief, digested pancreata were filtered through a 1000-μm and 500-μm sieves and islets >75 and <250 μm were handpicked under a stereoscope. Islets were cultured in RPMI 1640 medium, 5 mm glucose, 10% FCS, 50 units/ml penicillin, 50 μg/ml streptomycin, and 40 μg/ml gentamycin and were used within 48 h following isolation.
Culture of Human Islets
Isolated human islets (>90% purity) were provided by the European Consortium for Islets Transplantation (Islet for Basic Research program) through Juvenile Diabetes Research Foundation Award 31-2008-413. Islets were cultured at 37 °C in a 5% CO2 humidified atmosphere in CMRL 1066 medium containing 10% (v/v) FBS, 2 mm l-glutamine, 100 units/ml penicillin, 100 μg/ml streptomycin, 0.25 μg/ml amphotericin, and 40 μg/ml gentamycin. The medium was changed every other day. Human islets studies received Ethics Committee approval.
Generation of Adenoviral Constructs Expressing Myc-tagged IRS-2
Adenoviral constructs were generated as we described (32) according to the protocol provided by AdEasy vector system (Quantum). Briefly, cDNA encoding Myc-IRS-2 was ligated into the shuttle plasmid pAdTrack-CMV, which contains a GFP cassette driven by an independent promoter that served as a tracing marker. The recombinant pAdTrack-CMV was co-transformed with pAdEasy-1 containing the adenovirus genome, into Escherichia coli strain BJ5183, where homologous recombination took place. Positive colonies were identified by restriction analysis. The recombinant pAdEasy-1-CMV-IRS-2 plasmids were transfected into HEK293 cells, and viruses were amplified according to the manufacturer's instructions. Viruses were stored at −80 °C at a viral titer of ∼ 1010 pfu/ml.
Infection with Adenoviral Constructs
Murine islets (50–60 islets/treatment) were cultured in 35-mm extracellular matrix-coated plates (Novamed, Jerusalem). A 24-h post culturing islets were infected with adenoviral constructs (multiplicity of infection, 600) for the indicated times. Treatments were applied up to 72-h post infection.
Glucose-stimulated Insulin Secretion
Min6 cells or primary mouse and human islets were incubated for 60 min with 0, 2.5, or 3.3 mm glucose, respectively, in KRBH buffer (124 mm NaCl, 5.6 mm KCl, 2.5 mm CaCl2, and 20 mm Hepes, pH 7.4). Cells were then incubated for 60 min at 37 °C with 20.0, 22.5, or 16.7 mm glucose for Min6 cells or mouse or human islets, respectively. Cellular insulin content and the content of insulin secreted to the medium were determined using Mercodia ELISA kits (Uppsala, Sweden).
Caspase Activity
Apoptosis was determined by caspase 3/7 activity kit (Enzolyte-caspase 3-RH110, AnaSpec, Ltd.) using fluorescent microplate reader excitation/emission = 496/520 nm.
Cellular Reducing Power
Cellular reducing power was determined using the CellTiter-Blue assay kit (Promega) using fluorescent microplate reader excitation/emission = 480/530 nm.
Quantitative Real-time PCR
RNA was extracted from Min6 cells using the PerfectPure RNA kit (5Prime), and first-strand cDNA was generated by cDNA reverse transcription kit (Applied Biosystems). Quantitative detection of specific mRNA transcripts was carried out by real-time PCR using ABI-PRISM 7300 instrument (Applied Biosystems) using SYBR green PCR mix (Invitrogen) and the following primers: inducible nitric oxide synthase (mouse), 5′-GCCCTGCTTTGTGCGAAGTG-3′ (forward); 5′-AGCCCTTTGTGCTGGGAGTC-3′ (reverse); ATF4 (mouse), 5′-CCTTCGACCAGTCGGGTTTG-3′ (forward) and 5′-GTCGCTGGAGAACCCATGAG-3′ (reverse); CHOP (mouse), 5′-GCAGGAGAACGAGCGGAAAG-3′ (forward) and 5′- CTGACCATGCGGTCGATCAG-3′ (reverse). Actin was as follows: (mouse), 5′- GGCCAACCGTGAAAAGATGA-3′ (forward) and 5′-CACAGCCTGGATGGCTACGT-3′ (reverse). Data were normalized for the content of actin mRNA.
Flow Cytometry
Min6 cells were stained for PI and annexin V using the annexin V-FLUOS staining kit (Roche Applied Science). Cells were filtered through 72-μm sieves, and flow cytometry was performed on a two-laser, FACSCalibur (BD Biosciences). Data were analyzed with BD Cellquest Pro software.
Densitometry and Statistical Analysis
The intensity of bands in autoradiograms was determined by densitometry that was carried out on exposures within the linear range. Graphic analysis was performed with NIH image software. Intensities of phosphorylated proteins were normalized relative to their total protein expression levels. Results are presented as means ± S.E. Differences between experimental conditions were determined by two-tailed Student's t test. *, **, and *** correspond to p < 0.05, 0.01, and 0.001, respectively.
RESULTS
Sertraline Inhibits Insulin-induced Tyr Phosphorylation of IRS-2 and Its Coupling with Downstream Effectors
To investigate the effects of SSRIs on insulin signaling, Min6, an established β cell line (34), was studied. Cells were incubated with sertraline, a widely used SSRI (35), for 2 h before being stimulated for 10 min with insulin (10 μm). Sertraline (10–30 μm) did not affect the cellular content of IRS-2 (Fig. 1A); however, it significantly inhibited (40–60%) both basal and insulin-stimulated Tyr phosphorylation of IRS-2. This was evident in total cell extracts (Fig. 1A) and in IRS-2 immunoprecipitation (Fig. 1B). Other SSRIs, paroxetine and fluoxetine, exerted similar effects albeit at higher concentrations (50–75 μm, data not shown). Sertraline also affected IRS-2 coupling with its downstream effectors. As shown in Fig. 2A, the amount of p85α that co-immunoprecipitated with IRS-2 was reduced by 52 ± 13% in sertraline-treated Min6 cells. Similarly, sertraline inhibited in a dose-dependent manner, both basal and insulin-induced phosphorylation of Akt and S6K1 (Fig. 2B), suggesting that it inhibits the coupling of IRS-2 with its downstream effectors.
FIGURE 1.

Sertraline inhibits insulin-induced Tyr phosphorylation of IRS-2 in MIN6 cells. MIN6 cells were deprived of serum and glucose for 14 h. The cells were then incubated with sertraline at the indicated concentrations for 2 h at 37 °C and were further stimulated with 10 μm of insulin for 10 min. A, total cell extracts (80 μg) were prepared, and samples were resolved by SDS-PAGE and immunoblotted with anti-phospho-Tyr (αpY) or anti-IRS-2 antibodies as indicated. B, total cell extracts were immunoprecipitated with anti-IRS-2 antibodies; samples (800 μg) were resolved by SDS-PAGE and were immunoblotted (IB) with anti-phospho-Tyr or IRS-2 antibodies. Bar graphs represent mean ± S.E. of densitometry measurements of at least three independent experiments in duplicates. ***, p < 0.001 compared with insulin stimulated control. A.U., Arbitrary Units.
FIGURE 2.

Uncoupling IRS-2 from its downstream effector p85α and inhibition of Akt and S6K1 by sertraline. Min6 cells were treated as described in the legend to Fig. 1. A, total cell extracts (800 μg) were immunoprecipitated with anti-IRS-2 antibodies. Samples were resolved by SDS-PAGE and were immunoblotted with anti IRS-2 or anti-p85 antibodies. B, total cell extracts were resolved by SDS-PAGE and immunoblotted (IB) with anti-pAkt, Akt, pS6K1, or actin antibodies. Bar graphs represent mean ± S.E. of densitometry measurements of at least three independent experiments in duplicates. *, p < 0.05. ***, p < 0.001 compared with insulin-stimulated controls.
Activation of MAPK Family Members and GSK3β by SSRIs
The stress-activated kinase, JNK, inhibits the activity of IRS proteins through Ser/Thr phosphorylation (36). We have previously shown that SSRIs stimulate JNK in C6 glioma, neuroblastoma and Fao rat hepatoma cells (31, 37). Consistent with these findings, a 2-h incubation of Min6 cells with sertraline (30 μm) activated JNK by ∼7.5-fold, whereas paroxetine and fluoxetine at higher concentrations (50–100 μm) activated JNK by 3.5–4.5-fold, compared with untreated cells (Fig. 3A). An inverse correlation existed between Tyr phosphorylation of IRS-2 and the activation of JNK. The highest negative correlation was found upon treatment with sertraline (R2 = 0.93), whereas treatment with paroxetine and fluoxetine have shown lower correlations (R2 = 0.79 and R2 = 0.78, respectively) (Fig. 3B).
FIGURE 3.

Correlation between Tyr phosphorylation of IRS-2 and stimulation of JNK activity. A, Min6 cells were deprived of serum and glucose for 14 h prior to the experiment. Cells were incubated at 37 °C with the indicated drugs at the indicated concentrations for 2 h. Total cell extracts (60 μg) were prepared; samples were resolved by SDS-PAGE and immunoblotted (IB) with anti-pJNK or anti-JNK antibodies as indicated. Densitometry represents mean ± S.E. of duplicate measurements of two independent experiments. B, the correlation between the reduction in Tyr-phosphorylation of IRS-2 and the activation of JNK. A.U., Arbitrary Units.
To explore the effects of SSRIs on other members of the MAPK family, the activation of ERK and p38 MAPK were investigated. As shown in Fig. 4A, sertraline (30 μm) activated p38 MAPK, with maximal effects being observed at 60 min. ERK was not activated by sertraline; rather, its basal activity was inhibited following treatment with the drug. Similarly, sertraline inhibited the basal phosphorylation of GSK3β in a time-dependent manner, thus increasing its activity. The increased activity of p38, JNK, and GSK3β accompanied the decreased Tyr phosphorylation of IRS-2 and the reduced activation of its downstream effector Akt, which were evident following 60-min treatment with sertraline and were further decreased following 120-min treatment with the drug (Fig. 4B).
FIGURE 4.

Effects of sertraline on GSK3β and MAPK family members. Min6 cells were deprived of serum and glucose for 14 h before being incubated at 37 °C with sertraline (30 μm) for the indicated time (A). Cells were then further stimulated with 10 μm insulin for 10 min (B). Total cell extracts (20 μg) were prepared; samples were resolved by SDS-PAGE and immunoblotted with the indicated antibodies. Bar graphs represent mean ± S.E. of densitometry measurements of three independent experiments done in duplicates. A.U., Arbitrary Units.
siRNAs to GSK3β, but Not to JNK, Attenuate the Inhibitory Effects of SSRIs on Insulin Signaling
To directly evaluate the role of JNK and GSK3β as mediators of the inhibitory effects of sertraline, siRNAs directed to these proteins were introduced into Min6 cells, prior to sertraline treatment. As shown in Fig. 5A, the siRNAs partially inhibited the expression of GSK3β and JNK (∼35 and 45%, respectively). However, whereas the reduced expression of GSK3β eliminated the inhibitory effects of sertraline on Tyr phosphorylation of IRS-2 (and the activation of Akt) (Fig. 5B), the siRNAs to JNK failed to do so (Fig. 5C). Similar results were obtained following immunoprecipitation of the cell extracts with IRS-2 antibodies (Fig. 5D). These observations implicate GSK3β as a downstream target of sertraline, although the role of JNK cannot be completely ruled out due to the only partial inhibition of its transcription by its siRNA.
FIGURE 5.

siRNA to GSK3β protects Min6 cells from the effects of sertraline. A, Min6 cells were transfected with the indicated siRNA SMARTpools or with non-targeting (NonT) control siRNAs. 48 h post-transfection, cells were deprived of serum and glucose for 14 h, incubated with sertraline (30 μm) 1 h at 37 °C, and then further stimulated with 10 μm of insulin for 10 min. Total cell extracts (20 μg) were prepared, resolved by SDS-PAGE, and immunoblotted with anti-GSK3β, actin, pc-JUN, and anti-JNK1/2 antibodies. B and C, total cell extracts (20 μg) were prepared, resolved by SDS-PAGE, and immunoblotted with anti-phospho-Tyr (αpY), IRS-2, pAkt, or anti-Akt antibodies. D, total cell extracts were immunoprecipitated with anti-IRS-2 antibodies; samples (500 μg) were resolved by SDS-PAGE and were immunoblotted (IB) with anti phospho-Tyr or IRS-2 antibodies. Densitometry represents mean ± S.E. of duplicate measurements of three independent experiments. *, p < 0.05; ***, p < 0.001 compared with controls. A.U., Arbitrary Units.
Sertraline Induces Ser/Thr Phosphorylation of IRS-2
All of the above results were consistent with the hypothesis that sertraline induces Ser/Thr phosphorylation of IRS-2. To provide a direct proof to this concept, IRS-2 immunoprecipitated from control and sertraline-treated cells were subjected to tandem mass spectrometric analysis (MS/MS). As shown in Fig. 6 (bottom), sertraline selectively increased the phosphorylation of at least 15 Ser/Thr residues. This number is an underestimation due to incomplete coverage of the IRS-2 protein subjected to analysis (Fig. 6, top).
FIGURE 6.

Sertraline promotes serine/threonine phosphorylation of IRS-2 in Min6 cells. Min6 cells were deprived of serum and glucose for 14 h. Cells were then incubated with 30 μm sertraline for 2 h at 37 °C. Total cell extracts were immunoprecipitated with anti-IRS-2 antibodies. Samples (800 μg) were resolved by SDS-PAGE, and the band corresponding to IRS-2 was subjected to analysis by mass spectrometry. A, coverage of IRS-2 protein subjected to analysis by mass spectrometry following trypsin digestion is shown. Blanks represent uncovered area. B, Ser/Thr sites, the phosphorylation of which was significantly increased by sertraline. Data represent meta analysis of three independent experiments. PH, Pleckstrin Homology domain; PTB, Phosphotyrosine Binding Domain; KRLB, Kinase Regulatory-Loop Binding region.
Effects of SSRIs on Insulin Signaling in Isolated Islets
The effects of SSRIs on insulin signaling in murine islets were studied next. The endogenous IRS-2 could be hardly detected by Western blots of 100 isolated islets (data not shown); therefore, infection of islets with a recombinant adenovirus harboring Myc-IRS-2WT was required. Isolated mouse islets, expressing Myc-IRS-2, were incubated with sertraline for 2 h prior to stimulation for 10 min with insulin. Pretreatment with sertraline (30 μm) did not affect the cellular content of IRS proteins. However, it decreased the insulin-induced Tyr phosphorylation of IRS-2 by 55% when compared with islets treated with insulin alone for 10 min (Fig. 7). Treatment with sertraline also reduced insulin-induced Akt phosphorylation by ∼70% (Fig. 7) with no effect on the cellular content of the Akt protein. Unlike sertraline, treatment with paroxetine at 75 μm failed to exert an inhibitory effect on murine islets (data not shown).
FIGURE 7.
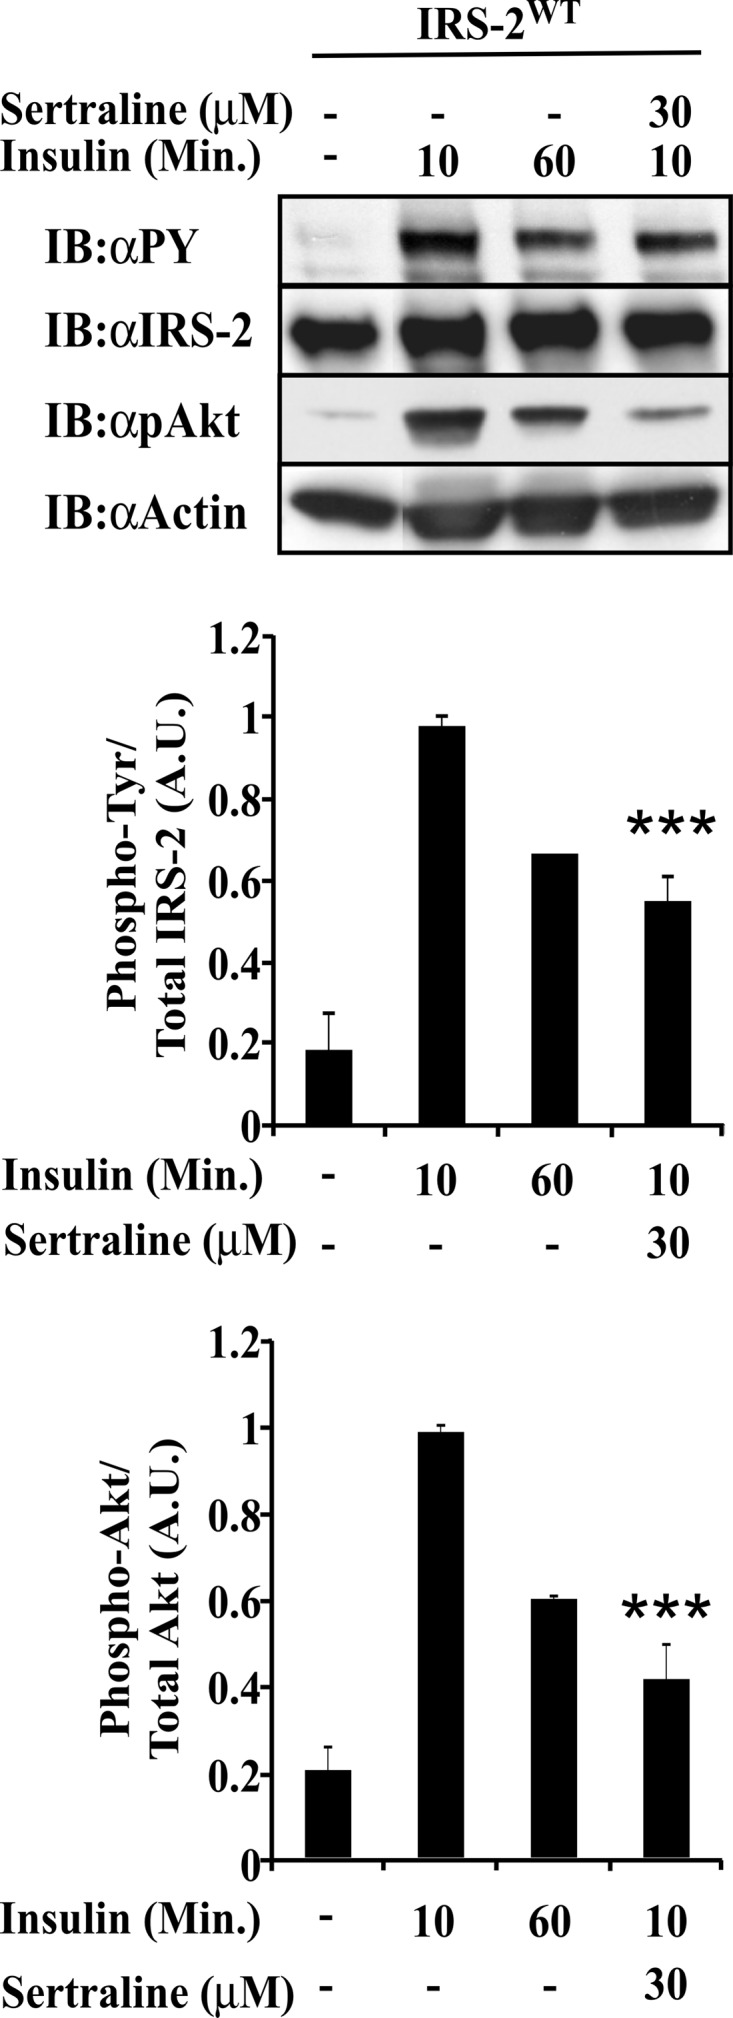
Effects of sertraline in isolated pancreatic islets. Murine islets were infected 24 h after isolation with a recombinant adenovirus harboring myc-IRS-2WT. 48 h thereafter, islets were treated for 2 h with 100 μm sodium orthovanadate in the presence or absence of sertraline. Islets were then stimulated with insulin (10 μm) for 10 or 60 min. Total cell extracts were prepared, resolved by SDS-PAGE, and immunoblotted with anti-phospho-Tyr (αpY), IRS-2, pAkt, or anti-actin antibodies. Densitometry represents mean ± S.E. of duplicate measurements of three independent experiments. ***, p < 0.001 compared with controls. A.U., Arbitrary Units; Min., Minutes.
SSRIs Inhibit Glucose-stimulated Insulin Secretion (GSIS)
Proper action of IRS proteins is essential for β cell function and insulin secretion (14, 38). Therefore, we examined whether sertraline affects glucose-stimulated insulin secretion. As shown in Fig. 8, Min6 cells as well as murine and human pancreatic islets treated for 2 h with sertraline (30 μm) exhibited normal basal insulin secretion however their GSIS was reduced by ∼50%. In contrast, glucose-independent secretion, induced by KCl and Arg remained unaffected (Fig. 8). To determine whether the reduced GSIS could be attributed to a reduction in cellular reducing power, Min6 cells were treated for 75 min with increasing doses of sertraline. As shown in Fig. 9A, sertraline at 30 μm, the concentration that inhibited GSIS, markedly reduced, in a dose-dependent manner, the glucose-induced increase in cellular reducing power, a key step in insulin secretion (39). Sertraline however had no effect on the basal cellular reducing power, required to maintain cell viability, nor did it induce caspase 3/7 activity under these conditions (data not shown). Similar results were obtained with mouse islets; sertraline (at 30 μm) did not affect basal cellular reducing power (data not shown) and failed to induce caspase 3/7 activity in islets treated for 4 h with the drug, unlike staurosporine, which effectively induced an apoptotic process (Fig. 9B). Hence, the short term (∼1 h) effects of sertraline on GSIS could be attributed to its inhibitory action on glucose-induced ATP production, without affecting cell viability. This inhibitory effect of sertraline could be mediated, at least partially by GSK3β because inclusion of LiCl, a specific inhibitor of GSK3β (40) partially prevented this effect (Fig. 9A).
FIGURE 8.

Effects of sertraline on insulin secretion. Min6 cells (A), mouse (B), and human (C) pancreatic islets were incubated for 1 h (A) or 2 h (B and C) with KRBH buffer supplemented with 10 mm Hepes, 1 mg/ml BSA, and sertraline (30 μm) with no glucose (A), 2.5 mm glucose (B), or 3.3 mm glucose (C). The medium was replaced by KRBH supplemented either with 20, 22.5, or 16.7 mm glucose, as indicated or with 2.5 mm glucose and the indicated concentrations of KCl or KCl plus l-arginine, and incubation continued for additional 1 h. Insulin secretion was determined as described under “Experimental Procedures.” The amounts of secreted insulin were normalized relative to the total insulin content (B) or total protein content (A). Data shown are mean ± S.E. of three experiments carried out in triplicates. **, p < 0.01; ***, p < 0.001 compared with controls. mU, milliunits; L, liter.
FIGURE 9.

Effects of sertraline on cellular reducing power. A, Min6 cells were incubated for 1 h in KRBH buffer supplemented with 10 mm Hepes, 1 mg/ml BSA in the absence or presence of 30 mm LiCl. Cell were further incubated for 1 h with the indicated concentrations of sertraline, before being incubated in the presence or absence of 20 mm glucose for additional 15 min. Cellular reducing power was determined as described under “Experimental Procedures.” Data shown are mean ± S.E. of three experiments carried out in triplicates. B, mouse islets were treated with sertraline or staurosporine (STS) for 4 h, and caspase activity was determined as described under “Experimental Procedures.” Data shown are mean ± S.E. of three experiments carried out in triplicates. *, p < 0.05; **, p < 0.01, ***, p < 0.001 compared with controls. A.U., Arbitrary Units.
Long Term Effects of Sertraline on Cell Viability
Although short term (1 h) treatment with sertraline did not affect cell viability (Fig. 9), long term (16-h) incubation with the drug induced an apoptotic process and death of Min6 cells, as evident by a significant increase in caspase 3/7 activity in cells treated with 10 μm sertraline for 16 h (Fig. 10A). Cellular reducing power also decreased in the presence of sertraline (Fig. 10B). FACS analysis (Fig. 10D) further revealed that the fraction of viable Min6 cells (Q2) decreased in a dose-dependent manner upon 16 h treatment with sertraline (10–30 μm). Such a decrease was accompanied by an increase in the fraction of apoptotic (Q4) as well as dead cells (Q3). Inclusion of a GSK3β inhibitor (LiCl) eliminated the increase in caspase 3/7 activity and the reduction in cellular reducing power induced by sertraline (Fig. 10, A and B), whereas a different GSK3β inhibitor, BIO-X, was somewhat less potent. Of interest, silencing of JNK1/2 partially eliminated the ability of sertraline to promote caspase activity (Fig. 10C), consistent with the idea that the short and long term effects of sertraline might involve different signaling pathways.
FIGURE 10.

Long-term effects of Sertraline on caspase activity and viability of Min6 cells. A and B, Min6 cells remained untreated (open bars) or were treated with 30 mm LiCl (black bars) or BIO X (gray bars) for 1 h before being treated with 10 μm sertraline for 16 h. Caspase 3/7 activity (A) and cellular reducing power (B) were then determined as described under “Experimental Procedures.” C, Min6 cells were transfected with siRNA to JNK1/2 SMARTpools (50 nm) (black bars) or with non-targeting (NonT) control siRNAs (open bars). 48 h post-transfection, cells were treated with 10 μm sertraline for 16 h. Caspase 3/7 activity was then determined. D, Min6 cells were incubated for 16 h with the indicated concentrations of sertraline. Cells were collected, stained with propidium iodide (PI) or annexin V, and were analyzed by FACS. Outputs were gated and quantified for propidium iodide-positive cells (Q1), live cells (Q2), annexin V and PI-positive cells (Q3), or annexin V-positive cells (Q4). Data shown are mean ± S.E. of three (A and B) and two (C and D) experiments carried out in triplicates. *, p < 0.05; **, p < 0.01; ***, p < 0.001 compared with controls.
Sertraline Induces an ER Stress and the UPR in Min6 Cells
Sustained ER stress and the resulting activation of the UPR may lead to the induction of an apoptotic process (41). To determine whether sertraline triggers an ER stress response, the effects of sertraline on ATF4 and CHOP, key elements along the UPR signaling pathway (41), were analyzed. As shown in Fig. 11, 2-h treatment with sertraline did not affect the mRNA levels of ATF4 or CHOP; however, when the incubation with the drug, even at 5 μm, was extended to 16 h, a significant increase in mRNA levels of ATF4 and CHOP was observed. The effects of sertraline were more modest than those of thapsigargin, a classical inducer of ER stress (Fig. 11). ER stress is induced, at least in part, as a result of an increase in intracellular reactive oxygen species (41). Indeed, as shown in Fig. 11, an increase in mRNA levels of inducible nitric oxide synthase preceded the increase in ATF4 and CHOP transcription, suggesting that prolonged treatment (16 h) with sertraline induces inducible nitric oxide synthase, activates an ER stress and UPR, triggers an apoptotic process, and results in death of the Min6 cells.
FIGURE 11.

Effects of sertraline on ER stress and the UPR in MIN6 cells. Min6 cells were incubated for 2 or 16 h with the indicated concentrations of sertraline or thapsigargin. mRNA levels of the indicated genes were determined by quantitative RT-PCR. The content of actin mRNA served for normalization. Data shown are the mean ± S.E. of three experiments carried out in duplicates. *, p < 0.05; **, p < 0.01; ***, p < 0.001 compared with controls.
DISCUSSION
In the present work, we demonstrate that selected antidepressants that belong to the SSRI family induce insulin resistance in cultured Min6 cells and isolated murine islets. The short term inhibitory effects of SSRIs on insulin action result in a marked reduction in GSIS in islets treated with sertraline, a potent SSRI. The mechanism underlying this action may involve the activation of IRS-2 kinases such as GSK3β, which promote phosphorylation of IRS-2 on selected inhibitory Ser sites that results in the inhibition of insulin action (16). Sertraline also exerts long term inhibitory action on β cells that involves induction of ER stress, activation of the UPR, and triggering of β cell apoptosis. Hence, the combined short and long term effects of sertraline impair β cell function and induce β cell death.
Several lines of evidence support the above conclusions. First, we could show that sertraline activates GSK3β that has been previously implicated as an effective IRS kinase that inhibits the function of IRS proteins (42). We could further show that introduction of siRNAs to GSK3β reversed this inhibitory effect. We could also confirm previous observations that SSRIs activate JNK and p38 MAPK (31, 37, 43) and showed that Tyr phosphorylation of IRS-2 decreases in correlation with increased activation of JNK1/2; however, we could not establish a causal relation between these two events because JNK1/2 siRNA failed to reverse the inhibitory action of sertraline. It could be argued that the partial inhibition of JNK expression (∼45%) by its siRNA is not high enough to knock down the activity of this enzyme. Alternatively, a kinase upstream of JNK could phosphorylate IRS-2.
Ser/Thr phosphorylation of IRS proteins can induce their dissociation from the insulin receptor (44), hinder Tyr phosphorylation sites (45), release the IRS proteins from intracellular complexes that maintain them in close proximity to the receptor (46), or induce IRS proteins degradation (47, 48). These multiple effects suggest that the Ser sites subjected to phosphorylation play a key role in regulating IRS-2 function. Being a major constituent along the insulin signaling pathway, inhibition of Tyr phosphorylation of IRS-2 by SSRIs prevents it from coupling with downstream effectors that mediate the metabolic and growth promoting functions of insulin. Akt (PKB) is one such downstream effector, and indeed, we could show that insulin fails to activate Akt in cells treated with SSRIs.
Short term treatment of pancreatic β cells with SSRIs also inhibits GSIS. This could be attributed, at least in part, to the inhibition of IRS-2 function, which is a known mediator of GSIS (49). Indeed, as shown here and consistent with previous observations (38), a short term (1-h) inhibition of Tyr phosphorylation of IRS-2 is sufficient to impair GSIS. IRS-2 promotes transcription of Pdx1, a transcription factor activated once its repressor FOXO1 is inhibited through Akt phosphorylation and nuclear exclusion (50, 51). PDX1 promotes the expression of pro-insulin (52), Glut2 (53), and glucokinase (54), which all contribute to increased insulin secretion. Insulin-induced gene transcription is a rapid event (49); hence, inhibition of IRS-2 function could impede GSIS. An additional short term effect of sertraline is the inhibition of the glucose-induced increase in cellular reducing power and ATP content, a key step in insulin secretion (39). This action of sertraline could be mediated by its effects on GSK3β, as inclusion of GSK3β inhibitor attenuates the effects of sertraline. Sertraline, however, does not affect basal cellular reducing power required to maintain cell viability nor does it induce caspase 3/7 activity under these conditions. It is presently unclear whether the inhibitory effects of sertraline on glucose-induced increase in cellular reducing power and the increased Ser/Thr phosphorylation of IRS-2 are linked events or are two independent actions of sertraline that contribute both to the inhibition of GSIS.
Long term (16-h) treatment with sertraline induces an ER stress and the initiation of the UPR that triggers an apoptotic β cell death. The induction of ER stress is associated with increased levels of inducible nitric oxide synthase mRNA and transcription of ATF4 and CHOP that are key constituents of the UPR. Increased expression of CHOP induces apoptosis, a well established effect of this protein (55). Although it is reasonable to assume that the short term actions of sertraline induce its long term effects, there is no direct proof for such a connection. Hence, one cannot rule out the possibility that the effects of sertraline on ER stress and the UPR occur independently of its inhibitory action on IRS-2 function and the cellular reducing power. In support of this possibility are the observations that SSRIs can affect a number of independent cellular processes. For example, fluoxetine decreases arteriolar myogenic tone by reducing smooth muscle [Ca2+] (56), whereas the tricyclic antidepressant imipramine reduces GSIS through a calcium antagonistic action (57). Hence, the different inhibitory actions of sertraline could be mediated by independent cellular processes.
The SSRI binding partners that induce the different effects of sertraline remain largely elusive. These targets are not necessarily related to the main action of SSRIs as inhibitors of 5-hydroxytriptamine reuptake. For example, the SSRI fluoxetine is a potent antagonist of muscular and neuronal nicotinic acetylcholine receptors (58) and an inhibitor of neuronal Na+ (59) channels. Likewise, paroxetine inhibits the functions of muscarinic cholinergic receptors (60) and membrane steroid transporters (61). Hence, such activities could be part of the molecular mechanisms underlying the ability of SSRIs to activate GSK3β.
The concentrations of SSRIs (5–30 μm) required to induce its effects are higher than those achieved with the current therapeutic use of these drugs for depression and anxiety-related disorders (62). Yet, given that SSRIs are highly lipophilic and could accumulate in tissues with an estimated ratio of 20:1 or even 43:1 (63, 64) and given that the concentration of sertraline found in plasma is ∼60 ng/ml (∼0.15 μm) (65), it suggests that low micromolar concentrations could be well within the physiological range. Indeed, an average concentration of 13 μm fluoxetine was found in brains of 12 subjects on a daily dose of 10–40 mg (64). This could be especially relevant for elderly subjects where plasma concentrations of drugs at steady state and their half-life elimination are generally prolonged (66).
In conclusion, we have demonstrated that SSRIs are potential inducers of insulin resistance, acting by directly inhibiting the insulin signaling cascade in β cells. We provide evidence which implicates GSK3β and possibly other IRS kinases as key mediators of the inhibitory action of SSRIs. We show that these effects involve inhibition of IRS-2 protein function and inhibition of GSIS. We further show that SSRIs inhibit the increase in cellular reducing power stimulated by glucose, activate ER stress, trigger the UPR, and induce apoptosis. Given that SSRIs promote obesity and insulin resistance but inhibit insulin secretion, they might accelerate the transition from an insulin resistant state to overt diabetes. Further studies are therefore required to assess the clinical relevance of our findings and to devise effective means to block the adverse metabolic changes induced by SSRIs.
Supplementary Material
Acknowledgments
We thank Sanford Sampson (Bar-Ilan University, Israel) for a critical review of this manuscript. We thank Dr. J. I. Miazaki (Osaka University, Osaka, Japan) for providing Min6 cells.
This work was supported by research grants from the European Foundation for the Study of Diabetes/Juvenile Diabetes Research Foundation/Novo Nordisk program, The Israel Science Foundation (founded by the Israel Academy of Sciences and Humanities Grant 759/09), and the Mitchel Kaplan Fund.

This article contains supplemental data and Table S1.
- SSRI
- selective serotonin reuptake inhibitor
- IRS
- insulin receptor substrate
- GSIS
- glucose-stimulated insulin secretion
- ER
- endoplasmic reticulum
- UPR
- unfolded protein response
- ATF4
- activating transcription factor 4
- CHOP
- C/EBP homologous protein
- IR
- insulin receptor.
REFERENCES
- 1. Gram L. (1994) Fluoxetine. N. Engl. J. Med. 331, 1354–1361 [DOI] [PubMed] [Google Scholar]
- 2. Holsboer F., Barden N. (1996) Antidepressants and hypothalamic-pituitary-adrenocortical regulation. Endocr. Rev. 17, 187–205 [DOI] [PubMed] [Google Scholar]
- 3. Raeder M. B., Bjelland I., Emil Vollset S., Steen V. M. (2006) Obesity, dyslipidemia, and diabetes with selective serotonin reuptake inhibitors: the Hordaland Health Study. J. Clin. Psychiatry 67, 1974–1982 [DOI] [PubMed] [Google Scholar]
- 4. Brown L. C., Majumdar S. R., Johnson J. A. (2008) Type of antidepressant therapy and risk of type 2 diabetes in people with depression. Diabetes Res. Clin. Pract. 79, 61–67 [DOI] [PubMed] [Google Scholar]
- 5. Andersohn F., Schade R., Suissa S., Garbe E. (2009) Long-term use of antidepressants for depressive disorders and the risk of diabetes mellitus. Am. J. Psychiatry 166, 591–598 [DOI] [PubMed] [Google Scholar]
- 6. Himmerich H., Schuld A., Haack M., Kaufmann C., Pollmächer T. (2004) Early prediction of changes in weight during six weeks of treatment with antidepressants. J. Psychiatr. Res. 38, 485–489 [DOI] [PubMed] [Google Scholar]
- 7. Després J. P., Lemieux I. (2006) Abdominal obesity and metabolic syndrome. Nature 444, 881–887 [DOI] [PubMed] [Google Scholar]
- 8. Kahn B. B., Flier J. S. (2000) Obesity and insulin resistance. J. Clin. Invest. 106, 473–481 [DOI] [PMC free article] [PubMed] [Google Scholar]
- 9. Reaven G. (2005) Insulin resistance, type 2 diabetes mellitus, and cardiovascular disease: the end of the beginning. Circulation 112, 3030–3032 [DOI] [PubMed] [Google Scholar]
- 10. Belfiore A., Frasca F., Pandini G., Sciacca L., Vigneri R. (2009) Insulin receptor isoforms and insulin receptor/insulin-like growth factor receptor hybrids in physiology and disease. Endocrine Rev. 30, 586–623 [DOI] [PubMed] [Google Scholar]
- 11. Le Roith D., Zick Y. (2001) Recent advances in our understanding of insulin action and insulin resistance. Diabetes Care 24, 588–597 [DOI] [PubMed] [Google Scholar]
- 12. Khan A. H., Pessin J. E. (2002) Insulin regulation of glucose uptake: a complex interplay of intracellular signalling pathways. Diabetologia 45, 1475–1483 [DOI] [PubMed] [Google Scholar]
- 13. Withers D. J., Gutierrez J. S., Towery H., Burks D. J., Ren J. M., Previs S., Zhang Y., Bernal D., Pons S., Shulman G. I., Bonner-Weir S., White M. F. (1998) Disruption of IRS-2 causes type 2 diabetes in mice. Nature 391, 900–904 [DOI] [PubMed] [Google Scholar]
- 14. Hennige A. M., Burks D. J., Ozcan U., Kulkarni R. N., Ye J., Park S., Schubert M., Fisher T. L., Dow M. A., Leshan R., Zakaria M., Mossa-Basha M., White M. F. (2003) Upregulation of insulin receptor substrate-2 in pancreatic beta cells prevents diabetes. J. Clin. Invest. 112, 1521–1532 [DOI] [PMC free article] [PubMed] [Google Scholar]
- 15. Withers D. J., Burks D. J., Towery H. H., Altamuro S. L., Flint C. L., White M. F. (1999) Irs-2 coordinates Igf-1 receptor-mediated beta-cell development and peripheral insulin signalling. Nat. Genet. 23, 32–40 [DOI] [PubMed] [Google Scholar]
- 16. Boura-Halfon S., Zick Y. (2009) Phosphorylation of IRS proteins, insulin action, and insulin resistance. Am. J. Physiol. Endocrinol. Metab. 296, E581–591 [DOI] [PubMed] [Google Scholar]
- 17. Tanti J. F., Jager J. (2009) Cellular mechanisms of insulin resistance: role of stress-regulated serine kinases and insulin receptor substrates (IRS) serine phosphorylation. Curr. Opin. Pharmacol. 9, 753–762 [DOI] [PubMed] [Google Scholar]
- 18. Liu Y. F., Herschkovitz A., Boura-Halfon S., Ronen D., Paz K., Leroith D., Zick Y. (2004) Serine phosphorylation proximal to its phosphotyrosine binding domain inhibits insulin receptor substrate 1 function and promotes insulin resistance. Mol. Cell Biol. 24, 9668–9681 [DOI] [PMC free article] [PubMed] [Google Scholar]
- 19. Herschkovitz A., Liu Y. F., Ilan E., Ronen D., Boura-Halfon S., Zick Y. (2007) Common inhibitory serine sites phosphorylated by IRS-1 kinases, triggered by insulin and inducers of insulin resistance. J. Biol. Chem. 282, 18018–18027 [DOI] [PubMed] [Google Scholar]
- 20. Nakajima K., Yamauchi K., Shigematsu S., Ikeo S., Komatsu M., Aizawa T., Hashizume K. (2000) Selective attenuation of metabolic branch of insulin receptor down-signaling by high glucose in a hepatoma cell line, HepG2 cells. J. Biol. Chem. 275, 20880–20886 [DOI] [PubMed] [Google Scholar]
- 21. De Fea K., Roth R. A. (1997) Modulation of insulin receptor substrate-1 tyrosine phosphorylation and function by mitogen-activated protein kinase. J. Biol. Chem. 272, 31400–31406 [DOI] [PubMed] [Google Scholar]
- 22. Kellerer M., Mushack J., Seffer E., Mischak H., Ullrich A., Häring H. U. (1998) Protein kinase C isoforms α, δ, and θ require insulin receptor substrate-1 to inhibit the tyrosine kinase activity of the insulin receptor in human kidney embryonic cells (HEK 293 cells). Diabetologia 41, 833–838 [DOI] [PubMed] [Google Scholar]
- 23. Griffin M. E., Marcucci M. J., Cline G. W., Bell K., Barucci N., Lee D., Goodyear L. J., Kraegen E. W., White M. F., Shulman G. I. (1999) Free fatty acid-induced insulin resistance is associated with activation of protein kinase C theta and alterations in the insulin signaling cascade. Diabetes 48, 1270–1274 [DOI] [PubMed] [Google Scholar]
- 24. Eizirik D. L., Cardozo A. K., Cnop M. (2008) The role for endoplasmic reticulum stress in diabetes mellitus. Endocr. Rev. 29, 42–61 [DOI] [PubMed] [Google Scholar]
- 25. Fonseca S. G., Gromada J., Urano F. (2011) Endoplasmic reticulum stress and pancreatic β-cell death. Trends Endocrinol. Metab. 22, 266–274 [DOI] [PMC free article] [PubMed] [Google Scholar]
- 26. Walter P., Ron D. (2011) The unfolded protein response: from stress pathway to homeostatic regulation. Science 334, 1081–1086 [DOI] [PubMed] [Google Scholar]
- 27. Back S. H., Kang S. W., Han J., Chung H. T. (2012) Endoplasmic reticulum stress in the β-cell pathogenesis of type 2 diabetes. Exp. Diabetes Res. 2012, 618396. [DOI] [PMC free article] [PubMed] [Google Scholar]
- 28. Ron D., Walter P. (2007) Signal integration in the endoplasmic reticulum unfolded protein response. Nat. Rev. Mol. Cell Biol. 8, 519–529 [DOI] [PubMed] [Google Scholar]
- 29. Boyce M., Yuan J. (2006) Cellular response to endoplasmic reticulum stress: a matter of life or death. Cell Death Differ. 13, 363–373 [DOI] [PubMed] [Google Scholar]
- 30. Oyadomari S., Takeda K., Takiguchi M., Gotoh T., Matsumoto M., Wada I., Akira S., Araki E., Mori M. (2001) Nitric oxide-induced apoptosis in pancreatic beta cells is mediated by the endoplasmic reticulum stress pathway. Proc. Natl. Acad. Sci. U.S.A. 98, 10845–10850 [DOI] [PMC free article] [PubMed] [Google Scholar]
- 31. Levkovitz Y., Ben-Shushan G., Hershkovitz A., Isaac R., Gil-Ad I., Shvartsman D., Ronen D., Weizman A., Zick Y. (2007) Antidepressants induce cellular insulin resistance by activation of IRS-1 kinases. Mol. Cell Neurosci. 36, 305–312 [DOI] [PubMed] [Google Scholar]
- 32. Gurevitch D., Boura-Halfon S., Isaac R., Shahaf G., Alberstein M., Ronen D., Lewis E. C., Zick Y. (2010) Elimination of negative feedback control mechanisms along the insulin signaling pathway improves beta-cell function under stress. Diabetes 59, 2188–2197 [DOI] [PMC free article] [PubMed] [Google Scholar]
- 33. Beck A., Isaac R., Lavelin I., Hart Y., Volberg T., Shatz-Azoulay H., Geiger B., Zick Y. (2011) An siRNA screen identifies transmembrane 7 superfamily member 3 (TM7SF3), a seven transmembrane orphan receptor, as an inhibitor of cytokine-induced death of pancreatic beta cells. Diabetologia 54, 2845–2855 [DOI] [PubMed] [Google Scholar]
- 34. Miyazaki J., Araki K., Yamato E., Ikegami H., Asano T., Shibasaki Y., Oka Y., Yamamura K. (1990) Establishment of a pancreatic beta cell line that retains glucose-inducible insulin secretion: special reference to expression of glucose transporter isoforms. Endocrinology 127, 126–132 [DOI] [PubMed] [Google Scholar]
- 35. Fava M., Judge R., Hoog S. L., Nilsson M. E., Koke S. C. (2000) Fluoxetine versus sertraline and paroxetine in major depressive disorder: changes in weight with long-term treatment. J. Clin. Psychiatry 61, 863–867 [DOI] [PubMed] [Google Scholar]
- 36. Boura-Halfon S., Zick Y. (2009) Serine kinases of insulin receptor substrate proteins. Vitam. Horm. 80, 313–349 [DOI] [PubMed] [Google Scholar]
- 37. Levkovitz Y., Gil-Ad I., Zeldich E., Dayag M., Weizman A. (2005) Differential induction of apoptosis by antidepressants in glioma and neuroblastoma cell lines: evidence for p-c-Jun, cytochrome c, and caspase-3 involvement. J. Mol. Neurosci. 27, 29–42 [DOI] [PubMed] [Google Scholar]
- 38. Fiory F., Lombardi A., Miele C., Giudicelli J., Beguinot F., Van Obberghen E. (2011) Methylglyoxal impairs insulin signalling and insulin action on glucose-induced insulin secretion in the pancreatic beta cell line INS-1E. Diabetologia 54, 2941–2952 [DOI] [PubMed] [Google Scholar]
- 39. Howell S. L. (1984) The mechanism of insulin secretion. Diabetologia 26, 319–327 [DOI] [PubMed] [Google Scholar]
- 40. Hiyama A., Sakai D., Arai F., Nakajima D., Yokoyama K., Mochida J. (2011) Effects of a glycogen synthase kinase-3β inhibitor (LiCl) on c-myc protein in intervertebral disc cells. J. Cell Biochem. 112, 2974–2986 [DOI] [PubMed] [Google Scholar]
- 41. Shargill N. S., Tatoyan A., el-Refai M. F., Pleta M., Chan T. M. (1986) Impaired insulin receptor phosphorylation in skeletal muscle membranes of db/db mice: the use of a novel skeletal muscle plasma membrane preparation to compare insulin binding and stimulation of receptor phosphorylation. Biochem. Biophys. Res. Commun. 137, 286–294 [DOI] [PubMed] [Google Scholar]
- 42. Eldar-Finkelman H., Krebs E. G. (1997) Phosphorylation of insulin receptor substrate 1 by glycogen synthase kinase 3 impairs insulin action. Proc. Natl. Acad. Sci. U.S.A. 94, 9660–9664 [DOI] [PMC free article] [PubMed] [Google Scholar]
- 43. Chou C. T., He S., Jan C. R. (2007) Paroxetine-induced apoptosis in human osteosarcoma cells: activation of p38 MAP kinase and caspase-3 pathways without involvement of [Ca2+]i elevation. Toxicol. Appl. Pharmacol. 218, 265–273 [DOI] [PubMed] [Google Scholar]
- 44. Paz K., Hemi R., LeRoith D., Karasik A., Elhanany E., Kanety H., Zick Y. (1997) A molecular basis for insulin resistance. Elevated serine/threonine phosphorylation of IRS-1 and IRS-2 inhibits their binding to the juxtamembrane region of the insulin receptor and impairs their ability to undergo insulin-induced tyrosine phosphorylation. J. Biol. Chem. 272, 29911–29918 [DOI] [PubMed] [Google Scholar]
- 45. Mothe I., Van Obberghen E. (1996) Phosphorylation of insulin receptor substrate-1 on multiple serine residues, 612, 632, 662, and 731, modulates insulin action. J. Biol. Chem. 271, 11222–11227 [DOI] [PubMed] [Google Scholar]
- 46. Tirosh A., Potashnik R., Bashan N., Rudich A. (1999) Oxidative stress disrupts insulin-induced cellular redistribution of insulin receptor substrate-1 and phosphatidylinositol 3-kinase in 3T3-L1 adipocytes. A putative cellular mechanism for impaired protein kinase B activation and GLUT4 translocation. J. Biol. Chem. 274, 10595–10602 [DOI] [PubMed] [Google Scholar]
- 47. Pederson T. M., Kramer D. L., Rondinone C. M. (2001) Serine/threonine phosphorylation of IRS-1 triggers its degradation: possible regulation by tyrosine phosphorylation. Diabetes 50, 24–31 [DOI] [PubMed] [Google Scholar]
- 48. Boura-Halfon S., Shuster-Meiseles T., Beck A., Petrovich K., Gurevitch D., Ronen D., Zick Y. (2010) A novel domain mediates insulin-induced proteasomal degradation of insulin receptor substrate 1 (IRS-1). Mol. Endocrinol. 24, 2179–2192 [DOI] [PMC free article] [PubMed] [Google Scholar]
- 49. Leibiger I. B., Leibiger B., Moede T., Berggren P. O. (1998) Exocytosis of insulin promotes insulin gene transcription via the insulin receptor/PI-3 kinase/p70 s6 kinase and CaM kinase pathways. Mol. Cell 1, 933–938 [DOI] [PubMed] [Google Scholar]
- 50. Nakae J., Biggs W. H., 3rd, Kitamura T., Cavenee W. K., Wright C. V., Arden K. C., Accili D. (2002) Regulation of insulin action and pancreatic beta-cell function by mutated alleles of the gene encoding forkhead transcription factor Foxo1. Nat. Genet. 32, 245–253 [DOI] [PubMed] [Google Scholar]
- 51. Kitamura T., Nakae J., Kitamura Y., Kido Y., Biggs W. H., 3rd, Wright C. V., White M. F., Arden K. C., Accili D. (2002) The forkhead transcription factor Foxo1 links insulin signaling to Pdx1 regulation of pancreatic beta cell growth. J. Clin. Invest. 110, 1839–1847 [DOI] [PMC free article] [PubMed] [Google Scholar]
- 52. Peers B., Leonard J., Sharma S., Teitelman G., Montminy M. R. (1994) Insulin expression in pancreatic islet cells relies on cooperative interactions between the helix loop helix factor E47 and the homeobox factor STF-1. Mol. Endocrinol. 8, 1798–1806 [DOI] [PubMed] [Google Scholar]
- 53. Yasuda K., Yamada Y., Inagaki N., Yano H., Okamoto Y., Tsuji K., Fukumoto H., Imura H., Seino S., Seino Y. (1992) Expression of GLUT1 and GLUT2 glucose transporter isoforms in rat islets of Langerhans and their regulation by glucose. Diabetes 41, 76–81 [DOI] [PubMed] [Google Scholar]
- 54. Brissova M., Shiota M., Nicholson W. E., Gannon M., Knobel S. M., Piston D. W., Wright C. V., Powers A. C. (2002) Reduction in pancreatic transcription factor PDX-1 impairs glucose-stimulated insulin secretion. J. Biol. Chem. 277, 11225–11232 [DOI] [PubMed] [Google Scholar]
- 55. Song B., Scheuner D., Ron D., Pennathur S., Kaufman R. J. (2008) Chop deletion reduces oxidative stress, improves beta cell function, and promotes cell survival in multiple mouse models of diabetes. J. Clin. Invest. 118, 3378–3389 [DOI] [PMC free article] [PubMed] [Google Scholar]
- 56. Ungvari Z., Pacher P., Koller A. (2000) Serotonin reuptake inhibitor fluoxetine decreases arteriolar myogenic tone by reducing smooth muscle [Ca2+]i. J. Cardiovasc. Pharmacol. 35, 849–854 [DOI] [PubMed] [Google Scholar]
- 57. Antoine M. H., Gall D., Schiffmann S. N., Lebrun P. (2004) Tricyclic antidepressant imipramine reduces the insulin secretory rate in islet cells of Wistar albino rats through a calcium antagonistic action. Diabetologia 47, 909–916 [DOI] [PubMed] [Google Scholar]
- 58. García-Colunga J., Awad J. N., Miledi R. (1997) Blockage of muscle and neuronal nicotinic acetylcholine receptors by fluoxetine (Prozac). Proc. Natl. Acad. Sci. U.S.A. 94, 2041–2044 [DOI] [PMC free article] [PubMed] [Google Scholar]
- 59. Pancrazio J. J., Kamatchi G. L., Roscoe A. K., Lynch C., 3rd (1998) Inhibition of neuronal Na+ channels by antidepressant drugs. J. Pharmacol. Exp. Ther. 284, 208–214 [PubMed] [Google Scholar]
- 60. Stanton T., Bolden-Watson C., Cusack B., Richelson E. (1993) Antagonism of the five cloned human muscarinic cholinergic receptors expressed in CHO-K1 cells by antidepressants and antihistaminics. Biochem. Pharmacol. 45, 2352–2354 [DOI] [PubMed] [Google Scholar]
- 61. Pariante C. M., Makoff A., Lovestone S., Feroli S., Heyden A., Miller A. H., Kerwin R. W. (2001) Antidepressants enhance glucocorticoid receptor function in vitro by modulating the membrane steroid transporters. Br. J. Pharmacol. 134, 1335–1343 [DOI] [PMC free article] [PubMed] [Google Scholar]
- 62. Preksorn S. H. (1997) Clinically relevant pharmacology of selective serotonin reuptake inhibitors. An overview with emphasis on pharmacokinetics and effects on oxidative drug metabolism. Clin. Pharmacokinet. 32, 1–21 [DOI] [PubMed] [Google Scholar]
- 63. Karson C. N., Newton J. E., Livingston R., Jolly J. B., Cooper T. B., Sprigg J., Komoroski R. A. (1993) Human brain fluoxetine concentrations. J. Neuropsychiatry Clin. Neurosci. 5, 322–329 [DOI] [PubMed] [Google Scholar]
- 64. Altamura A. C., Moro A. R., Percudani M. (1994) Clinical pharmacokinetics of fluoxetine. Clin. Pharmacokinet. 26, 201–214 [DOI] [PubMed] [Google Scholar]
- 65. Yoshimura R., Umene-Nakano W., Ueda N., Ikenouchi-Sugita A., Hori H., Nakamura J. (2008) Addition of risperidone to sertraline improves sertraline-resistant refractory depression without influencing plasma concentrations of sertraline and desmethylsertraline. Hum. Psychopharmacol. 23, 707–713 [DOI] [PubMed] [Google Scholar]
- 66. Lundmark J., Scheel Thomsen I., Fjord-Larsen T., Manniche P. M., Mengel H., Møller-Nielsen E. M., Pauser H., Wålinder J. (1989) Paroxetine: pharmacokinetic and antidepressant effect in the elderly. Acta Psychiatr. Scand. Suppl. 350, 76–80 [DOI] [PubMed] [Google Scholar]
Associated Data
This section collects any data citations, data availability statements, or supplementary materials included in this article.