Abstract
Formation of the ternary complex between GTP-bound form of elongation factor Tu (EF-Tu) and aminoacylated transfer RNA (aa-tRNA) is a key event in protein biosynthesis. Here we show that fluorescently modified Escherichia coli EF-Tu carrying three mutations, C137A, C255V and E348C, and fluorescently modified Phe-tRNAPhe form functionally active ternary complex that has properties similar to those of the naturally occurring (unmodified) complex. Similarities include the binding and binding rate constants, behavior in gel retardation assay, as well as activities in tRNA protection and in vitro translation assays. Proper labeling of EF-Tu was demonstrated in MALDI mass spectroscopy experiments. To generate the mutant EF-Tu, a series of genetic constructions were performed. Two native cysteine residues in the wild-type EF-Tu at positions 137 and 255 were replaced by Ala and Val, respectively, and an additional cysteine was introduced either in position 324 or 348. The assembly FRET assay showed a 5- to 7-fold increase of Cy5-labeled EF-Tu E348C mutant fluorescence upon formation of ternary complex with charged tRNAPhe(Cy3-labeled) when the complex was excited at 532 nm and monitored at 665 nm. In a control experiment, we did not observe FRET using uncharged tRNAPhe(Cy3), nor with wild-type EF-Tu preparation that was allowed to react with Cy5 maleimide, nor in the absence of GTP. The results obtained demonstrate that the EF-Tu:tRNA FRET system described can be used for investigations of ribosomal translation in many types of experiments.
Keywords: elongation factor Tu, transfer RNA, fluorescence resonance energy transfer, ternary complex
Introduction
Elongation factor Tu (EF-Tu), an important component of the translation apparatus, represents up to 5% of total protein in the bacterial cell and has been the subject of intensive structural studies (Kavaliauskas et al., 2012). Escherichia coli EF-Tu is a 393-amino acid guanine nucleotide-binding protein organized as a three domain structure which undergoes distinct conformational changes upon formation of active (GTP-bound) or inactive (GDP-bound) states (Berchtold et al., 1993). The active form of EF-Tu is part of a ternary complex (EF-Tu:GTP:aa-tRNA), which brings aminoacyl-tRNA to the A site of ribosome during translation (reviewed by Schmeing and Ramakrishnan, 2009). Upon codon-anticodon recognition, the EF-Tu conformation changes, leading to GTP hydrolysis, dissociation of the GDP-bound inactive form from the ribosome, combined with the delivery of the cognate aa-tRNA into the A site. Importantly, GTPase activity of EF-Tu itself is 107-fold lower without the presence of a codon-programed ribosome (Pape et al., 1998). Nucleotide exchange factor EF-Ts forms a complex with GDP-bound EF-Tu for regeneration of the active GTP form (Miller and Weissbach, 1974; Gromadski et al., 2002) capable again of binding aa-tRNA with high affinity and forming ternary complex for delivery of the next amino acid into the growing polypeptide chain.
Single-molecule techniques are among the most powerful modern tools for investigation of the translation machinery in real time (Mandecki et al., 2008; Marshall et al., 2008). Progress in using smFRET (single molecule fluorescent resonance energy transfer) depends on many factors, including instrumentation setup, immobilization chemistry as well as successful labeling of target, i.e., biologically active macromolecules with appropriate fluorophores. Currently successful smFRET studies include chemical modification with fluorescent dyes of tRNA molecules (tRNAPhe, tRNAfMet, tRNAArg, tRNALys) and ribosomal protein L11 (Uemura et al., 2010; Bharill et al., 2011; Chen et al., 2011), but so far no reports were made for elongation factor Tu. Recently in our lab, 10 EF-Tu mutants were generated for the purpose of using them in FRET studies, including possible application for collecting sequence data directly from mRNA transcripts using codon-programed ribosomes (Perla-Kajan et al., 2010). Properties of these mutants were carefully investigated for functional stability in different types of assays, and three of them, K324C, G325C and E348C, were chosen for further studies. In all the above-mentioned mutants, the native cysteine residues at positions C81, C137 and C255 were replaced by serine (S), alanine (A) and valine (V) residues, respectively, so this series of mutants was named EF-TuSAV (SAV background). Unfortunately, derivatives of EF-TuSAV showed diminished activity in protein synthesis and related assays. This can be understood in light of recent (De Laurentiis et al., 2011; C. Knudsen, unpublished) and previous data (Miller et al., 1971; Arai et al., 1974) that showed the importance of cysteine 81 for aminoacyl-tRNA binding. In this study, we moved the K324C, G325C and E348C mutations into an AV background, where the native cysteine residue was retained at position 81 while the other two cysteine residues were replaced by Ala and Val, respectively. These mutants were fluorescently labeled and tested in a number of functional assays, including FRET studies, using commercially available or recombinant E. coli EF-Tu as a control. Our results demonstrate that E348C mutant with AV background is an excellent candidate for future smFRET studies.
Materials and reagents
Wild-type E. coli elongation factor Tu was from tRNA Probes LLC (USA). Construction of recombinant His-tagged EF-Tu was done according to methods previously described (Perla-Kajan et al., 2010). E. coli tRNAPhe was purchased from Chemical Block (Moscow, Russia). The phenylalanine acceptor activity of tRNA was approximately 1000 pmol/A260 unit. Synthetic peptide HYAHVDCPGHADYVK, corresponding EF-Tu sequence 75–89 was from GenScript, Inc. (USA). Cy3 N-hydroxysuccinimide ester (NHS) ester was from GE Healthcare or from Primetech LTD (Minsk, Belarus), Cy5 maleimide was from GE Healthcare. Sodium citrate-saturated phenol (pH 4.3), ammonium acetate, ammonium chloride, magnesium acetate, magnesium chloride, potassium chloride, sodium bicarbonate, DTT, ATP, GDP, GTP, GDPNP, TCEP, l-phenylalanine were from Sigma. l-[14C] phenylalanine (476 mCi/mmol) was from PerkinElmer (Boston, MA).
Methods
Protein and ribosome preparation
Recombinant his-tagged E. coli EF-Tu and phenylalanine tRNA synthetase (PheRS) were expressed in E. coli BL-21 and XL-Blue strains, respectively, and purified on Ni-NTA columns as described earlier (Perla-Kajan et al., 2010) with minor modifications. In some cases, protein after Ni-NTA column was additionally purified by anion exchange chromatography on DEAE Toypearl 650 M. E. coli extracts and 70s ribosomes were prepared as previously described (Goldman and Lodish, 1972; Goldman and Hatfield, 1979).
Labeling of tRNAPhe
The labeling reaction was as described (Plumbridge et al., 1980; Blechschmidt et al., 1994; Fei et al., 2008) with minor modifications, and typically was carried out in a 100-µl volume by incubating up to 18 nM (4.54 mg/ml) of tRNAPhe with 0.52 µM (4 mg/ml) of Cy3 NHS ester in 0.1 M sodium bicarbonate buffer, pH 8.3, at room temperature for 5 h, followed by an overnight incubation at 4°C. The reaction was stopped by addition of 1/10 volume of 3 M NaOAc, pH 5.5. An equal volume of sodium citrate-saturated phenol (pH 4.3) was added to the sample and the contents of the test tube were mixed thoroughly. The organic and aqueous phases were separated by centrifuging briefly at 18 000 g. Phenol extraction was repeated five times until the unreacted Cy3 dye was no longer seen in the organic phase. The aqueous phase was transferred to a new tube and extracted twice with chloroform. tRNA was precipitated by adding three volumes of ethanol, which was followed by an overnight at −20°C (or 40 min at −80°C). After centrifugation at 18 000 g for 20 min, the pellet was washed twice with 70% ethanol, briefly dried under vacuum, and dissolved in 50 µl of sterile water.
Aminoacylation of tRNA
The aminoacylation reaction was as described previously (Walker and Fredrick, 2008; Perla-Kajan et al., 2010) and carried out in 80 mM HEPES (pH 7.5), 8 mM MgCl2, 24 mM KCl, 2 mM ATP, containing 100 µM [14C]Phe (487 mCi/mmol) or ‘cold’ Phe, 10 µM tRNAPhe(Cy3) and 7 µg/ml of recombinant Phe-tRNA synthetase. After 30 min of incubation at 37°C, the reaction mix was extracted once with phenol, twice with chloroform, and ethanol precipitated. The dried pellet was dissolved in sterile water. The preparation was stored at −80°C.
Reverse phase high-performance liquid chromatography
The RP high-performance liquid chromatography (HPLC) C4 Delta Pack column (3.9 × 300 mm, 15 µM, 300 Å, Waters Corp., Japan) was used to separate the labeled tRNAs. The purification protocol was optimized for Beckman Coulter HPLC system. Buffer A contained 20 mM NH4OAc (pH 5.2), 10 mM MgOAc, 0.4 M NaCl, 3 mM NaN3, and Buffer B had the same composition but was supplemented with 60% methanol (no sodium azide). The column was equilibrated for 20 min with Buffer A. Sample volume was 50 μl and contained up to 30 A260 units of tRNAPhe. The gradient 0–50% of Buffer B (run time 0–30 min) followed by 50–100% of Buffer A (run time 30–42) min at flow rate of 0.5 ml/min was used for separation. Products were monitored at 260 nm for tRNA and 550 nm for the Cy3 dye and also by scintillation counting. After each purification cycle, the column was washed first with 10 column volumes of 100% Buffer B and then with 50% Buffer B.
Fractions of interest were precipitated by isopropyl alcohol; the pellet was washed by 70% ethanol and dissolved in sterile water or 2 mM MgOAc, pH 5.2 and stored at −80°C.
UV/Vis spectroscopy
UV/Vis spectra of labeled tRNAPhe and EF-Tu samples were monitored on Varian Cary 50 Bio and Nanodrop ND-1000 spectrophotometers using molar extinction coefficients ε260nm = 733 000 M−1 cm−1 for E. coli tRNAPhe; ε550nm = 150 000/M/cm−1 for Cy3 NHS ester and ε650nm = 250 000/M/cm for Cy5 maleimide.
Thin-layer chromatography
The analysis was done on silica gel F in a MeOH:CHCl3:H20 (2 : 1:1) mix. Products were analyzed under visible and UV light and by Phosphorimager Typhoon 9410.
Purification of mutants
All mutants were purified to at least 95% purity using a slightly modified protocol of Perla-Kajan et al. (2010) on Ni-NTA column. In some cases, to obtain more than 98% purity, an additional purification step on Toyopearl DEAE-650 was applied. Partially purified EF-Tu (10 mg/ml stock) after the first step of Ni-NTA chromatography was diluted 1/10 in the running buffer (RB) (20 mM HEPES pH 7.7, 10 mM MgCl2, 10 μM GDP) and applied on the DEAE 650 M column (1 × 25 cm). A gradient of 0.05–0.8 M NaCl in RB was used for the separation at a speed of 20 ml/h. EF-Tu eluted at the 0.4–0.5 M salt concentration.
Fluorescence labeling of elongation factor Tu
Up to 50 nM of EF-Tu in 500-µl volume in labeling buffer, containing 50 mM HEPES pH 7.0, 30 mM KCl, 70 mM NH4Cl and 7 mM MgCl2 (buffer was carefully degassed before reaction) were incubated with 10 molar excess of TCEP (tris(2-carboxyethyl)phosphine) for 10 min at room temperature. The dye (Cy5 or QSY9 maleimide) was added from dimethylformamide stock in 10–15 molar excess, and incubated in dark under nitrogen at 25°C for 2 h or overnight at 4°C. Unreacted dye was separated from labeled EF-Tu on a Sephadex G-15 column (manually packed Bio-Rad column 0.5 × 15 cm). Fractions containing protein were concentrated on a Millipore 10 K centrifuge filter or by dialysis on Spectrapor 8 K membrane against same buffer containing 50% glycerol or 40% PEG 40000 and stored at −20°C in 50% glycerol.
Reversed Phase Liquid Chromatography Mass Spectrometry analysis (RPLC-MS)
The Cy5-EF-Tu E348C sample, or unlabeled protein as a control, was diluted in 100 mM NH4HCO3. Protein digestion was initiated by adding trypsin and incubated at 37°C. Resulting peptides were desalted using C18 Ziptip and further separated by reversed phase liquid chromatography (RPLC) on an Ultimate 3000 LC system (Dionex, Sunnyvale, CA, USA) coupled with an LTQ Orbitrap Velos mass spectrometer (Thermo Scientific). The eluted peptides were directly introduced into the Orbitrap via a Proxeon nano electrospray ionization source with a spray voltage of 2 kV and a capillary temperature of 275 °C. The LTQ Orbitrap Velos was operated in the data-dependent mode with survey scans acquired at a resolution of 60 000 at m/z 400 (transient time = 256 ms). Top 10 most abundant isotope patterns with charge ≥2 from the survey scan were selected and further fragmented in CID mode.
Data analysis
The tandem mass spectrometry (MS/MS) spectra from liquid chromatography-tandem mass spectrometry (LCMS-MS) analyses were searched against EF-Tu sequence using Mascot (Ver. 2.3) through the Proteome Discoverer (V. 1.3, Thermo Scientific). Following search parameters were used: Cy5 (778.2837 Da) labeling of cysteine and oxidation of methionine as variable modifications; trypsin as the digestive enzyme with a maximum of two missed cleavages allowed; monoisotopic peptide precursor ion tolerance of 10 ppm; and MS/MS mass tolerance of 0.5 Da.
Relative quantitation
Raw LCMS-MS files from LTQ Orbitrap Velos mass spectrometer were processed in Quant browser module of Xcalibur software. Extracted ion chromatograms were generated from the MS full-scans. Following parameters were used: m/z for C81_Cy (830.6873), m/z for C348_Cy (1100.1668), mass tolerance 5 ppm, smoothing enabled (type Gaussian). Relative quantitation was performed using peak areas extraction from the extracted ion chromatogram of the selected precursor ions.
Non-enzymatic hydrolysis protection assay
The assay of Cy3-labeled Phe-tRNAPhe in ternary complex with EF-TU and GTP was performed and evaluated as previously described (Pingoud and Urbanke, 1979).
Translation in vitro
The assay of Phe-tRNAPhe(Cy3) activity in poly(Phe) synthesis was performed as described (Perla-Kajan et al., 2010).
Fluorescence gel retardation assay
Incubation buffer included 70 mM HEPES-KOH (pH 7.6), 52 mM NH4OAc, 8 mM Mg Cl2, 30 mM KCl, 1.4 mM DTT, 0.1 mM GTP, 2.6% glycerol, 7.2 mM phosphoenolpyruvate and 2.5 U/ml pyruvate kinase. HPLC purified [14C]Phe-tRNAPhe(Cy3) [40 µM] (44 cpm/µl), dye ratio 1, was used for [1 µM] tRNA master mix. Concentration of EF-Tu preparations was varied from 1 to 12 µM in a 10 µl volume. Upon addition of EF-Tu, the reaction mix was incubated 15 min at 37°C and loaded using 10× loading buffer (50% glycerol with 0.02% bromophenol blue) on 10% polyacrylamide gel electrophoresis in a running buffer (10 mM MES pH 6.0, 65 mM NH4OAc, 10 mM Mg(OAc)2 and 10 μM GTP). The gel was run at 4°C, ≤125V (≤40 mA for a mini gel). After the run, the gel was immediately scanned for Cy3 and Cy5 fluorescence by Typhoon 9410 using green (532 nm) or red (633 nm) lasers setup correspondingly. To monitor by autoradiography, dried gels were placed in a phosphorimager cassette or over X-ray film and left overnight.
FRET assay (assembly fluorescence)
FRET measurements were done using Photon Technology International fluorescence spectrofluorometer with FeliX software. Cy3 fluorescence was monitored in the spectrum or time base mode at excitation/emission 549/565 nm. FRET upon formation of ternary complex was monitored in the time-base mode using the 532-nm excitation (Cy3 dye) and 665-nm emission (suitable for the Cy5 dye). The slot parameters and photomultiplier voltage were adjusted to get a response in the range of 0.5–1.2 × 10⁶ RFU for the Cy3 fluorescence scan at the 20–30 nM Phe-tRNAPhe(Cy3) concentration and 4–5 × 10⁴ RFU for Cy5 fluorescence scan (excitation/emission 633/665 nm) at the 300–400 nM Cy5-EF-Tu concentration. The titration of Phe-tRNAPhe(Cy3) by Cy5-EF-Tu was typically done in presence of 100 µM GTP in a 150 μl volume of the same incubation buffer as used in the above mentioned gel retardation assay. During the assay (up to 120 min), the reaction mix also was supplemented with 1 mM ATP and 5 µg/ml of Phe-tRNA synthetase to prevent deacylation of Phe-tRNAPhe(Cy3). The concentration of Phe-tRNAPhe(Cy3) was up to 30 nM and GTP:Cy5-EF-Tu was varied in range of 30–240 nM.
Results
Strategy and construction of EF-Tu mutants
As shown previously, the mutants in the SAV background showed higher deacylation rate constants in non-enzymatic hydrolysis protection assays, meaning that protection against deacylation of Phe-tRNAPhe was reduced (Perla-Kajan et al., 2010). We suspected that the reason for this was due to the replacement of the cysteines present in wild-type EF-Tu (C81, C137 and C255) with the Ser, Ala or Val residues, respectively, in this SAV construct. Therefore, a series of mutants was prepared in which one or more cysteines were reverted to the wild-type sequence.
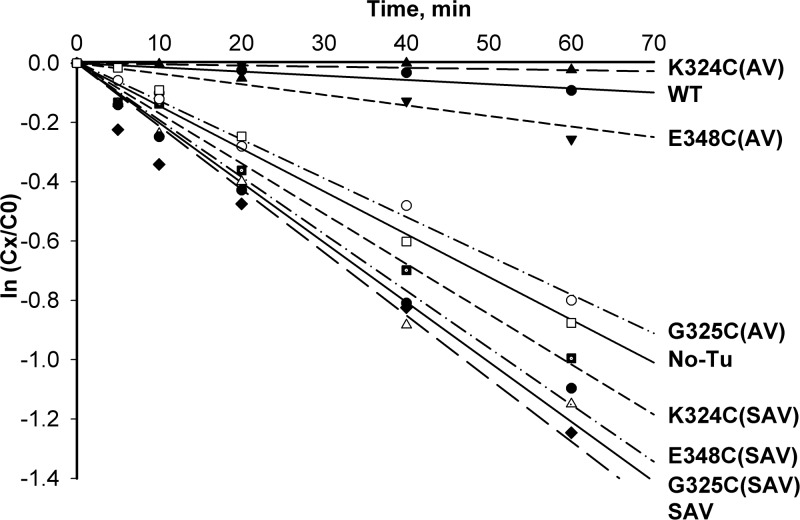
Our previous strategy for labeling of individual thiols in the EF-Tu molecule was based on eliminating of all three cysteines present in the native protein and introducing an additional cysteine residue based on the available crystal structures of EF-Tu:tRNA complexes and published functional and structural studies of EF-Tu. Also, a very short distance was demanded between the donor and acceptor fluorophores located on EF-Tu and tRNA molecules. Correspondingly, we previously generated EF-Tu mutants that contained single cysteine residues at 324, 325 or 348 positions in the SAV background (Perla-Kajan et al., 2010). Despite good yield and labeling efficiency, the mutants in the SAV background showed lower binding capability to tRNAPhe and activity in in vitro translation assays (data not shown), as well as lower ability to protect Phe-tRNAPhe in non-enzymatic hydrolysis protection assay (Fig. 1).
Fig. 1.
Functional assays of mutant EF-Tu proteins. Non-enzymatic hydrolysis of Phe-tRNAPhe in the presence of Escherichia coli wild type or mutant EF-Tu proteins. Each reaction contained 2.5 µM EF-Tu and 0.5 µM [14C] Phe-tRNAPhe.
The principle of the assay is based on the fact that correctly formed complex between EF-Tu:GTP and aa-tRNA protects aa-tRNA from non-enzymatic deacylation. In our experiments, a radiolabeled [14C]Phe tRNAPhe(Cy3) or [14C]Phe-tRNAPhe and the wild-type E. coli elongation factor Tu were used. [14C]Phe-tRNAPhe(Cy3) showed a similar behavior in non-enzymatic hydrolysis protection assay when compared with [14C]Phe-tRNAPhe.
To improve on the in vitro translation activity and ternary complex assembly, we moved the K324C, G325C and E348C mutations into the AV background (where the native cysteine residue was retained at position 81).
When choosing this strategy, we hypothesized that as C81 is a buried residue in EF-Tu (because of the known ternary complex structure of E. coli EF-Tu:GDPNP:kirromycin:Phe-tRNAPhe complex based on a PDB file 1ob2.pdb; Nielsen et al., in preparation), the residue's reactivity for the incoming maleimide group should be much lower then the reactivity of the solvent-exposed second cysteine residue in the mutant EF-Tu at position 348 or 324. Thus, preferential labeling of the secondary cysteine residue should be feasible.
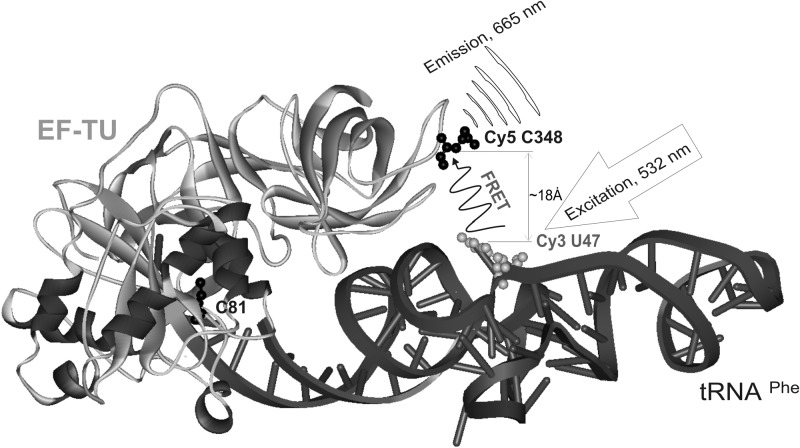
We ascertained that the calculated distance in formed ternary complex between Cy3 labeled 3-(3-amino-3-carboxypropyl)uridine (acp3U) at position 47 of tRNAPhe and Cy5-labeled cysteine at position 348 (or 324) of EF-Tu is sufficiently shorter than the Foster radius (56 Å) reported by the manufacturer (Amersham Biosciences) for the Cy5:Cy3 interaction (Fig. 2).The K324C and E348C EF-TuAV mutant proteins were not only active in in vitro translation, but also protected by Phe-tRNAPhe against non-enzymatic hydrolysis compared with wild type (Fig. 1). The same two mutants, but in the wild-type background, behave very close to wild-type EF-Tu (data not shown). Therefore, the K324C (AV) and E348C (AV) mutants were chosen for further studies, involving labeling with fluorophores followed by subsequent characterization of these mutant proteins in FRET assays.
Fig. 2.
Structure of the ternary complex. The sites chosen for labeling of the recombinant Escherichia coli EF-Tu mutants and tRNAPhe with Cy5 and Cy3, respectively, are shown. A cysteine residue was introduced at position 348 in EF-Tu. The distance between the Cy5-labeled cysteine residue and Cy3-labeled U47 on tRNAPhe is indicated. The coordinates for the E. coli EF-Tu:GDPNP:kirromycin:Phe-tRNAPhe ternary complex at 3.3 Å resolution are from the 1ob2 PDB file (Kavaliauskas et al., 2012). WebLab ViewerPro software was used to create the image.
Fluorescence labeling of tRNA
Isolation of Cy3-labeled tRNAPhe
Current methods for chemical modification of tRNA molecules with fluorescent dyes are based on presence in certain tRNAs at their elbow positions of high reactive unusual nucleotides, such as 4-thiouridine (s4U) at position 8 or 3-(3-amino-3-carboxypropyl)uridine (acp3U) at position 47. Such nucleotides can be modified with maleimide or NHS-linked fluorophores (Plumbridge et al., 1980; Janiak et al., 1990; Blechschmidt et al., 1994; Blanchard et al., 2004). After the labeling reaction is completed, excess dye can be removed by phenol extraction and ethanol precipitation, or by using gel filtration, or by a dialysis step (Walker and Fredrick, 2008), followed by separation of labeled from unlabeled tRNA using RP HPLC. This chromatography is effective because the hydrophobicity of tRNA molecules after conjugation with a dye is often changed. Charging of the labeled tRNA molecule with cognate amino acid by cognate aa-tRNA synthetase is the next important step, followed by subsequent purification of charged and fluorescently labeled product. Achieving a high (close to 100%) labeling and aminoacylation rate is difficult, thus column chromatography is often essential to concentrate the desired forms. In most cases, the final purification step for labeled and aminoacylated tRNA also includes RP HPLC. The difference in retention time between charged and uncharged product is critical to isolate high-purity labeled and aminoacylated tRNA.
Standard methods for purifying fluorescently labeled tRNAPhe (Kothe et al., 2006; Pan et al., 2009) are based on using phenyl-conjugated or C18 (octadecyl group) stationary phase columns. The reported conditions did not allow for baseline separation of key components, which is needed to obtain highly purified reagents. While good separation between dye-conjugated and non-modified tRNA was obtained, the difference in retention time after/before aminoacylation needed to be increased. The HPLC procedure presented here employs a different type of reverse phase column (Waters C4 Delta Pack). Short butyl groups on C4 RP HPLC column do not have so strong reversed phase retention compared with phenyl or octadecyl groups, allowing better separation of more hydrophobic dye-conjugated tRNAs. C4 stationary phase combined with high ionic strength in mobile phase shows increased difference in the retention time between Phe-tRNAPhe(Cy3) and tRNAPhe(Cy3) up to base line resolution. In addition, we developed different chromatographic conditions, as described in the Methods section. The new method allows for purification of modified tRNAs in one chromatographic step in semi-preparative (mg) amounts using analytical size column.
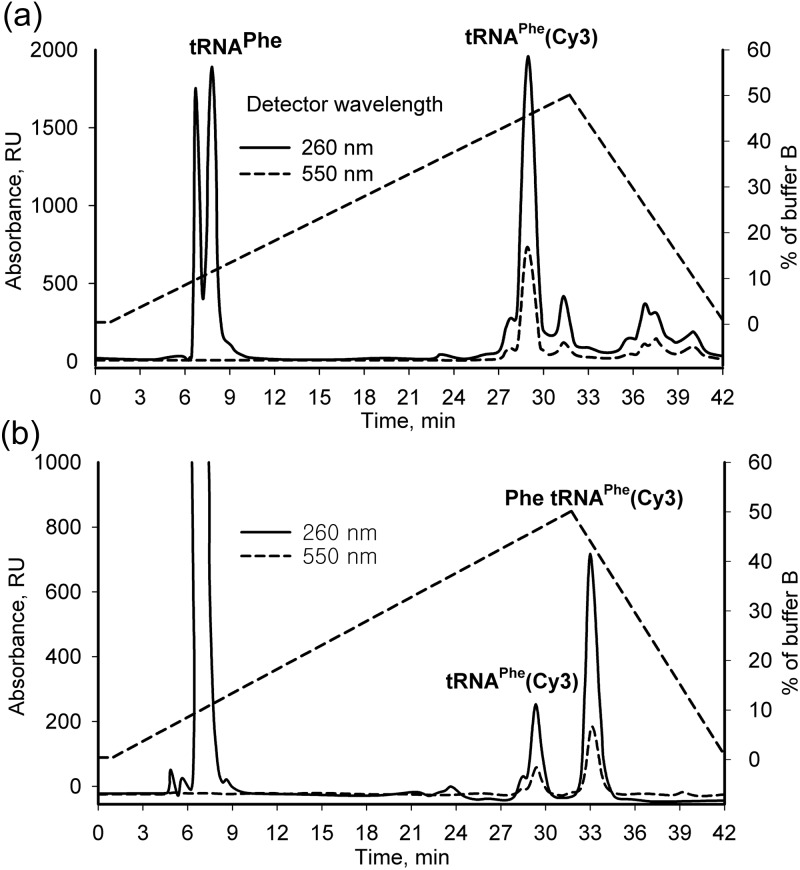
After the labeling reaction, Cy3-labeled tRNAPhe was purified from unmodified RNA and from free dye by RP HPLC. The unmodified E. coli tRNAPhe eluted in the void column volume (4 ml). The conjugation with Cy3 dye increased tRNA retention time on the column by about 20 min. Traces of free dye were efficiently removed in this step, as the Cy3 NHS ester eluted at the end of gradient and retention time was about 39 min (Fig. 3a and b). The purified Phe-tRNAPhe(Cy3) had a dye/tRNA ratio of 1–1.2 by UV/Vis spectrophotometry and was stored in 100 µM aliquots before the aminoacylation reaction was performed.
Fig. 3.
Purification of tRNA: reverse phase HPLC on the C4 Delta Pack column. The dashed lines represent an optimized buffer B gradient, with the % buffer B indicated by the scale on the right axis. (a) Separation of tRNAPhe and tRNAPhe(Cy3). After the labeling reaction, the pool of tRNAPhe (4.75 A260 units) was resolved using the conditions described in Materials and Methods. (b) Isolation of aminoacylated Cy3-labeled tRNAPhe. The phenol-extracted and ethanol-precipitated aliquot of 5 A260 units of E. coli tRNAPhe(Cy3) after aminoacylation reaction with 14C Phe was applied to the C4 Delta Pack column. The retention time was 33 and 28 min for charged Phe-tRNAPhe(Cy3) and uncharged tRNAPhe(Cy3), respectively. Fractions containing tRNAPhe(Cy3) and [14C ]Phe-tRNAPhe(Cy3) were collected and ethanol-precipitated. A large peak (>1600 RU A260) at the void volume was observed after the phenol extraction. The peak likely originated from oxidized phenol derivatives.
Purification of aminoacylated Cy3-labeled tRNAPhe
Charging of the Cy3-labeled tRNAPhe was performed at the same conditions as described for E.coli tRNAPhe (Perla-Kajan et al., 2010). Aliquots of purified tRNAPhe(Cy3) were incubated with the recombinant Phe-tRNA synthetase in presence of [14C]Phe or ‘cold’ Phe, ATP and regeneration system. The charging efficiency of the bulk fraction of tRNAPhe(Cy3) was lower when compared with a wild-type tRNAPhe, where percent of incorporation of [14C]Phe was close to 90%. After the phenol extraction and ethanol precipitation, the tRNA was purified in the second round of RP HPLC under the above mentioned conditions. A 5 ± 0.25 min difference in retention times for the charged Phe-tRNAPhe(Cy3) and uncharged tRNAPhe(Cy3) was observed (Fig. 3a and b). The fractions were analyzed by UV/Vis spectroscopy, scintillation counting, thin-layer chromatography (TLC) and gel electrophoresis (data not shown). The analyses showed that the slower migrating peak, corresponding to Phe-tRNAPhe(Cy3), was purified. A covalently bound tRNAPhe(Cy3) dye was detected in two tRNAPhe fractions (at 28 and 33 min) by absorption on 550 nm as well as by TLC and gel electrophoresis, but the [14C] Phe activity was detected only in the late (33 min) fraction which was also confirmed by autoradiography of a gel and TLC plate (data not shown). We did not perform the precipitation of tRNA before the second round of RP HPLC, because the phenol derivatives and an excess of Phe eluted at the void column volume (Table I) which allowed reducing the purification time while increasing the yield. Importantly, the efficiency of aminoacylation of tRNAPhe(Cy3) could be calculated from integrated peak areas and varied from 60 to 75%. Thus, because charging efficiency could be monitored directly by RP HPLC without using 14C Phe, the current RP HPLC conditions were effectively used for preparation of the ‘cold’ charged Phe-tRNAPhe(Cy3).
Table I.
Retention time of separated compounds after labeling and charging of tRNAPhe on RP C4 column (see Materials and Methods for details)
| # | Compound | Retention time (min) |
|---|---|---|
| 1 | tRNAPhe | 8 ± 0.5 |
| 2 | Cy3 NHS ester | 39 ± 1 |
| 3 | tRNAPhe(Cy3) | 28 ± 0.5 |
| 4 | Phe-tRNAPhe(Cy3) | 33 ± 0.5 |
| 5 | Phe-tRNAPhe | 24 ± 1 |
| 6 | Phenylalanine | 9 ± 0.5 |
In vitro translation assay of Phe-tRNAPhe(Cy3) in poly-Phe synthesis
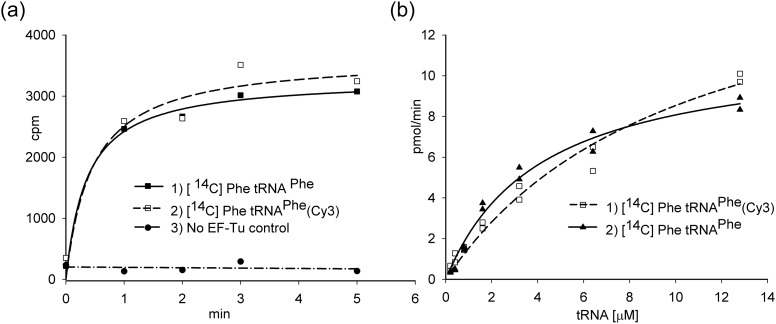
Phe-tRNAPhe(Cy3) and Phe-tRNAPhe are functionally active at a similar level as shown in the experiment in which 14C Phe was incorporated into poly-Phe. The results are shown both as a function of time (Fig. 4a) or the tRNA concentration (Fig. 4b).
Fig. 4.
Poly(Phe) synthesis using Phe-tRNAPhe(Cy3). (a) The reaction mixtures contained 20 mM magnesium acetate, 10 mM potassium phosphate, pH 7.4, 100 mM potassium glutamate, pH 7.7, 95 mM potassium chloride, 10 mM ammonium chloride, 0.5 mM calcium chloride, 1 mM spermidine, 8 mM putrescine, 1 mM DTT, 1 mM ATP, 4.5 mM PEP, 1 mM GTP, 100 µg/ml pyruvate kinase, 2 µM EF-G, 2 μM 70S ribosomes, 60 pmol [14C] Phe-tRNAPhe or [14C] Phe-tRNAPhe(Cy3) and 30 pmol of E. coli EF-Tu. The reaction was carried out at 37°C for 5 min, and then incubated with an equal volume of 0.4 M NaOH at 37°C for 10 min. After hydrolysis of unreacted [14C]Phe-tRNAPhe was completed, the sample was applied onto Whatman filter paper or GF filter, washed in 5% ice cold TCA and in ethanol. The radioactivity in the precipitates was determined by scintillation counting. (b) The reaction was carried out at the same conditions for 1 min in two sets for [14C] Phe-tRNAPhe(Cy3) and [14C] Phe-tRNAPhe. Concentrations of 70S ribosome and EF-Tu were 1 and 30 µM, correspondingly. The concentration of labeled and unlabeled aa-tRNA was in the 0.2–12.8 µM range.
Labeling of EF-Tu with Cy5
Labeling efficiency of EF-Tu with maleimide conjugated fluorophores usually depends on many factors, including quality of protein prep (EF-Tu tends to form aggregates), temperature and presence of free oxygen and reducing agents in labeling buffer. The dye/protein ratio usually increases with highest temperature, but due to instability of protein, we preferred to perform reaction overnight at 4°C or at room temperature for 2 h. The dye/protein ratio in this case is usually less than one (data not shown); however, the protein is active in FRET assays.
Mass spectrometry evidence of labeling of E348C mutant with Cy5 maleimide
The subject of this study, EF-Tu mutant E348C, has two cysteine residues at positions 81 and 348, of which C81 is buried in the structure. Nevertheless, C81 can be chemically modified by N-ethylmaleimide (Arai et al., 1974; Van Noort et al., 1986). The desired outcome of the Cy5 labeling procedure is to conjugate Cy5 to the thiol of C348, and not to modify C81 (the modification of C81 would likely destabilize the EF-Tu structure, and add complexity to the analysis of FRET data). Thus, attention was paid to implementing proper conjugation procedures that would favor labeling of C348, and to the molecular characterization of EF-Tu obtained from the conjugation.
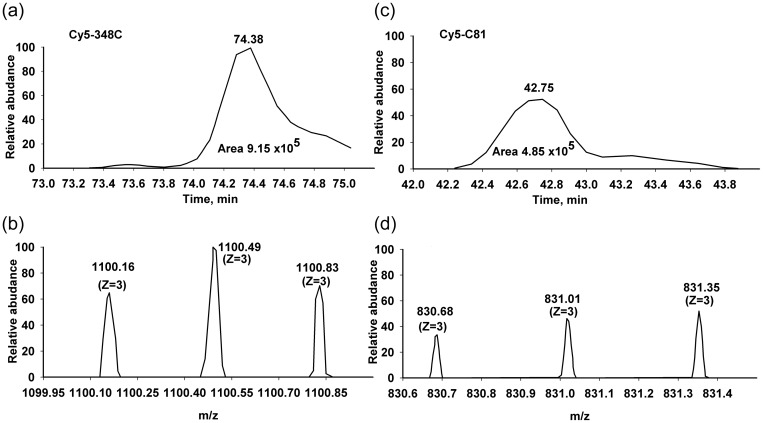
Monoisotopic mass of Cy5 maleimide provided by GE Healthcare is 777.9 Da, which was precisely calculated as 778.2837 Da in our experiments. Peptides carrying C81 (MH+1710.7572 Da, HYAHVDCPGHADYVK), Cy5-C81 (MH+2489.0409 Da), C348 (MH+2519.1957 Da, TTDVTGTIELPEGVCMVMPGDNIK) and Cy5-C348 (MH+ 3297.4794 Da) were identified in two independent measurements with different batches of Cy5-labeled E348C EF-Tu. Based on the integration of the extracted ion chromatogram peaks, we conclude that the Cy5 dye distribution in EF-Tu is 65–70% at C348, and the balance at C81 (Fig. 5). At a higher temperature during the modification reaction, the labeling distribution was more balanced (data not shown). We also performed additional matrix assisted laser desorption ionization mass spectrometry (MALDI MS) control experiments using Cy5-labeled and unlabeled synthetic peptide HYAHVDCPGHADYVK, corresponding to aa 75–89 of E. coli EF-Tu, and the Cy5 dye itself, to calibrate the system (data not shown).
Fig. 5.
LCMS-MS analysis of Cy5 maleimide-labeled EF-Tu (E348C mutant). Extracted ion chromatograms representing Cy5 modified Cys 348 (a), with m/z ratio 1100.1668 (b) and Cy5 modified Cys 81 (c), with m/z ratio 830.6873 (d). On base integration of EIC's peaks, the Cy5 dye distribution in EF-Tu is 65% at C348, and 35% at C81.
Studies of interactions of fluorescently labeled forms of EF-Tu and tRNAPhe
Monitoring of the ternary complex formation in a gel retardation assay
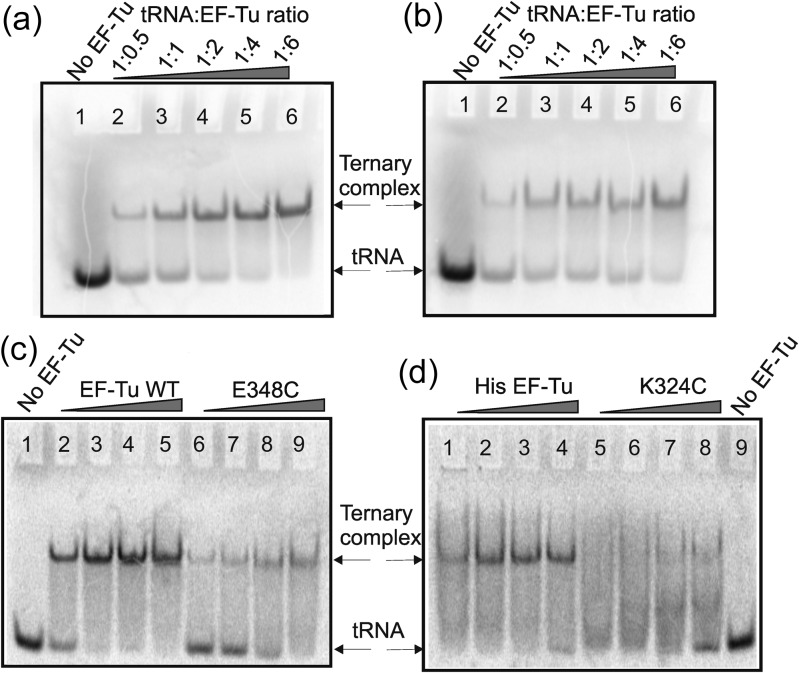
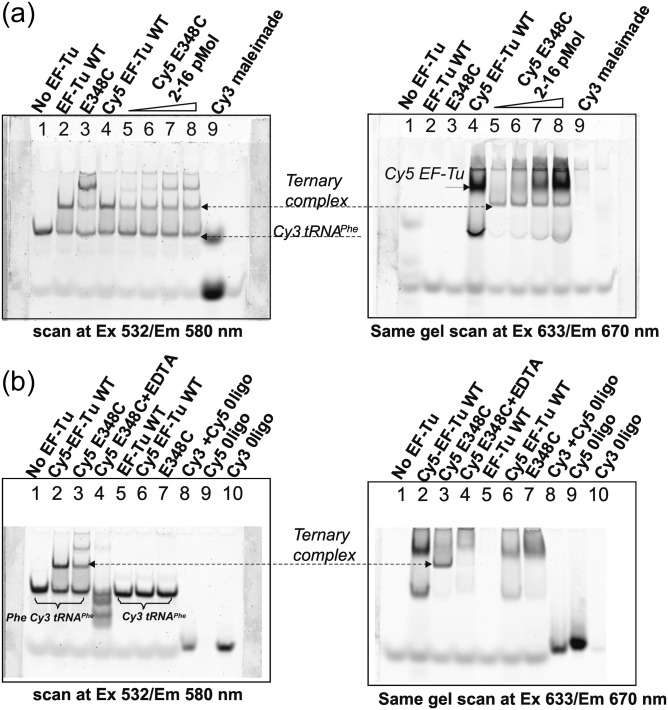
The gel retardation assay was modified from methods described earlier (Abrahams et al., 1988; Doi et al., 2007). Modifications included monitoring ternary complex formation by autoradiography (Fig. 6) as well as by the Cy3 and Cy5 fluorescence scan on a Typhoon 9410 scanner (Fig. 7) which effectively reduced the quantity of reagents needed, shortened the duration of the assay and eliminated experimental artifacts when compared with classical staining procedures. Autoradiography showed that recombinant EF-Tu was able to form ternary complex with labeled or unlabeled tRNAPhe similarly to the native protein purified from E. coli (Fig. 6a and b). The K324C mutant was not as efficient in forming a solid visible band of ternary complex on the gel (Fig. 6c and d), so we decided to use the E348C mutant for further FRET studies.
Fig. 6.
Gel retardation assay: monitoring of ternary complex formation by autoradiography. After electrophoresis, the gels were placed in a phosphorimager cassette and scanned after an overnight exposure. [14C] Phe-tRNAPhe(Cy3) (0.4 µM) was incubated in the presence of GTP and increasing concentrations of native EF-Tu (Panel a), His-tagged recombinant wild-type EF-Tu (Panel b), E348C(AV) mutant (Panel c) or K324C(AV) mutant (Panel d) were run on the gel as described in Materials and Methods. Each line contains 4 pmol of 14C Phe tRNAPhe (except 20 pmol in line 1, panels a, b). The amount of EF-Tu was varied between 0.4–2.8 µM.
Fig. 7.
Gel retardation assay to monitor ternary complex formation. After native gel electrophoresis, two gels were scanned to monitor Cy3 (left) or Cy5 (right) fluorescence. (a) Each line contains 2 pmol of Phe-tRNAPhe(Cy3). Unlabeled EF-Tu WT, E348C mutant or Cy5 EF-Tu WT were added in 8-fold molar excess (lines 2–4). Cy5 EF-Tu E348C concentration was varied in 1–8 molar excess (lines 5–8). Cy3 maleimide dye itself was loaded as a control for Cy3 fluorescence in line 9. The total Cy3 fluorescence intensity of labeled tRNA in the ternary complex with Cy5-EF-Tu E348C was decreased approx 27% (calculation is based on the band intensity in lines 1 and 2 vs. lines 5 and 6). The quenching of Cy3 fluorescence in the complex is close to 60% (calculation is based on the band intensity in lines 2 and 4 vs. lines 5 and 6). Panel b. Phe-tRNAPhe(Cy3) (0.2 µM) was incubated with four-fold molar excess of Cy5 EF-Tu WT or Cy 5 E348C. No ternary complex was observed in presence of EDTA (line 4) as well as in presence of uncharged tRNAPhe(Cy3) (lines 5, 6 and 7). The total Cy3 fluorescence intensity of the labeled tRNA in the ternary complex with Cy5-EF-Tu E348C was decreased approx 24% (calculation is based on the band intensity in line 1 vs. line 3). Quenching of Cy3 fluorescence in the complex is close to 60% – calculation is based on the intensity of the ternary complex band in line 2 (peak 1) and line 3 (peak 4). Approximately 46% of Phe-tRNAPhe(Cy3) was deacylated after the reaction. The band intensity was calculated using the ImageQuant software.
Monitoring of ternary complex formation by fluorescence scanning of the native gel has a lot of advantages, including the possibility of directly seeing labeled molecules or their complexes and a shorter time required for the experiment (Fig. 7). The total Cy3 fluorescence intensity of the labeled tRNA in the ternary complex with Cy5-EF-Tu E348C was decreased by 24–27% (the calculation was based on the integration of the bands in lines 1, 2 vs. lines 5, 6 (panel a) and line 1 vs. line 3 (panel b)). The quenching of Cy3 fluorescence in the complex was close to 60%; the calculation was based on the intensity of the ternary complex itself (compare the ternary complex bands in lines 2, 4 and 5, 6 in panel a, as well as lines 2 and 3 in panel b). Approximately 46% of labeled tRNAPhe was deacylated after the reaction, and migrated as free tRNA in line 1. Quite importantly, no complex formation was observed when uncharged Cy3-labeled tRNAPhe (lines 5, 6 and 7) was used, providing evidence for the assay specificity.
Evidence for FRET between fluorescently labeled EF-Tu and tRNA
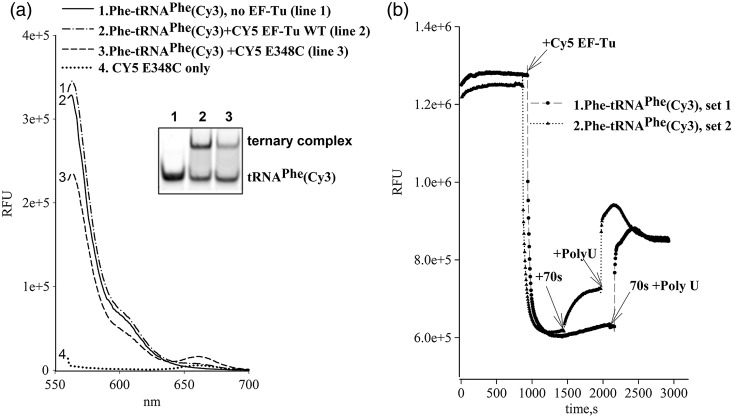
Decrease of Cy3 fluorescence upon forming of ternary complex with GTP Cy5-labeled EF-Tu and aminoacylated tRNA was demonstrated in a series of titration experiments (Fig. 8). Based on the spectrofluorimeter data, the total decrease ternary of Cy3 fluorescence of the Phe-tRNAPhe(Cy3) (563 nm) upon formation of the complex with Cy5 EF-Tu E348C mutant was about 29%. At the same time, Cy5 fluorescence (665 nm) increased 2.8-fold (Fig. 8a). Interestingly, the decrease of Cy3 intensity was also observed directly on a native gel, when we simultaneously monitored the ternary complex formation by gel retardation assay (Fig. 8, inset, intensity of ternary complex line 2 vs. line 3). Native EF-Tu that underwent the Cy5 labeling reaction had no quenching effect on the Cy3 fluorescence. In a control experiment, no FRET was seen in the presence of EDTA, RNAse A or proteinase X (data not shown).
Fig. 8.
Spectral (a) and time-based (b) evidence of FRET upon addition of Phe-tRNAPhe(Cy3) to Cy5 EF-Tu E348C in presence of GTP. (a) The ternary complex was formed in a 24 µl volume using Phe-tRNAPhe(Cy3) [0.2 µM], GTP [100 µM], Cy5-EF-Tu WT or E348C [0.4 µM]. The conditions and incubation buffer are as described in Materials and Methods for the gel retardation assay. A 12-µl volume was loaded on a native 10% polyacrylamide gel (insert), and remaining volume was adjusted to 140 µl. The Cy3 fluorescence was monitored on a Photon Technology International fluorescence spectrofluorometer in the spectrum mode at excitation/emission 549/565 nm. (b) A time-base titration experiment was carried out in a 150 µl black cuvette at RT. Phe-tRNAPhe(Cy3) [60 nM] was in the incubation buffer supplemented with 1 mM ATP and 5 µg/ml of Phe-tRNA synthetase. Cy3 fluorescence (excitation/emission 549/565 nm) was monitored at five sec interval up to 1 h. Cy5 EF-Tu E348C was added from concentrated stock solution to reach final concentration [180 nM]. The 70s ribosome concentration was [240 nM] and poly(U) was 64 µg/ml.
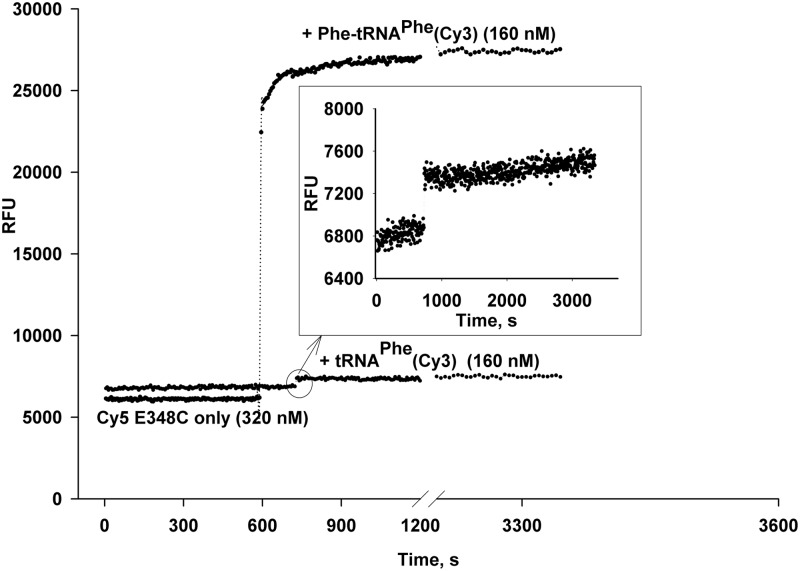
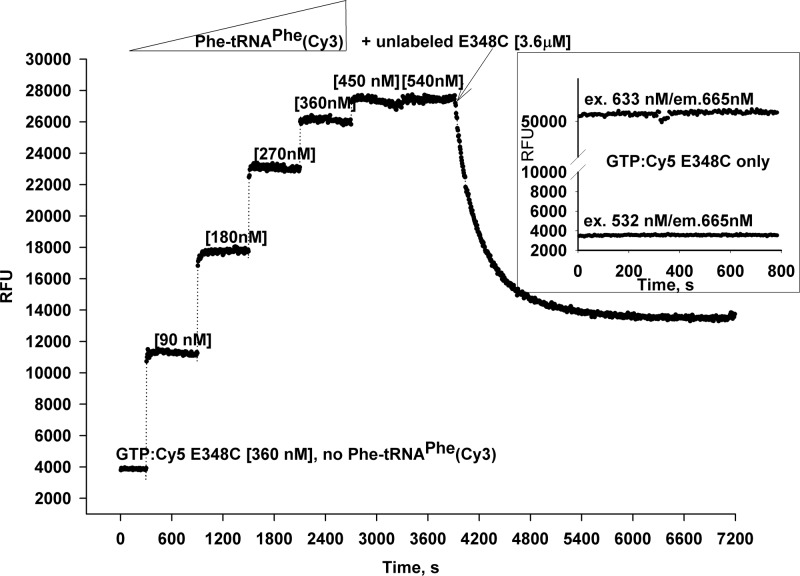
Additional evidence of FRET between charged and Cy3-labeled tRNAPhe and GTP form of E348C (AV) mutant was shown in a series of experiments in which the Cy5-EF-Tu emission was monitored at 665 nm while the excitation of Cy3 was at 532 nm. We observed an approximately 5-fold increase in the Cy5 fluorescence upon an addition of Phe-tRNAPhe(Cy3) to the Cy5-labeled E348C mutant (Fig. 9). In a control experiment, the same amount of uncharged tRNAPhe(Cy3) had almost no effect on the Cy5 fluorescence (inset). The GTP-bound form of Cy5-E348C was titrated by increasing concentrations of Phe-tRNAPhe(Cy3) while the EF-Tu:tRNA ratio was in the 4 : 1 to 1 : 1.5 range (Fig. 10).
Fig. 9.
Effect of aminoacylation of tRNAPhe(Cy3) on FRET during ternary complex formation. Cy5-labeled EF-Tu [320 nM] (GTP form) in a 300-µl volume was placed in 1× incubation buffer. The reaction was supplemented with 100 µM GTP and split into two parts. The FRET upon formation of ternary complex was monitored at 665 nm (suitable for the Cy5 dye) in the time-base mode using the 532 nm excitation for the Cy3 dye. Plot 1 indicates a 4.7-fold increase in Cy5 fluorescence upon addition (10 min) of Phe-tRNAPhe(Cy3). Plot 2: an addition of the same amount of the uncharged tRNAPhe(Cy3) minimally affects the Cy5 fluorescence due to absence of FRET (see inset).
Fig. 10.
Titration of GTP:Cy5-E348C by Phe-tRNAPhe(Cy3) and displacement of labeled EF-Tu from the ternary complex by the unlabeled form. Cy5-labeled EF-Tu [360 nM] (GTP form) in a 300 µl volume was placed in 1× incubation buffer supplemented with 100 µM GTP. The Cy5 fluorescence was monitored for 5 min at 25°C using the 532 nm excitation wavelength. After addition of Phe-tRNAPhe(Cy3), the concentration was increased step-wise in the 90–540 nM range, and fluorescence was monitored at 10-min intervals. After the saturation point was reached (1 h), a 10-fold molar excess of unlabeled EF-Tu E348C was added to the cuvette, and the fluorescence was monitored for one additional hour. The inset shows differences in Cy5 fluorescence of Cy5-EF-Tu E348C excited directly at either 532 nm (bottom line) or 633 nm (top line) wavelength.
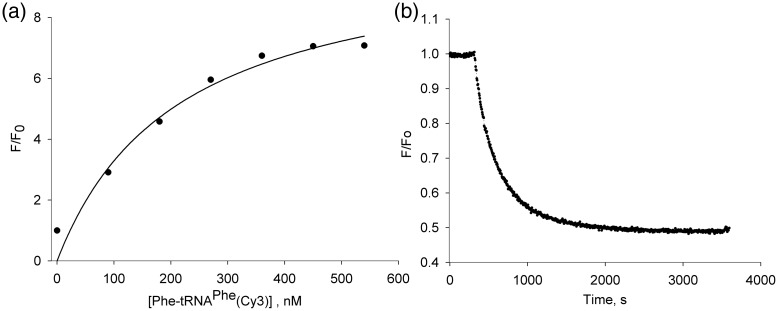
Importantly, the maximum FRET ratio, approximately 7-fold increase in Cy5 fluorescence, was observed at almost equimolar concentrations, confirming the correct complex stoichiometry. Moreover, addition of excess of unlabeled EF-Tu E348C slowly displaces the Cy5-labeled form from the ternary complex (Fig. 10, arrow, and Fig. 11b).
Fig. 11.
EF-Tu fluorescence in ternary complex. (a) The relative fluorescence F/Fo plotted against the concentration of elongation factor Tu in titration of GTP: Cy5-E348C by Phe-tRNAPhe(Cy3). (b) Normalized fluorescence intensity upon displacement of labeled form EF-Tu from the ternary complex in presence of 10 molar excess of unlabeled EF-Tu.
A nonlinear analysis of the titration data was done, similar to that previously described (Abrahamson et al., 1985; Ott et al., 1990), and yielded a dissociation constant of 11 nM for the ternary complex in current experimental conditions (Fig. 11a).
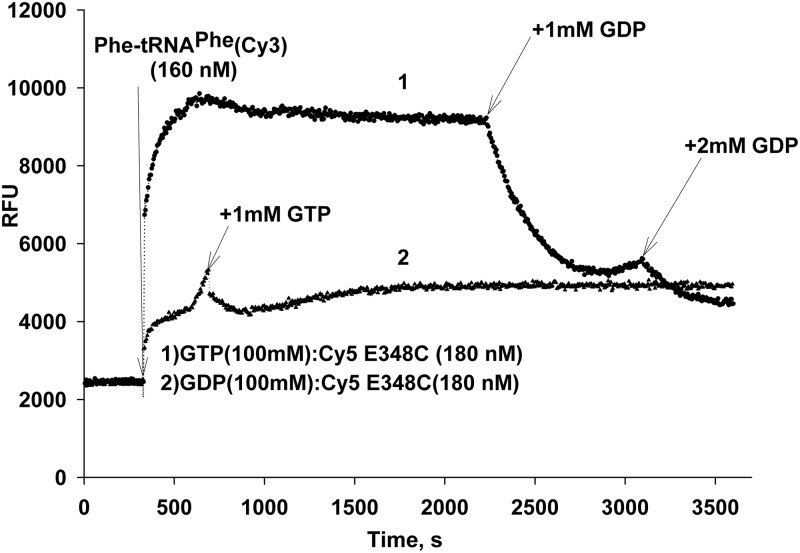
Also, addition of a 10-fold molar excess of GDP led to 60% decrease in Cy5 fluorescence in the formed complex; a similar picture was observed when Cy5 EF-Tu was preincubated with GDP (Fig. 12).
Fig. 12.
Displacement of GTP:EF-Tu from ternary complex by GDP. Cy5-labeled EF-Tu [180 nM] (GTP form) in a 300-µl volume was placed in 1× incubation buffer. The reaction volume was split into two parts, and was supplemented with 100 µM GTP (plot 1, top line) or GDP (plot 2, bottom line) and incubated at 25°C with monitoring of Cy5 fluorescence. The GTP:Cy5-labeled EF-Tu (I) shows approximately 4-fold increase in the Cy5 fluorescence upon an addition of Phe-tRNAPhe(Cy3) [160 nM] (addition made after 5 min incubation, arrow). An addition of 10-fold molar excess of GDP led to a 60% decrease in the Cy5 fluorescence. When the Cy5-labeled EF-Tu was incubated with GDP (plot 2), the FRET response also was significantly lower.
These data provide direct evidence of efficient FRET in the GTP:Cy5 E348C:Phe-tRNAPhe(Cy3) ternary complex.
Discussion
The main goal of this study was directed toward creating an efficient system for monitoring of ternary complex formation by FRET, using both fluorescently labeled tRNA and elongation factor Tu. Fluorescently labeled tRNA was previously successfully used in FRET and smFRET studies of translation machinery (Rodnina et al., 1996; Chen et al., 2011; Mittelstaet et al., 2011), but use of elongation factor Tu in FRET had not been reported. Despite the fact that elongation factor Tu is a relatively small (43 kD) protein, it has a three-domain structure that has conformational flexibility (Kavaliauskas et al., 2012) and three reactive cysteine residues in positions 81, 137 and 255, which complicates labeling stoichiometry and subsequent FRET studies. In a previous study, the replacement of native cysteines and creating of EF-Tu mutants K324C, G325C and E348C (SAV background) did not change sufficiently their functional properties, making them an excellent candidates for FRET assay (Perla-Kajan et al., 2010). Nonetheless, initially we were faced with low FRET efficiency upon formation of ternary complex between Cy3-labeled tRNAPhe and these mutants, which were labeled ether with, Dabsyl plus, QSY9, QSY7 or Cy5 dyes, despite dye/protein ratio which was close to 1/1 (data not shown).
To overcome these difficulties, we decided to retain the native cysteine residue at position 81 considered critical for tRNA binding (Miller et al., 1971; Arai et al., 1974; De Laurentiis et al., 2011), and additionally performed a number of functional tests using mutated and wild-type forms of protein. All our constructs contain a C-terminal His tag. We omitted any step to remove His tag during purification, because introducing this tag did not affect significantly correct recombinant protein folding and its ability to form ternary complex, which was proved in experiments with commercially available EF-Tu from E. coli as a control (see Results section).
The formation in vitro of functional fluorescently labeled ternary complex also depends on many factors, including labeling efficiency of Cy5 EF-Tu and tRNAPhe(Cy3), GTP preparation purity, charging efficiency of Phe-tRNAPhe(Cy3) and conformation stability its components in certain reaction conditions. For this purpose, we improved the existing method of purification of aminoacylated Phe-tRNAPhe(Cy3), allowing us to get 100% labeled and charged functionally active tRNA (see Results section). We also additionally purified commercially available GTP, using ion exchange chromatography with LiCl gradient on DOWEX 1 × 2 resin to remove any traces of GDP/GMP from the prep.
Characterization of Cy3-labeled tRNA and Cy5-labeled EF-Tu
The labeling and charging efficiency of Phe tRNA Phe(Cy3) was close to 100% and was proven by spectroscopy, TLC, gel electrophoresis with subsequent fluorescence scanning and autoradiography. Interestingly, the collected uncharged Cy3 tRNAPhe fraction after charging reaction and HPLC separation could not be further aminoacylated using Phe-tRNA synthetase (data not shown); this shows that a certain amount of tRNAPhe after conjugation with dye lost its native conformation, possibly due to side reaction of the NHS group, and can no longer be a substrate for the Phe-tRNA synthetase. The maximum efficiency of aminoacylation was close to 75%. The charged Phe-tRNAPhe(Cy3) was fully active in in vitro translation, non-enzymatic hydrolysis protection assays and ternary complex formation.
Data from MALDI MS showed that both cysteine residues in Cy5-labeled EF-Tu at positions 348 and 81 were labeled in ratio 60–70% and 30–40%, respectively. The double-labeling was also proven by treatment of Cy5-modified EF-Tu ether with thrombin (generates 24.48 kD N-terminal peptide and 19.46 kD C-terminal), IBZA (iodosobenzoic acid; generates [1–184] – 20.1 kD and [185–399] 23.84 kD peptides) or NTCB (2-nitro-5-thiocyanobenzoic acid; generates [1–81] – 8.85 kD, [82–348] – 29.46 kD and [349–399] – 5.56 kD peptides). The preparations were analyzed on sodium dodecyl sulphate polyacrylamide gel electrophoresis and scanned for Cy5 fluorescence (data not shown). Assuming that both cysteines in E348C (AV) mutant can be labeled, the protein prep after modification is a mixture of certain amount of unlabeled form, a form labeled in two positions (C81 and 348), and forms either labeled at C81 or C348. Only the last form should be 100% functionally active in FRET assay, judging 18 Å distance between donor and acceptor (Fig. 2). Double-labeled (Cy5-81, Cy5-348) protein can be removed by passing through thioporyl-sepharose column, which binds free SH groups, resulting in better FRET efficiency.
Ternary complex formation: gel retardation assay
The main advantage of our modified gel-shift assay is the possibility to directly observe ternary complex either by autoradiography or by fluorescence scan using 14C Phe charged Phe-tRNAPhe(Cy3). In our experimental conditions, complex always migrates between EF-Tu (top) and tRNA itself (bottom) (Figs 6 and 7). In the case of molar excess of E348C mutant over tRNA, we can observe additional slowly migrated bands, probably due to oligomerization of EF-Tu (Ehrenberg et al., 1990). Importantly, FRET can be observed directly on the gel, and ternary complex band of Cy5-labeled E348C is both visible with scanning by green (532 nm) and red excitation (633 nm) lasers. Complex band with unlabeled EF-Tu or with Cy5 labeled EF-TU WT can be visible only with Cy3 emission scan. No complex formed when using deacylated tRNA, or in the presence of EDTA.
Assembly FRET assay
FRET between Phe-tRNAPhe(Cy3) (donor) and Cy5 E348C (acceptor) was observed in a series of titration experiments. We either monitored how Cy3 fluorescence of Phe-tRNAPhe(Cy3) was quenched upon addition of Cy5 E348C, or directly observed FRET, illuminating Cy5 EF-Tu with green light and observed Cy5 emission. In both cases we were able to see direct evidence of FRET. Duration of measurements in time base mode was up to 2 h, no significant photo bleaching effects on measurements were observed. Cy3 fluorescence was sharply decreased (up to 50–60%) upon addition of Cy5 E348C. On the other hand, excitation of Cy5 EF-Tu with green light shows 5–7-fold increase of Cy5 emission in presence charged Phe-tRNAPhe(Cy3).
Energy transfer efficiency (E) was calculated based on data presented in Fig. 8b using equation (Lakowicz and Joseph, 1999):
where Fda is integrated fluorescence intensity of Phe tRNAPhe(Cy3) in presence of Cy5 EF-Tu; Fd is an integrated fluorescence intensity in the absence of Cy5 EF-Tu and fa is fractional labeling of Cy5 EF-Tu. In current experimental conditions E = 0.74.
Negative controls with deacylated tRNA, absence of GTP, presence of proteinase or RNAse, showed no FRET. Addition of excess of unlabeled EF-Tu to preformed complex led to exponential decrease in Cy5 fluorescence, due to displacement of labeled form by unlabeled one. Similar picture was observed in presence of excess of GDP, when GTP:EF-Tu converted to GDP form, with low affinity to tRNA and the complex decays. The in vivo situation is opposite, because the intracellular concentration of GTP is approximately nine times higher than GDP, so complex formation is favorable (Kavaliauskas et al., 2012). This assay also can be used to monitor in vitro translation reaction. An addition of 70S ribosome preparation led to increased Cy3 and decreased Cy5 fluorescence, because donor and acceptor become spatially separated upon EF-Tu dissociation from the ribosome. We conclude that the system presented here, with E348C mutant of EF-TuAV, can be efficiently used to study protein synthesis.
Funding
This work was supported by a grant from the National Institutes of Health (HG004364 to W.M.) and a grant from NINDS (P30NS046593 to H.L.).
Acknowledgements
We thank Dr Arkady Mustaev and Dr David Dubnau for providing access to instrumentation in their laboratories and advice, and Dr Salvatore Marras for help with the setup of fluorescence assays.
References
- Abrahams J.P., Kraal B., Bosch L. Nucleic Acids Res. 1988;16:10099–10108. doi: 10.1093/nar/16.21.10099. [DOI] [PMC free article] [PubMed] [Google Scholar]
- Abrahamson J.K., Laue T.M., Miller D.L., Johnson A.E. Biochemistry. 1985;24:692–700. doi: 10.1021/bi00324a023. [DOI] [PubMed] [Google Scholar]
- Arai K., Kawakita M., Nakamura S., Ishikawa K., Kaziro Y. J. Biochem. 1974;76:523–534. doi: 10.1093/oxfordjournals.jbchem.a130596. [DOI] [PubMed] [Google Scholar]
- Berchtold H., Reshetnikova L., Reiser C.O., Schirmer N.K., Sprinzl M., Hilgenfeld R. Nature. 1993;365:126–132. doi: 10.1038/365126a0. [DOI] [PubMed] [Google Scholar]
- Bharill S., Chen C., Stevens B., Kaur J., Smilansky Z., Mandecki W., Gryczynski I., Gryczynski Z., Cooperman B.S., Goldman Y.E. ACS Nano. 2011;5:399–407. doi: 10.1021/nn101839t. [DOI] [PMC free article] [PubMed] [Google Scholar]
- Blanchard S.C., Kim H.D., Gonzalez R.L., Jr, Puglisi J.D., Chu S. Proc. Natl. Acad. Sci. U. S. A. 2004;101:12893–12898. doi: 10.1073/pnas.0403884101. [DOI] [PMC free article] [PubMed] [Google Scholar]
- Blechschmidt B., Shirokov V., Sprinzl M. Eur. J. Biochem. 1994;219:65–71. doi: 10.1111/j.1432-1033.1994.tb19915.x. [DOI] [PubMed] [Google Scholar]
- Chen C., Stevens B., Kaur J. Mol. Cell. 2011;42:367–377. doi: 10.1016/j.molcel.2011.03.024. [DOI] [PMC free article] [PubMed] [Google Scholar]
- De Laurentiis E.I., Mo F., Wieden H.J. Biochim. Biophys. Acta. 2011;1814:684–692. doi: 10.1016/j.bbapap.2011.02.007. [DOI] [PubMed] [Google Scholar]
- Doi Y., Ohtsuki T., Shimizu Y., Ueda T., Sisido M. J. Am. Chem. Soc. 2007;129:14458–14462. doi: 10.1021/ja075557u. [DOI] [PubMed] [Google Scholar]
- Ehrenberg M., Rojas A.M., Weiser J., Kurland C.G. J. Mol. Biol. 1990;211:739–749. doi: 10.1016/0022-2836(90)90074-V. [DOI] [PubMed] [Google Scholar]
- Fei J., Kosuri P., MacDougall D.D., Gonzalez R.L., Jr Mol. Cell. 2008;30:348–359. doi: 10.1016/j.molcel.2008.03.012. [DOI] [PubMed] [Google Scholar]
- Goldman E., Hatfield G.W. Methods Enzymol. 1979;59:292–309. doi: 10.1016/0076-6879(79)59092-2. [DOI] [PubMed] [Google Scholar]
- Goldman E., Lodish H.F. J. Mol. Biol. 1972;67:35–47. doi: 10.1016/0022-2836(72)90384-1. [DOI] [PubMed] [Google Scholar]
- Gromadski K.B., Wieden H.J., Rodnina M.V. Biochemistry. 2002;41:162–169. doi: 10.1021/bi015712w. [DOI] [PubMed] [Google Scholar]
- Janiak F., Dell V.A., Abrahamson J.K., Watson B.S., Miller D.L., Johnson A.E. Biochemistry. 1990;29:4268–4277. doi: 10.1021/bi00470a002. [DOI] [PubMed] [Google Scholar]
- Kavaliauskas D., Nissen P., Knudsen C.R. Biochemistry. 2012;51:2642–2651. doi: 10.1021/bi300077s. [DOI] [PubMed] [Google Scholar]
- Kothe U., Paleskava A., Konevega A.L., Rodnina M.V. 2006;356:148–150. doi: 10.1016/j.ab.2006.04.038. [DOI] [PubMed] [Google Scholar]
- Lakowicz J.R. Principles of Fluorescence Spectroscopy. 2nd edn. New York: Kluwer Academic/Plenum Publishers; 1999. p. 375. Chapter 13. [Google Scholar]
- Mandecki W., Bharill S., Borejdo J., et al. In single molecule spectroscopy and imaging. Proc. of SPIE (Society of Photo-Optical Instrumentation Engineers).2008. [Google Scholar]
- Marshall R.A., Aitken C.E., Dorywalska M., Puglisi J.D. Annu. Rev. Biochem. 2008;77:177–203. doi: 10.1146/annurev.biochem.77.070606.101431. [DOI] [PubMed] [Google Scholar]
- Miller D.L., Weissbach H. Methods Enzymol. 1974;30:219–232. doi: 10.1016/0076-6879(74)30024-9. [DOI] [PubMed] [Google Scholar]
- Miller D.L., Hachmann J., Weissbach H. Arch. Biochem. Biophys. 1971;144:115–121. doi: 10.1016/0003-9861(71)90460-7. [DOI] [PubMed] [Google Scholar]
- Mittelstaet J., Konevega A.L., Rodnina M.V. J. Biol. Chem. 2011;286:8158–8164. doi: 10.1074/jbc.M110.210021. [DOI] [PMC free article] [PubMed] [Google Scholar]
- Ott G., Jonak J., Abrahams I.P., Sprinzl M. Nucleic Acids Res. 1990;18:437–441. doi: 10.1093/nar/18.3.437. [DOI] [PMC free article] [PubMed] [Google Scholar]
- Pan D., Qin H., Cooperman B.S. RNA. 2009;15:346–354. doi: 10.1261/rna.1257509. [DOI] [PMC free article] [PubMed] [Google Scholar]
- Pape T., Wintermeyer W., Rodnina M.V. EMBO J. 1998;17:7490–7497. doi: 10.1093/emboj/17.24.7490. [DOI] [PMC free article] [PubMed] [Google Scholar]
- Perla-Kajan J., Lin X., Cooperman B.S., Goldman E., Jakubowski H., Knudsen C.R., Mandecki W. Protein Eng Des Sel. 2010;23:129–136. doi: 10.1093/protein/gzp079. [DOI] [PMC free article] [PubMed] [Google Scholar]
- Pingoud A., Urbanke C. Anal. Biochem. 1979;92:123–127. doi: 10.1016/0003-2697(79)90632-8. [DOI] [PubMed] [Google Scholar]
- Plumbridge J.A., Baumert H.G., Ehrenberg M., Rigler R. Nucleic Acids Res. 1980;8:827–843. [PMC free article] [PubMed] [Google Scholar]
- Rodnina M.V., Pape T., Fricke R., Kuhn L., Wintermeyer W. J. Biol. Chem. 1996;271:646–652. doi: 10.1074/jbc.271.2.646. [DOI] [PubMed] [Google Scholar]
- Schmeing T.M., Ramakrishnan V. Nature. 2009;461:1234–1242. doi: 10.1038/nature08403. [DOI] [PubMed] [Google Scholar]
- Uemura S., Aitken C.E., Korlach J., Flusberg B.A., Turner S.W., Puglisi J.D. Nature. 2010;464:1012–1017. doi: 10.1038/nature08925. [DOI] [PMC free article] [PubMed] [Google Scholar]
- Van Noort J.M., Kraal B., Bosch L. Proc. Natl. Acad. Sci. USA. 1986;83:4617–4621. doi: 10.1073/pnas.83.13.4617. [DOI] [PMC free article] [PubMed] [Google Scholar]
- Walker S.E., Fredrick K. Methods. 2008;44:81–86. doi: 10.1016/j.ymeth.2007.09.003. [DOI] [PMC free article] [PubMed] [Google Scholar]


