

Abstract
Objectives: This study was designed to obtain the knowledge about TEG indexes distribution in Chinese aged people, as well as to test the hypothesis that previous TEG indexes are associated with the subsequent thromboembolic and bleeding events in the aged population. Methods: We conducted a two-year follow-up study in Chinese PLA General Hospital, Beijing, China. 403 aged people were enrolled in our study. They received TEG measurements at least once when they entered this study. We collected their demographical characteristics, clinical examination information and their outcome during their observational period. Structural equation modeling (SEM) was used to analyze the relationship between the four indexes from TEG and the outcome via a pathway of indicator. Results: We found that in the “model of bleeding” (adjusted by confounding of Anticoagulants), the model fit indices with chi-square/df = 9.555/7, CFI was 0.997, TLI was 0.994 and standardized root mean square residual (SRMR) was 0.034; while in the “model of thromboembolic events” (adjusted by confounding of Anticoagulants), the model fit indices with chi-square/df = 6.070/7, CFI was1.000, TLI was 1.002 and standardized root mean square residual (SRMR) was 0.000. The “model of thromboembolic events” showed that the four indexes (R, K, MA and ANGLE) were all significantly associated with thromboembolic events, while this significance was not found in the “model of bleeding”. Conclusions: Previous TEG indexes are significantly associated with the subsequent thromboembolic events in the aged population. Future study can test this association and provide more information for the clinical use.
Keywords: Thrombelastography (TEG), thromboembolic event, bleeding, Chinese aged population, structural equation modeling (SEM)
Introduction
Cardiovascular disease (CVD) riains the biggest cause of deaths worldwide. More than 17 million people died from CVD in 2008, and the number will be up to almost 23.6 million by the year of 2030 [1]. In addition to causing significant mortality and morbidity, CVD is responsible for a very large portion of medical spending. CVD accounts for the most annual hospital discharges of the 10 leading diagnostic groups 96.2 million in 2006) [2]. Over the last two decades, 80% of CVD mortality occurred in low- and middle-income countries, suggesting that this disorder has become a leading threat to public health in most of the developing countries [3].
It has long been acknowledged that increasing age is one of the strongest risk factors for the development of CVD. The prevalence of CVD increases with age, from 15% in men and 9% in women aged 20-39 years to 79% in men and 85% in women aged 80+ years [2]. Thus, finding some indexes that can indicate subsequent thromboibolic and bleeding events in the elderly are of paramount importance from both the individual and societal perspectives to reduce the disease burden in coming decades.
Routine coagulation tests (eg., aPTT, PT, TT) indicate the time of fibrin formation through the intrinsic and extrinsic pathways of the coagulation cascade. However, their performance in plasma rather than whole blood limits their relevance to overall dynamic clot formation in whole blood. And coagulation is a dynamic process in which many factors are involved. Routine coagulation tests provide limited information about the quality of clots because they identify only the first stage of clotting [4].
In contrast, thrombelastography (TEG; Haioscope, USA) provides a comprehensive assessment of coagulation function instead of evaluating only discrete portions. By measuring the viscoelastic changes that occur during the hiostatic process, TEG gives a real-time functional evaluation of the coagulation cascade, beginning with initial platelet-fibrin interaction, through platelet aggregation, clot strengthening and fibrin cross-linkage and eventually clot lysis [5]. Since its first description in 1948 [6], the TEG has been successfully used in a diverse group of clinical settings [7]. The greatest use has been the application of TEG–guided transfusion of blood components in hepatic and more widely in cardiac surgery [8,9]. Recent years have seen a renewed interest in the technology with applications for both pharmaceutical monitoring and patient screening being described [10].
Since TEG can detect hypercoagulable and hypocoagulable states, it is a potentially useful test for predicting abnormal bleeding and thromboibolic complications. Many studies designed to discuss the predictive value of single variable from TEG in postoperative or postpartum patients. However, most previous studies failed to dionstrate an association between four TEG variables and outcomes, lacked of a long-term observational time and few information about TEG in the elderly. Therefore, we designed a two-year follow-up study to obtain the knowledge about TEG variables distribution in Chinese aged population, as well as to test the hypothesis that previous TEG indexes are associated with the subsequent thromboibolic and bleeding events in the aged population.
Methods
Study setting
Our study was a two-year follow-up study. The institutional review board of Chinese PLA General Hospital approved this study. Chinese PLA General Hospital, located in Beijing, China, is the largest comprehensive level-3-Grade-A hospital in the army. It is well acknowledged as a modern medical institution with full range of medical service, health care, advanced medical education and powerful scientific research. It had a strong professional team of more than 3,600 staff mibers and received 2.5 million outpatients and over 80 thousand inpatients per year.
Selection of participants
Using the electronic medical record database of Chinese PLA General Hospital, we evaluated all elderly patients admitted between Noviber 2007 and Septiber 2011 who received TEG assessment. Patients who were younger than 65 years, lost before having clinical outcomes or full observational time, or incomplete medical records were excluded from this two-year follow-up study.
Data collection procedure
During the recruitment period, the results of TEG assessment would be recorded and the date of assessment would be considered as baseline time point of this study. Patients’ diographical characteristics and thromboibolic disease history would also be recorded at baseline. Then we followed-up these patients, obtained their details of anti-platelet agent or anticoagulant usage, long-term bed rest information and observed thi every time when they received hospital care or outpatient service to check whether they suffered thromboibolic or bleeding events (defined as follows). Once the subjects had clinical outcomes, we stopped following and wrote it down; Otherwise, the follow-up would be ended after the two-year observational period.
Definitions and outcomes
In our study, there were three outcomes of the subjects: thromboibolic events, bleeding events and normal. Thromboibolic events included MI, ischiic stroke, DVT, and PE. New onset MI was assessed using the Joint European Society of Cardiology/American College of Cardiology definition [11], electrocardiogram and troponin. DVT was diagnosed based on new clinical findings resulting in changes in treatment and positive venous duplex ultrasound scanning. PE was diagnosed based on clinical findings along with pulmonary computed tomography (CT) angiography. Ischiic stroke was confirmed after clinical findings with head CT or nuclear magnetic resonance. The bleeding events included hiaturia, GI bleeding, surgical wound bleeding, oral hiorrhage, nasal hiorrhage, purpuras and petechias, which were evaluated by direct observation, microscopic detection and occult blood test. Normal populations were defined as suffering neither of the two events mentioned above at the end of the observational period.
Laboratory setting and processing of specimens
All TEG specimens were run on Thromboelastograph Analyzer 5000 (Haioscope Corp., IL). Blood was incubated at 37°C in a heated cup. Within the cup was suspended a pin connected to a detector systi. This was a torsion wire in the case of TEG. The cup and pin were oscillated relative to each other through an angle of 4°45´. The movient was initiated from the cup. As fibrin formed between the cup and pin the transmitted rotation from the cup to pin was detected at the pin and a trace (Figure 1) generated at once with on-line analysis (TEG Analytical Software: Version 4.2.101 2006).
Figure 1.
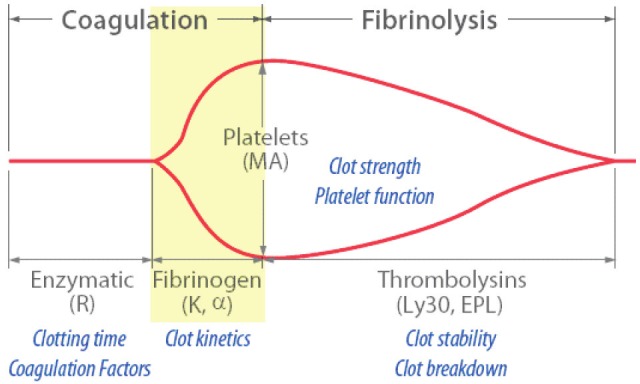
Diagrammatic representation of a TEG traces indicating the commonly reported variables.
Staff laboratory technicians in the Chinese PLA General Hospital performed all the TEG and standard during the defined study period. They conducted TEG testing according to standard protocols and performed all the quality controls on the TEG analyzers every 8 hours.
Measurients
The r value (reaction time) (normal range, 2-8min) reflects the time for fibrin formation. This is the time taken from the beginning of the trace until it reaches an amplitude of 2 mm. R value is prolonged in the presence of factor deficiencies, systiic anticoagulation and thrombocytopenia. The k value (coagulation time) (normal range, 1-3min) represents the time taken for the amplitude to widen from 2 to 20 mm. K is dependent on fibrinogen and platelets. The alpha angle (normal range, 55-78 degrees) is the slope of the tracing that represents the rate of clot formation, increasing with hyperfibrinogeniia or increased platelet aggregation. The maximal amplitude (MA) (normal range, 51-69mm) is the greatest amplitude of the tracing and reflects platelet contribution to clot strength. High MA values correspond with states of platelet hypercoagulability.
Statistical analysis
Statistical analysis on characteristic of study populations across groups was performed by one-way analysis of variance for continuous data and chi-square for categorical data. All statistical tests were two tailed with p<0.05 set as significant. SAS software (SAS institute Inc., Cary, North Carolina) was used for analysis.
Structural equation modeling (Si) was used to analyze the association between baseline TEG indexes and subsequence outcomes. Si is a very general, very powerful multivariate analysis technique. The strength of this approach is that it quantifies the amount of variance in indicators due to the latent construct versus error or unreliability. Accounting for error variance creates factors that are mathiatically perfectly reliable, which increases the statistical power of the overall analysis. Si also allows researchers to test complex relationships between multiple factors and indicators at once. In addition, the fit of one model can also be compared with the fit of alternative models to determine which one best reflects the data. Mplus 6.0 and logistic Si were also iployed for the analyses of structural equation modeling.
Results
Diographic and baseline data
A total of 403 aged people met our inclusion criteria and participated in this study. Of these, 92.6% was male and 7.4% was fiale. The average of their age was 83.0 years old. We found 25 (6.2%) of thi were end up with bleeding and 78 (19.4%) of thi were end up with thromboibolic events. 300 (74.4%) participants did not suffer any thromboibolic or bleeding events. According to their clinical outcomes, we divided the people into three groups: normal group, bleeding group and thromboibolic group. The differences between the three groups were compared by analysis of variance in relation to the age, the four indexes and chisquare test was used for gender, long-term bed rest, medicine and disease history variables. As indicated in Table 1, there were significant differences between the three groups in age, long-term bed rest, hypertension history, angina pectoris history and thromboibolic disease history variables. What’s more, there were also difference between groups in the three TEG indexes, R, K and ANGLE.
Table 1.
Diographic and clinical characteristic of study subjects between different outcome groups
| Variable | outcome | X2 or F (P) | |||
|---|---|---|---|---|---|
|
| |||||
| Normal | Bleeding | Thromboibolic | |||
| Number | 300 | 25 | 78 | ||
| Age, mean (sd) | 82.2 (7.4) | 86.9 (7.7) | 84.9 (5.7) | 8.467 (0.0003) | |
| Gender | 0.3622 (0.8344) | ||||
| Male (%) | 279 (93.0) | 23 (92.0) | 71 (91.0) | ||
| Fiale (%) | 21 (7.0) | 2 (8.0) | 7 (9.0) | ||
| Long-term bed rest# | 105.894 (<0.0001) | ||||
| No (%) | 281 (93.7) | 6 (24.0) | 52 (66.7) | ||
| Yes (%) | 19 (6.3) | 19 (76.0) | 26 (33.3) | ||
| Anticoagulants* | 3.698 (0.157) | ||||
| No (%) | 59 (19.7) | 2 (8.0) | 10 (12.8) | ||
| Yes (%) | 241 (80.3) | 23 (92.0) | 68 (87.2) | ||
| thromboibolic disease history& | 15.8972 (0.0004) | ||||
| No (%) | 202 (67.3) | 18 (72.0) | 34 (43.6) | ||
| Yes (%) | 98 (32.7) | 7 (28.0) | 44 (56.4) | ||
| type 2 diabetes history | 3.0487 (0.2178) | ||||
| No (%) | 164 (54.67) | 18 (72.0) | 46 (58.97) | ||
| Yes (%) | 136 (45.33) | 7 (28.0) | 32 (41.03) | ||
| hypertension history | 10.1413 (0.0063) | ||||
| No (%) | 73 (24.33) | 12 (48.00) | 29 (37.18) | ||
| Yes (%) | 227 (75.67) | 13 (52.00) | 49 (62.82) | ||
| angina pectoris history | 7.2414 (0.0268) | ||||
| No (%) | 80 (26.67) | 10 (40.00) | 32 (41.03) | ||
| Yes (%) | 220 (73.33) | 15 (60.00) | 46 (58.97) | ||
| atrial fibrillation history | 3.5015 (0.1736) | ||||
| No (%) | 266 (88.67) | 19 (76.00) | 69 (88.46) | ||
| Yes (%) | 34 (11.33) | 6 (24.00) | 9 (11.54) | ||
| arrhythmia history | 2.2137 (0.3306) | ||||
| No (%) | 207 (69.00) | 19 (76.00) | 60 (76.92) | ||
| Yes (%) | 93 (31.00) | 6 (24.00) | 18 (23.08) | ||
| baseline TEG | R, mean (sd) | 6.8 (2.0) | 7.3 (2.3) | 6.3 (1.6) | 3.592 (0.0284) |
| K, mean (sd) | 1.9 (0.8) | 2.0 (0.7) | 1.7 (0.6) | 2.981 (0.0519) | |
| MA, mean (sd) | 60.2 (5.7) | 59.8 (7.7) | 61.7 (6.9) | 2.055 (0.1294) | |
| ANGLE, mean (sd) | 59.1 (10.4) | 61.7 (8.4) | 62.2 (8.8) | 3.295 (0.0381) | |
The patients who stayed in bed more than one year in our study can be defined as “long-term bed rest”.
The patients who took anticoagulants during most of our study time could be defined as “yes” in the variable of “anticoagulants”.
The anticoagulants included aspirin, ticlopidine, clopidogrel, prasugrel, eptifibatide, tirofiban, abciximab, warfarin, heparin, low- molecular weight heparin.
Thromboibolic disease history included old myocardial infarction and old lacunar cerebral infarction.
The distribution of TEG indexes in Chinese aged population
After the test of normality, the four TEG indexes obey to the normal distribution in Chinese aged population. The details of the distribution were showed below (Figure 2 and Table 2).
Figure 2.

The distribution of four TEG indexes in Chinese aged population.
Table 2.
Characteristics of TEG indexes
| mean | sd | min | max | 6.600 | |
|---|---|---|---|---|---|
| R | 6.741 | 1.9648 | 2.5 | 21.8 | 6.600 |
| K | 1.895 | 0.7383 | 0.8 | 8.8 | 1.800 |
| MA | 60.460 | 6.1277 | 27.5 | 78.4 | 60.700 |
| ANGLE | 59.893 | 10.0910 | 15.1 | 79.7 | 61.600 |
Structural equation modeling
Since each of the four TEG variables has correlation with others and it just reflects partial of hiostatic process, we decided to use structural equation modeling to control their correlation and put thi together to make a comprehensive evaluation.
The pathway from the four indexes to outcome was further analyzed by Si modeling. Model 1 focused on the outcome of bleeding. We integrated the information provided by the four indexes, controlled their own correlations and built the model in order to find the association between the four indexes and the outcome of bleeding. In Figure 3, it could be seen that the four indexes all significantly built a great contribution to the indicator. The estimated level through R was 1.000 (P<0.001), 1.031 (P<0.001) through K, -8.028 (P<0.001) through ANGLE and -3.718 (P<0.001) through MA. The model fit indices with chi-square/df = 4.759/3, CFI was 0.998, TLI was 0.994 and standardized root mean square residual (SRMR) was 0.042, indicating an excellent model fit (Table 3). In consideration of the age and anticoagulant variables might have an effect on the outcome, we added the variable into our model step by step to find a better model. Finally, we added the anticoagulant variable into our model to build the model 2. In Figure 4, the model fit indices with chi-square/df = 9.555/7, CFI was 0.997, TLI was 0.994 and standardized root mean square residual (SRMR) was 0.034. Model 2 suggested that all indexes in TEG had significant effects on the variable of indicator. But when synthesized thi in one variable (indicator), there showed no significant association between thi (Table 4).
Figure 3.
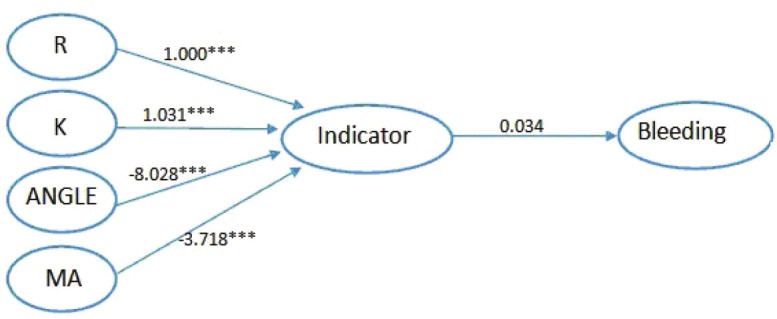
Model 1 Relationship between the four indexes and bleeding. ***All paths are statistically significant (P<0.001).
Table 3.
Path way from four indexes to bleeding
| Path | Estimate | SE | T ratio | P-value |
|---|---|---|---|---|
| R-indicator | 1.000 | 0.000 | ||
| K-indicator | 1.031 | 0.109 | 9.441 | <0.001 |
| ANGLE- indicator | -8.028 | 0.772 | -10.632 | <0.001 |
| MA-indicator | -3.718 | 0.181 | -20.552 | <0.001 |
| Indicator-bleeding | 0.034 | 0.107 | 0.319 | 0.750 |
Figure 4.
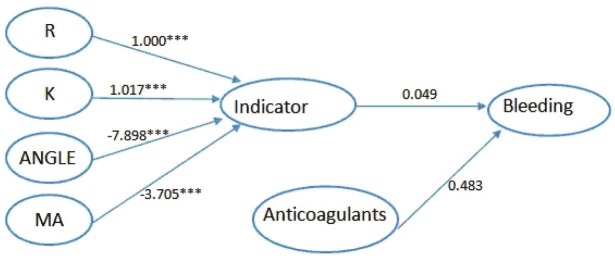
Model 2 Relationship between four indexes and bleeding adjusted by confounding of Anticoagulants. ***All paths are statistically significant (P<0.001).
Table 4.
Path way from four indexes to bleeding adjusted by confounding of Anticoagulants
| Path | Estimate | SE | T ratio | P-value |
|---|---|---|---|---|
| R-indicator | 1.000 | 0.000 | ||
| K-indicator d | 1.017 | 0.106 | 9.576 | <0.001 |
| ANGLE-indicator | -7.898 | 0.751 | -10.518 | <0.001 |
| MA-indicator | -3.705 | 0.182 | -20.308 | <0.001 |
| Indicator-bleeding | 0.049 | 0.104 | 0.472 | 0.637 |
| anticogulants-bleeding | 0.483 | 0.330 | 1.462 | 0.144 |
Further, we focused on the outcome of thromboibolic events to build another model. We used the same method as above. Firstly, we constructed the model 3 to show the relationship between the four indexes and the outcome, thromboibolic events. As showed in Figure 5, the estimated level through R was 1.000 (P<0.001), 1.031 (P<0.001) through K, -8.537 (P<0.001) through ANGLE and -4.174 (P<0.001) through MA. The model fit indices with chi-square/df = 2.922/3, CFI was 1.000, TLI was 1.000 and standardized root mean square residual (SRMR) was 0.000 (Table 5). Next, we added the variables mentioned before to get a better model. The last, we got the model 4 with anticoagulants variable added. In Figure 6, it could be seen that indicator was significantly related to thromboibolic events (estimate=-0.250; t ratio=-3.013; P value= 0.003).The model fit indices with chi-square/df = 6.070/7, CFI was 1.000, TLI was 1.002 and standardized root mean square residual (SRMR) was 0.000, indicating an excellent model fit and a significant relationship between indicator and thromboibolic events (Table 6).
Figure 5.
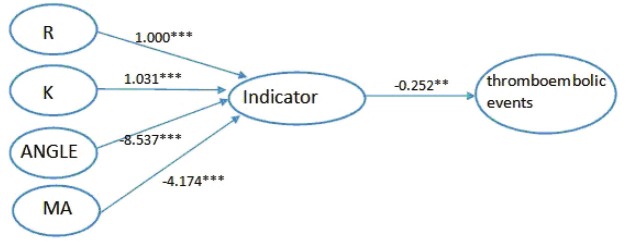
Model 3 Relationship between four indexes and thromboibolic events. ***All paths are statistically significant (P<0.001), **P<0.01.
Table 5.
Path way from four indexes to thromboibolic events
| Path | Estimate | SE | T ratio | P-value |
|---|---|---|---|---|
| R-indicator | 1.000 | 0.000 | ||
| K-indicator | 1.031 | 0.095 | 10.816 | <0.001 |
| ANGLE-indicator | -8.537 | 0.822 | -10.385 | <0.001 |
| MA-indicator | -4.174 | 0.175 | -23.829 | <0.001 |
| Indicator- thromboibolic events | -0.252 | 0.084 | -3.012 | 0.003 |
Figure 6.
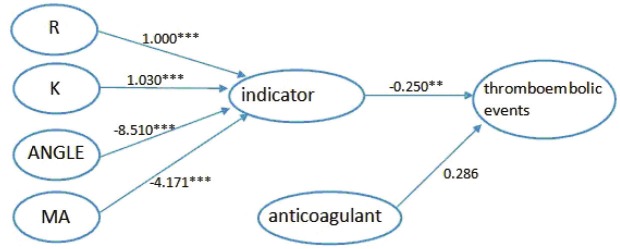
Model 4 Relationship between four indexes and thromboibolic events adjusted by confounding of Anticoagulants. ***All paths are statistically significant (P<0.001), **P<0.01.
Table 6.
Path way from four indexes to thromboibolic events adjusted by confounding of Anticoagulants
| Path | Estimate | SE | T ratio | P-value |
|---|---|---|---|---|
| R-indicator | 1.000 | 0.000 | ||
| K-indicator | 1.030 | 0.096 | 10.728 | <0.001 |
| ANGLE-indicator | -8.510 | 0.814 | -10.458 | <0.001 |
| MA-indicator | -4.171 | 0.176 | -23.651 | <0.001 |
| indicator-thromboibolic events | -0.250 | 0.083 | -3.013 | 0.003 |
| anticoagulants-thromboibolic events | 0.286 | 0.202 | 1.416 | 0.157 |
Discussion
TEG provides a comprehensive evaluation of the viscoelastic properties of blood, generating a complete analysis of the clotting mechanisms from thrombin activation to fibrinolysis. Our study included 403 aged people who were followed over a two-year period, which is the first time to dionstrate a significantly statistical association between four TEG indexes, R, K, ANGLE and MA, and thromboibolic and bleeding events in the aged population.
Theoretically, hypercoagulability has been implicated in the pathogenesis of thrombotic complications, including MI, DVT, PE, ischiic stroke, and vascular graft thrombosis. Despite the limitation that TEG cannot specify the mechanism for hypercoagulable states, it has shown a promising ability to detect known or established hypercoagulable states during pregnancy and postpartum [12-14] or during the presence of cancer [15]. It has been increasingly used in the assessment of postoperative hypercoagulability for a variety of surgical procedures including neurosurgery [16], orthopedic surgery [17] and abdominal surgery [18,19]. Furthermore, TEG assays can assess coagulopathy, platelet dysfunction, and hyperfibrinolysis at an early posttraumatic stage and suggest more effective interventions [20]. Wilson performed TEG every other day in 250 patients having undergone proximal fioral fracture repair and showed that patients suffering from postoperative DVT had a significantly higher level of hypercoagulability as measured by TEG than did those who did not suffer DVT [19]. A study by Traverso included 100 patients undergoing selective abdominal surgery, and in the patients randomized to receive no postoperative heparin thromboprophylaxis, TEG MA value showed the ability to predict the occurrence of DVT with a sensitivity of 72.2% and specificity of 69% [21]. McGrath concluded that TEG MA predicted postoperative thrombotic complications including MI more significantly than the traditional Goldman risk score [22]. However, the accuracy of TEG in predicting thromboibolic events is still in doubt in some studies [19,23,24]. In our study, we documented 36 of the 403 study aged (8.93%) as exhibiting a hypercoagulable state or borderline TEG results. A total of 11 patients (13.8%) who suffered a thromboibolic event (MI, n=5; DVT, n=3; Cerebrovascular Accident, n=3) were predicted by prior TEG hypercoagulability as manifested by increased MA. 65 patients with normal TEG MA value had an thromboibolic event (MI, n=25; DVT, n=23; PE, n=1; cerebrovascular accident, n=16). Therefore, only used MA to detect subsequence thromboibolic events was not appropriate, the structural equation modeling showed that four TEG variables were all associated with thromboibolic events.
There are limitations in our study. Firstly, as this is a medical record database study, although we have tried our best to collect the comprehensive data available for us, maybe still some potential variables are been neglected. Another limitation is that this study was conducted in one hospital with the sample size of 403 subjects. Our conclusion should be tested in future multicenter, prospective, longitudinal studies.
In conclusion, in this study, we used structural equation modeling to show the association between Thrombelastography Systi and Thromboibolic and Bleeding Events in Chinese Aged People. For the first time, as far as we know, we have dionstrated this significantly statistical association. Besides, this study can make contribution and point out the direction of future studies.
We are interested in developing subsequent study to validate a predictive model of thrombotic and bleeding events based on TEG indexes in the aged people. More investigations are necessary to assess the utility of TEG to monitor thromboprophylactic treatment and define optimal treatment strategies for the aged population to improve the safety and efficacy of antithrombotic strategies in the aged population. In summary, TEG is nonetheless a valuable tool for assessing the occurrence of thromboibolic events in the aged people.
Acknowledgement
The authors thank Professor Sun Jing from Griffith University for the support of using the MPLUS software and all the clinicians from Nanlou clinical lab of Chinese PLA General Hospital for their hardworking data collection.
Conflict of interests
We certify that none of the authors has any financial (e.g., employment, consultancies, honoraria, stock ownership or options, grants, contracts, patents, or royalties) or scientific involvement or conflicts of interest with any organizations or materials discussed in the manuscript.
References
- 1.WHO. Global atlas on cardiovascular disease prevention control. http://www.who.int/cardiovascular_diseases/publications/atlas_cvd/en/index.html.
- 2.Long SB, Blaha MJ, Blumenthal RS, Michos ED. Clinical utility of rosuvastatin and other statins for cardiovascular risk reduction among the elderly. Clin Interv Aging. 2011;6:27–35. doi: 10.2147/CIA.S8101. [DOI] [PMC free article] [PubMed] [Google Scholar]
- 3.Pradeepa R, Prabhakaran D, Mohan V. Emerging economies and diabetes and cardiovascular disease. Diabetes Technol Ther. 2012;14:59–67. doi: 10.1089/dia.2012.0065. [DOI] [PubMed] [Google Scholar]
- 4.Eckman MH, Erban JK, Singh SK, Kao GS. Screening for the risk for bleeding or thrombosis. Ann Intern Med. 2003;138:W15–24. doi: 10.7326/0003-4819-138-3-200302040-00011-w1. [DOI] [PubMed] [Google Scholar]
- 5.Mallett SV, Cox DJ. Thrombelastography. Br J Anaesth. 1992;69:307–313. doi: 10.1093/bja/69.3.307. [DOI] [PubMed] [Google Scholar]
- 6.Hartert H. Blutgernnung studien mit der thromboelastographie, einen Neuen Untersuchingsverfahren. Klin Wochenschr. 1948;26:577–583. doi: 10.1007/BF01697545. [DOI] [PubMed] [Google Scholar]
- 7.Whitten CW, Greilich PE. Thromboelastography: Past, Present, and Future. Anesthesiology. 2000;92:1223–1225. [PubMed] [Google Scholar]
- 8.Spiess BD, Gillies BS, Chandler W, Verrier E. Changes in transfusion therapy and reexploration rate after institution of a blood management program in cardiac surgical patients. J Cardiothorac Vasc Anesth. 1995;9:168–173. doi: 10.1016/S1053-0770(05)80189-2. [DOI] [PubMed] [Google Scholar]
- 9.Pfanner G, Koscielny J, Pernerstorfer T, Gütl M, Perger P, Fries D, Hofmann N, Innerhofer P, Kneifl W, Neuner L, Schöchl H, Kozek-Langenecker SA Austrian Society for Anaesthesia, Resuscitation and Intensive Care. Preoperative evaluation of the bleeding history. Recommendations of the working group on perioperative coagulation of the Austrian Society for Anesthesia, Resuscitation and Intensive Care. Anaesthesist. 2007;56:604–611. doi: 10.1007/s00101-007-1182-0. [DOI] [PubMed] [Google Scholar]
- 10.Luddington RJ. Thrombelastography/thromboelastometry. Clin Lab Haematol. 2005;27:81–90. doi: 10.1111/j.1365-2257.2005.00681.x. [DOI] [PubMed] [Google Scholar]
- 11.Alpert JS, Thygesen K, Antman E, Bassand JP. Myocardial infarction redefined: a consensus document of The Joint European Society of Cardiology/American College of Cardiology Committee for the redefinition of myocardial infarction. J Am Coll Cardiol. 2000;36:959–969. doi: 10.1016/s0735-1097(00)00804-4. [DOI] [PubMed] [Google Scholar]
- 12.Sharma SK, Philip J, Wiley J. Thromboelastographic changes in healthy parturients and postpartum women. Anesth Analg. 1997;85:94–98. doi: 10.1097/00000539-199707000-00017. [DOI] [PubMed] [Google Scholar]
- 13.Steer PL, Krantz HB. Thromboelastography and Sonoclot analysis in the healthy parturient. J Clin Anesth. 1993;5:419–424. doi: 10.1016/0952-8180(93)90108-q. [DOI] [PubMed] [Google Scholar]
- 14.Rai R, Tuddenham E, Backos M, Jivraj S, El’Gaddal S, Choy S, Cork B, Regan L. Thromboelastography, whole-blood haemostasis and recurrent miscarriage. Hum Reprod. 2003;18:2540–2543. doi: 10.1093/humrep/deg494. [DOI] [PubMed] [Google Scholar]
- 15.Francis JL, Francis DA, Gunathilagan GJ. Assessment of hypercoagulability in patients with cancer using the Sonoclot Analyzer and thromboelastography. Thromb Res. 1994;74:335–346. doi: 10.1016/0049-3848(94)90149-x. [DOI] [PubMed] [Google Scholar]
- 16.Abrahams JM, Torchia MB, McGarvey M, Putt M, Baranov D, Sinson GP. Perioperative assessment of coagulability in neurosurgical patients using thromboelastography. Surg Neurol. 2002;58:5–11. doi: 10.1016/s0090-3019(02)00777-2. [DOI] [PubMed] [Google Scholar]
- 17.Wilson D, Cooke EA, McNally MA, Wilson HK, Yeates A, Mollan RA. Changes in coagulability as measured by thrombelastography following surgery for proximal femoral fracture. Injury. 2001;32:765–770. doi: 10.1016/s0020-1383(01)00139-5. [DOI] [PubMed] [Google Scholar]
- 18.Mahla E, Lang T, Vicenzi MN, Werkgartner G, Maier R, Probst C, Metzler H. Thromboelastography for monitoring prolonged hypercoagulability after major abdominal surgery. Anesth Analg. 2001;92:572–577. doi: 10.1097/00000539-200103000-00004. [DOI] [PubMed] [Google Scholar]
- 19.Caprini JA, Arcelus JI, Laubach M, Size G, Hoffman KN, Coats RW 2nd, Blattner S. Postoperative hypercoagulability and deep-vein thrombosis after laparoscopic cholecystectomy. Surg Endosc. 1995;9:304–309. doi: 10.1007/BF00187774. [DOI] [PubMed] [Google Scholar]
- 20.Carroll RC, Craft RM, Langdon RJ, Clanton CR, Snider CC, Wellons DD, Dakin PA, Lawson CM, Enderson BL, Kurek SJ. Early evaluation of acute traumatic coagulopathy by Thrombelastography. Transl Res. 2009;154:34–39. doi: 10.1016/j.trsl.2009.04.001. [DOI] [PubMed] [Google Scholar]
- 21.Traverso CI, Arcelus JI, Gomez E, Luna D, Lopez-Cantareno M, Garcia J. Prospective assessment of the risk of deep vein thrombosis in elective abdominal surgery: predictive role of thromboelastography. Thromb Haemarrh Disorders. 1993;71:9–15. [Google Scholar]
- 22.McGrath DJ, Cerboni E, Frumento RJ, Hirsh AL, Bennett-Guerrero E. Thromboelastography maximum amplitude predicts postoperative thrombotic complications including myocardial infarction. Anesth Analg. 2005;100:1576–1583. doi: 10.1213/01.ANE.0000155290.86795.12. [DOI] [PubMed] [Google Scholar]
- 23.Koopman K, Uyttenboogaart M, Hendriks HG, Luijckx GJ, Cramwinckel IR, Vroomen PC, De Keyser J, van der Meer J. Thromboelastography in patients with cerebral venous thrombosis. Thromb Res. 2009;124:185–188. doi: 10.1016/j.thromres.2008.12.032. [DOI] [PubMed] [Google Scholar]
- 24.Stravitz RT, Lisman T, Luketic VA, Sterling RK, Puri P, Fuchs M, Ibrahim A, Lee WM, Sanyal AJ. Minimal effects of acute liver injury/acute liver failure on hemostasis as assessed by thromboelastography. J Hepatol. 2012;56:129–136. doi: 10.1016/j.jhep.2011.04.020. [DOI] [PMC free article] [PubMed] [Google Scholar]