

Abstract
Drug-eluting stents have a significant clinical advantage in late-stage restenosis due to the antiproliferative drug release. Understanding how drug transport occurs between coronary arterial locations can better help guide localized drug treatment options.
Finite element models with properties from specific porcine coronary artery sections (left anterior descending (LAD), right (RCA); proximal, middle, distal regions) were created for stent deployment and drug delivery simulations. Stress, strain, pore fluid velocity, and drug concentrations were exported at different time points of simulation (0–180 days). Tests indicated that the highest stresses occurred in LAD sections. Higher-than-resting homeostatic levels of stress and strain existed at upwards of 3. mm away from the stented region, whereas concentration of species only reached 2.7 mm away from the stented region. Region-specific concentration showed 2.2 times higher concentrations in RCA artery sections at times corresponding to vascular remodeling (peak in the middle segment) compared to all other segments. These results suggest that wall transport can occur differently based on coronary artery location. Awareness of peak growth stimulators and where drug accumulation occurs in the vasculature can better help guide local drug delivery therapies.
Keywords: porohyperelastic mass transport, stent, drug, simulation, coronary
Introduction
Coronary artery disease is a complex disease that encompasses the interactions of several physiologic factors with the biomechanical environment. For these reasons, the severity and frequency of coronary artery disease, the frequency of intervention, and the analysis of the coronary artery vasculature pre- and post-intervention are studied in vivo, ex vivo, in vitro, and in silico with high frequency [1–12]. One area of interest is transport through the arterial wall. Studying mass transport in the coronary vasculature allows researchers to develop a better understanding of vascular disease and intervention.
Evaluation and simulation of mass transport can be used to study various physiologic scenarios in coronary arteries such as healthy behavior for the movement of naturally produced nitric oxide for homeostatic regulation [13], lipid transport in focal regions during disease development [14], and drug transport in the treatment of disease [2,15]. In particular, the study of transport in the drug-eluting stent/tissue system has become a frequently considered topic since the expansion of coronary intervention to the use of drug-eluting stents. To understand drug delivery efficiency, the transport properties of the arterial wall can be identified and treatment scenarios simulated.
We have recently reported variations in the measured fluid and mass transport properties of porcine coronary arteries based on arterial location [4,16]. One of these studies indicated differences in the observed porohyperelastic properties between arterial regions [4]. This porohyperelastic study showed how compliance was higher in right coronary (RCA) arteries compared to left anterior descending coronary (LAD) arteries with permeability decreasing along the arterial length. While the porohyperelastic study showed there were differences in the water transport properties, the coupling of these properties to reported variations in diffusive transport based on location can provide a more complete picture of total drug transport if combined into a porohyperelastic mass transport computational model of stent–tissue interaction [16]. These transport properties were identified using a small molecular weight hydrophobic fluorescent drug surrogate (similar to currently used drug-eluting stent pharmaceuticals), and are particularly useful because the properties were determined on the same type of control (healthy) animal model, therefore, preventing the simulation of chimeric species in silico. In other words, stent-based simulations using these properties would be for stents implanted in the arteries of an existing animal subject.
Several researchers have previously simulated stent deployment and transport [1,2,14,17–20]. This occurs through the use of several different transport scenarios. For instance, hemodynamic analysis coupled to convective/diffusive transport analysis provides a direct link between intraluminal fluid pressures, shear stress, and the convective component of transport [21–23]. Coupled multidomain approaches have offered the ability to show how shear force on endothelial cells or changes in the hemodynamic environment due to anatomical reasons can alter observed depositions of drugs or albumin [24,25].
Another method is to utilize a coupled porohyperelastic/mass transport approach. Utilizing the porohyperelastic mass transport approach allows for the coupling of deformation and transport [17,26]. Feenstra and Taylor implemented this framework and showed the novelty of the porohyperelastic mass transport approach, including implementations of anisotropy and near-term layer retention; all of these properties integrated with deformation [17]. In their study, they used material properties from several notable previous findings. Using their approach, interstitial and cell-bound concentrations of drugs can be determined on deformed geometries with influence from mechanical, convective, and diffusive components. Implementing an approach on undeformed geometries can change final transport by a factor of the degree of deformation (e.g., more error with more deformation). A quantitative difference in the approach we have used compared to other implementations of the porohyperelastic mass transport approach is the use of a convection coupling coefficient (, see Materials and Methods: Porohyperelastic Mass Transport Theory) instead of using only permeability (). Permeability indicates only water flux through the interstitial pores, whereas the coupling coefficient indicates the degree to which the molecules are transported with the permeating fluid. Mathematically, the use of the coupling coefficient can change convective transport fluxes by as much as two orders of magnitude (the value of , as reported previously). The use of the coupling coefficient is an advantage of our modeling framework since the convection coefficient was experimentally measured and coupled to permeability and diffusivity for the specific arteries that were simulated. Using allows us to simulate convective transport of druglike molecules, as opposed to convective transport of just the interstitial fluid.
Our research group has developed a porohyperelastic mass transport analysis simulation approach in which a porohyperelastic analysis result is sequentially read into a mass transport analysis to simulate the deformationally dependent mass transport in soft tissues [26]. While there have been reports using a porohyperelastic mass transport approach for modeling transport of drug-eluting stent (DES). [17], there is no report of how drug distribution is altered as a function of location in the coronary vasculature when simulating stent-based drug delivery. Furthermore, this work is the first to report, for a single species from experiments within the same research group, how the differences in overall (diffusive, convective, and coupling) DES drug transport may be affected in the stented situation after 180 days. Therefore, the purpose of this paper was to use a porohyperelastic mass transport approach to quantify variations in drug concentrations, over the entire time course of elution (180 days) for stented arteries between arterial regions in the porcine coronary artery tree and along the length of stented and nonstented regions.
Materials and Methods
Porohyperelastic Mass Transport Theory.
The transport of molecules through the arterial wall is governed by Eulerian Fick's law [26] (Eq. (1)):
| (1) |
where is the effective transport flux of the species (mol/m2 s), c is the interstitial molar concentration (mol/m3), xi is the deformed position coordinate (related to the transport length scale; m), bcf is the effective convection coupling coefficient (unitless), kff is the permeability (m4/N s), dcc is the effective diffusivity (m2/s), and pf is the interstitial pore fluid pressure (Pa). Note that this form assumes isotropy in transport properties and the lack of length scale in the individual property values (as indicated by the multiplicative gradient). Also note the first term on the right-hand side of the Eq. (1) represents the diffusive portion of transport while the second term represents the convective transport component. The interstitial fluid velocity is driven by the Eulerian Darcy's law: ,where is the relative fluid velocity (m/s).
Utilizing a porohyperelastic approach allows the prediction of interstitial fluid velocity as a function of the pore fluid pressure and mechanical properties of the solid material. Porohyperelastic analyses are governed by the conservation of linear momentum, conservation of mass, and the effective stress principle [26,27]. We implemented the porohyperelastic framework to ensure transport was implemented on the deformed coordinates.
In the finite element analysis suite Abaqus 6.9-1, mass transport is simulated in the Lagrangian domain, whereas porohyperelastic analyses are simulated in the Eulerian domain. Abaqus was chosen because of its extensive commercial benchmarking and documentation. In addition, the design of custom coupled porohyperelastic mass transport with complicated geometries and contact would be time and cost prohibitive. A custom code would allow for back-coupling of transport (from the diffusive to the porohyperelastic modules). To couple the two analysis types in a sequential fashion, a custom, previously demonstrated set of Fortran routines alter the prescribed boundary conditions and material properties to simulate convective-diffusive transport in a Eulerian fashion as described by Eq. (1) [16,26]. Simulating via the porohyperelastic mass transport approach allows for the coupling of deformation to total transport on the deformed configuration (e.g., Eulerian). Simulating in the Abaqus default, Lagrangian (unde-formed coordinate) domain, would not allow this.
Cellular Binding.
While transport of molecules is governed by porohyperelastic mass transport, pharmaceuticals often act on localized areas in the vascular walls through binding to target proteins after transport occurs. This localized binding can be described by the film coefficient in Abaqus 6.9-1 (Eq. (2)) [28]:
| (2) |
where jbind is the binding flux (mol/m2 s), h is the film coefficient (function of concentration; m/s), bmax is the maximum bound concentration (mol/m3), and b is the current bound concentration (mol/m3). This is an additive flux to the right hand side Eq. (1) that occurs in focal (cellular) locations in the arterial walls. Since the h value is a look-up table, the concentration at surrounding nodes directly influences the rate of binding at nodes assigned to be smooth muscle cells. Surrounding nodes not assigned to be smooth muscle cells had h values of zero since the mesh density was finer than the smooth muscle cell separation (as determined from nuclei locations). For more details in regard to the implementation of the film coefficient in relation to existing binding models (e.g., Langmuir) please see previous work [16]. This technique was implemented as opposed to a bulk observed partition since data were acquired on individual cellular locations with the drug surrogate. The simulation of localized binding has the advantage of obtaining more detailed information with the tradeoff of more computational time.
Material Properties.
All vessel properties of the different sections (LAD, RCA; proximal, middle, and distal regions) were assigned in this model from two previous manuscripts that report porohyperelastic, mass transport, and geometrical properties for a specific type of animal (barrow porcine subjects of similar weight, size, age) [4,16]. Therefore, computational modeling done in this study is for mass transport for that specific animal [4,16]. The porohyperelastic mechanical properties are modeled with the Fung-type orthotropic effective strain energy density as shown in Eq. (3) [28]:
| (3) |
where c, A1, A2, A3, and D are material constants, J is the determinant of the deformation gradient tensor, and are the components of the deviatoric Green's strain tensor. Modeling occurs in cylindrical coordinates. Note that we assume no shear stress and thin-walled formulations for stress and strain [29]. The transport properties (dcc, kff, bcf) were modeled in Abaqus 6.9 with isotropy. The transport properties here are expected to have a degree of anisotropy [1,2], however, since transport is expected to primarily occur in the radial direction we modeled materials with isotropy using the transport properties in the radial direction. Mass transport properties were determined for a hydrophobic drug surrogate with transport properties similar to those on drug-eluting stents (e.g., hydrophilicity, lipophilicity, solubility compound, molecular weight, vascular retention, cell-bound). For further details for our chosen drug surrogate the reader is pointed to our previous work [16]. We chose a hydrophobic compound (as opposed to hydro-philic) to ensure cellular binding occurs and so our conclusions may be more relevant in regard to drug-eluting stent pharmaceuticals. In addition, binding is modeled as single-cell activities with binding coefficients as previously reported for the drug surrogate in monoculture.
The stent was treated as an isotropic F562 CoCr alloy with von Mises yield criteria with kinematic hardening. The bulk of mechanical influence to the stent was deemed to be the metallic structure, so the polymeric coating was not modeled. For instance, the Medtronic Resolute Integrity® coronary system has a 4–6% polymer to strut percentage; therefore, the stent was modeled with only the metal [30,31]. To impose a concentration, the nodes in contact (as exported from the porohyperelastic analysis) were applied concentration boundary conditions (detailed in Materials and Methods: Boundary Conditions). See Table 1 for a synopsis of all properties with citations as to the origin of the numerical value.
Table 1.
Material properties. Mechanical property values are listed as c, A1, A2, A3, D.
| Model | Artery | Section | Property | Value | Unit | ||
|---|---|---|---|---|---|---|---|
| Porohyperelastic | LAD b | Prox | Mechanical [4] | 445 × 103, 1.4, 0.99, 0.47, 2.2 × 10⁻⁸ | a | ||
| Mid | 160 × 103, 5.3, 1.6, 1.49, 6.9 10−9 | ||||||
| Dist | 162 × 103, 2.79, 5.19, 0.55, 7.0 10−9 | ||||||
| RCA c | Prox | 439 × 103, 0.99, 1.33, 0.32, 7.8 × 10⁻⁷ | |||||
| Mid | 61 103, 4.51, 5.50, 2.61, 8.1 × 10⁻⁷ | ||||||
| Dist | 61 × 103, 0.96, 13.1, 1.72, 9.0 × 10⁻⁷ | ||||||
| LAD | Prox | kff [4] | 1.333 × 10⁻¹⁰ | m/s | |||
| Mid | 1.797 × 10⁻¹⁰ | ||||||
| Dist | 5.237 × 10⁻¹¹ | ||||||
| RCA | Prox | 2.870 × 10⁻¹⁰ | |||||
| Mid | 1.521 × 10⁻¹⁰ | ||||||
| Dist | 7.335 × 10⁻¹¹ | ||||||
| Mass transport | LAD | Prox | dcc [16] | 2.873 × 10⁻¹⁴ | m2/s | ||
| Mid | 4.535 × 10⁻¹⁴ | ||||||
| Dist | 1.472 × 10⁻¹⁴ | ||||||
| RCA | Prox | 2.447 × 10⁻¹⁴ | |||||
| Mid | 3.985 × 10⁻¹⁴ | ||||||
| Dist | 1.463 × 10⁻¹⁴ | ||||||
| LAD | Prox | b c f [16] | 4.000 × 10⁻⁴ | unitless | |||
| Mid | 5.500 × 10⁻⁴ | ||||||
| Dist | 2.850 × 10⁻³ | ||||||
| RCA | Prox | 2.967 × 10⁻³ | |||||
| Mid | 3.450 × 10⁻³ | ||||||
| Dist | 8.367 × 10⁻³ | ||||||
| All | Binding (h(c))[16] | 1.2 × 10⁻⁵(6.0 × 10⁻⁵) | m/s | ||||
| 1.9 × 10⁻⁵(1.4 × 10⁻⁴) | |||||||
| 2.8 × 10⁻⁵(2.3 × 10⁻⁴) | |||||||
| 5.0 × 10⁻⁵(1.5 × 10⁻³) | |||||||
| Metal | All | Elastic modulus [57] | 21 | GPa | |||
| Poisson's ratio [57] | 0.31 | ||||||
| Plastic modulus [57] | 1.5 | GPa | |||||
| Plasticity strain transition [57] | 0.007 | ||||||
The unit is Pa for c, Pa−1 for D, and unitless for A1, A2, A3.
Left anterior descending coronary artery.
Right coronary artery.
Geometry.
Artery dimensions were taken from previously reported values from the same porcine subjects as the constitutive properties (Table 2) [4]. Each arterial region from the LAD and RCA arteries was modeled in 1/20 symmetry for the numerical simulations (1/10 symmetry in circumference and 1/2 in length). Arteries were each 20–24 mm long without symmetry, and the stented region was 12–16 mm. Arteries were modeled as prismatic since properties were determined with the vessel in a prismatic form, and the focus of this paper was how the change in properties with location influences transport and retention. In addition, splitting the entire vessel into three segments resulted in contour lengths having less than 10% difference to the extended length. The prismatic form simplifies the analysis and matches the property quantification, however, introduces a degree of nonphysicality. The stent was a generic open-cell design with 20 repeating structures around the circumference and six along the length. Strut thickness was 100 μm [30]. Representative geometry may be seen in Fig. 1(a).
Table 2.
Arterial dimensions (mean ± standard deviation) [4]
| Inner radius (mm) | Thickness (mm) | |||
|---|---|---|---|---|
| LP d | 1.97 ± 0.13 | 0.26 ± 0.02 | ||
| LM e | 1.18 ± 0.14 | 0.23 ± 0.03 | ||
| LD f | 1.03 ± 0.09 | 0.19 ± 0.05 | ||
| RP g | 1.97 ± 0.15 | 0.29 ± 0.08 | ||
| RM h | 1.75 ± 0.36 | 0.30 ± 0.05 | ||
| RD i | 1.91 ± 0.16 | 0.28 ± 0.02 | ||
LAD Proximal region.
LAD Middle region.
LAD Distal region.
RCA Proximal region.
RCA Middle region.
RCA Distal region.
Fig. 1.
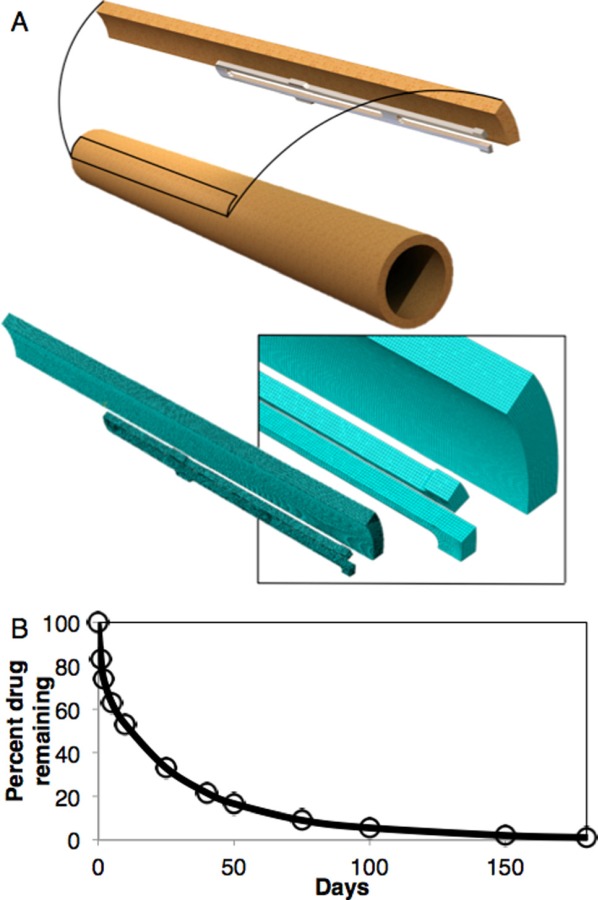
(a) Top: geometry with representative 1/20 symmetry. Bottom: representative mesh with closeup in inset. (b) Resolute Integrity® release profile used in the simulations (adapted from Ref. [33]).
Each model was meshed with eight-node brick pore fluid pressure stress or mass transport elements with 11–16 elements through the thickness and the same nodal separation used in the other two dimensions. Mesh density was chosen by decreasing the nodal separation and examining maximum principal stress, maximum principal strain, relative fluid velocity, and concentration at every node until there was at most a 0.1% difference between simulations. Each model contained between ∼250,000 to 350,000 nodes based on the individual arterial section's (LAD, RCA; proximal, middle, distal) mesh geometry and mesh refinement. Elements were assigned to local cylindrical coordinate systems to apply orthotropic boundary conditions and material properties.
In order to implement individual smooth muscle cell binding, the smooth muscle cell density was taken from histology (see Ref. [4]). Smooth muscle cells (SMC) were placed at nodes every 22 μm through the radius, every 105 μm circumferentially, and every 190 μm along the length [4]. Nodal density was finer than this, with non-SMCs being assigned a binding coefficient of zero. These numbers were determined by splitting histology images along the circumference and through the thickness equal to the number of elements in the different directions. Cell counts were done in these subregions and coordinates and number of cells determined to calculate the average separations between cells. Multiphoton scans (shown previously) were used to determine the separation in z [16]. Since densities were equivalent in the different locations, the same cell separation could be used in each simulated arterial location.
Boundary Conditions.
The first step was to roll the vessel from the opening angle configuration to the closed, tubular, form. Rolling was done by fixing one circumferential and axial face and applying individual nodal displacement to result in a tube section (since modeling was done with 1/20 symmetry). The stress and strain state was exported from this step to the porohyperelastic model. In the porohyperelastic model the vessel was fixed on the axial symmetry end and the other end stretched to the in situ stretch, as measured and reported from a previous study on the same type of porcine subjects [4]. It was also fixed in θ to impose a circumferential symmetry condition. The stent was fixed in z on the axial symmetry end and θ on the circumferential ends. After stretching to the in situ stretch (taken from previous work [4]), the vessel was pressurized to 100 mmHg. Following pressurization, stent deployment was performed through an imposed frictionless boundary condition with a pressure imposed on the inner surface of the stent of 10–15 atm [32]. The stent was allowed to undergo plastic deformation beyond the final deployment position then allowed to recoil. The distance from the intimal surface in the nonstented region to the inner surface of the stent was tuned by changing the pressure to allow for a 100 μm final overexpansion. After this step, the model was run to consolidation by imposing a 100 mmHg pressure gradient (mean arterial pressure, MAP) from the intimal to the adventitial surfaces. The pore fluid pressure and deformation gradient fields at the end of the porohyperelastic analyses were exported from the porohyperelastic model and run through a previously demonstrated Fortran routine to allow for deformationally dependent mass transport simulation in Abaqus [26]. In addition, the nodes undergoing contact were exported.
The mass transport simulation's mesh was exactly the same as the porohyperelastic analysis. The pressure stress factor (), Lagrangian diffusivity (), and solubility () fields were read into the mass transport analysis as [26]
| (4) |
| (5) |
| (6) |
where is the mass solubility (kg/m3), is the mass concentration (kg/m3), Hij is the Finger's strain tensor, n is the porosity, Mc is the molecular mass (kg/mol), and γc is the molar activity coefficient (mol/m3). These equations allow for the conversion of Eulerian to Lagrangian values (for implementation in Abaqus). The Lagrangian form of Fick's law that is implemented in Abaqus is
| (7) |
where is the Lagrangian mass flux. Note where the Lagrangian quantities (e.g., , , ) appear. Tildes (∼) signify Lagrangian quantities, and hats (^) signify mass values on the total volumes (as opposed to molar on interstitial volumes).
In addition, the reported pore fluid pressures from the porohyperelastic analysis were imported. For the mass transport model a zero concentration boundary condition was applied at the outer surface of the vessel, and then a time-varying concentration boundary condition was applied at the stent and inner nodes of the vessel that underwent contact. The time-varying concentration was taken from data available from previous publications regarding the Endeavor Resolute Integrity®'s release profile (Fig. 1(b)) [33]. The mass transport analysis was simulated for 180 days (full drug release) [33,34]. These results were mapped to the deformed geometry in the Eulerian porohyperelastic analysis [26]. Concentrations were converted from the molar interstitial concentrations c to the total volume mass concentrations by
| (8) |
Conversion was done for each arterial region. Binding was implemented by assigning a h(c) look-up table to nodes corresponding with cells. Each arterial region had the same cellular density [16]. Models were run with and without binding to observe arterial retention and concentration profiles with the different modeling approaches.
To investigate whether simulating transport changed when considering the vessel to be at a steady mean arterial pressure, as has been done previously, or when imposing a pulsatile pressure cycle in the porohyperelastic analysis, a step was added in the porohyperelastic analysis discussed above. In this situation a pulsatile step was added after consolidation. The intraluminal pressure trace was taken as averaged from previous publications (between 70 and 130 mmHg) [35–37]. Likewise, the pore fluid pressure fields at different steps in the analysis were read into the mass transport analysis after the Fortran transfer routine. These results were investigated for temporal and spatial concentration variations between arterial sections between pulsatile and steady state conditions. In addition, the concentration variations were compared between the binding and noncell binding models.
Data Processing.
Relative fluid velocities were solved on an elemental basis but read in as nodal values averaged from surrounding elements. Maximum principal stresses and strains were reported as averages over regions (stent versus nonstent; between arterial sections). Nodal concentrations were also read from the results files. Values were taken from the planes and lines of nodes as shown in Fig. 2. Values were taken as either line scans or averaged between all nodes in regions or averaged in the line scan as displayed in the results. To evaluate total stresses and strains in the stented and nonstented regions, the results from all elements in these regions were averaged. To evaluate the relative influences of convection to diffusion a Peclet-like number (Pe*) was reported:
Fig. 2.
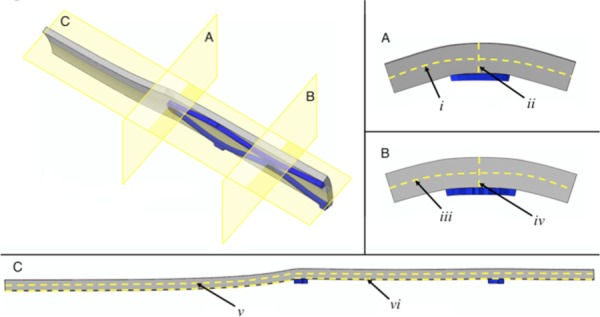
Geometry planes and lines for evaluation. (a) is the planar cut at the end of the stent. i is the line of nodes at the midradius around the θ direction at the end of the stent. ii is the line of nodes in mid-θ along the radius at the end of the stent. (b) is the planar cut in the middle of the stent. iii is the line of nodes at the midradius around the θ direction in the middle of the stent. iv is the line of nodes in mid-θ along the radius in the middle of the stent. (c) is the planar cut at mid-θ. v is the line of nodes at midradius along the length of the vessel section. iv is the line of nodes at the inner surface of the artery along the length of the vessel section.
| (9) |
where L is the characteristic length scale (the thickness of the wall in the deformed configuration). The Peclet-like number was used instead of the traditional Peclet number because vfr only gives an indication of pore fluid flow. When multiplying by bcf, the numerator becomes an indicator of the pore fluid flow that actually carries drug-surrogate with it, compared to the purely Brownian-motion driven transport of diffusion.
Results
Porohyperelastic Results.
LAD arteries presented higher stresses than RCA sections. In addition, the difference between the average stresses in the stented versus nonstented regions were not as pronounced in the LAD versus RCA arteries (Fig. 3). Stresses in LAD sections were on average 340% higher in the stented regions and 80% higher in the nonstented regions compared to the RCA counterparts. These were viewed as significant because the percent difference between the regions was higher than the observed variations in experimental errors in the measurements as reported in our previous studies (approximately 17%) [4]. Expectedly, stresses in the nonstented regions had higher standard deviations throughout all the elements since the nonstented region accounts for the gradient in stress between the native vessel and the deployed region. In addition, the stresses in the LAD were expected to be higher than the RCA regions because previous literature indicated the LAD arteries were more stiff. Strains showed a different trend with a less pronounced difference between the stented and nonstented region in addition to a smaller difference between arterial regions (less than 5% difference).
Fig. 3.
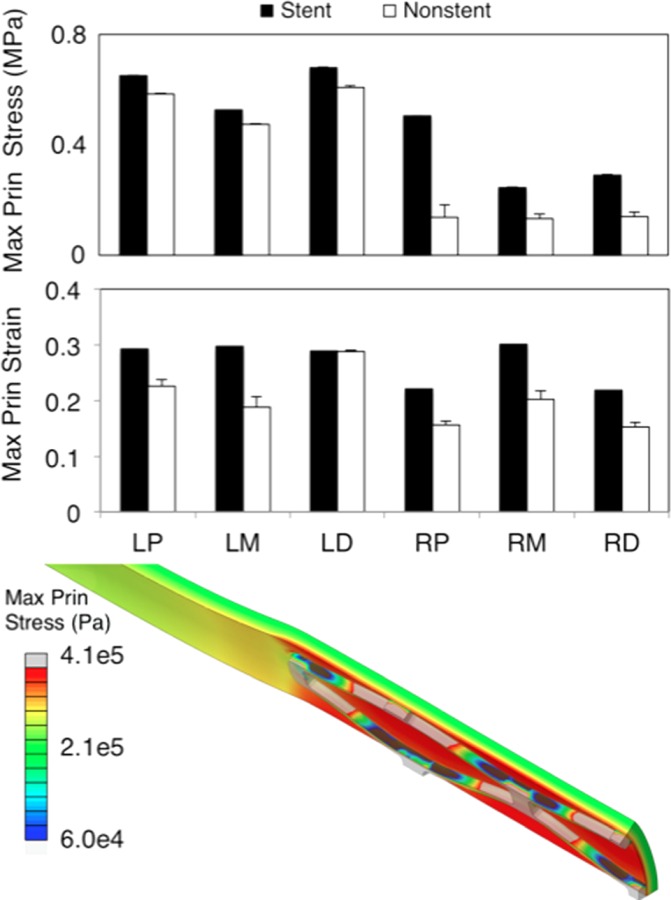
Mechanical metrics between section. Top is the maximum principal stress and bottom is the maximum principal strain. Values are averaged over all elements in either the stented or nonstented regions. Contour plot shows a representative maximum principal stress contour plot (in Pa) from a RCA proximal section.
Relative fluid velocities were, on average, 1.2 times larger in the LAD arteries, however, the standard deviations for the LADs were also larger than that for the RCAs (Fig. 4). Given that variations that occurred in experimental measurements were approximately 20%, this result is not as significant [4]. However, there were computational trends that existed in all regions. Peak velocity occurred for all sections at the end of the stented regions. Strut-contact regions will have a higher degree of radial compressive strain compared to between the struts. This result is especially relevant at the end of the stent. Higher degrees of compressive strain in the radial direction will reduce the characteristic length scale and increase the relative fluid velocity as governed by Darcy's law [26,27]. The middle region of both right and left arteries displayed a higher gradient in peak fluid velocity at the end of the stent than either the proximal or distal regions. All relative fluid velocity profiles were different between regions except between the RCA proximal and RCA distal regions, with only an offset along the length. A representative contour plot of vfr can be seen in Fig. 5(a).
Fig. 4.
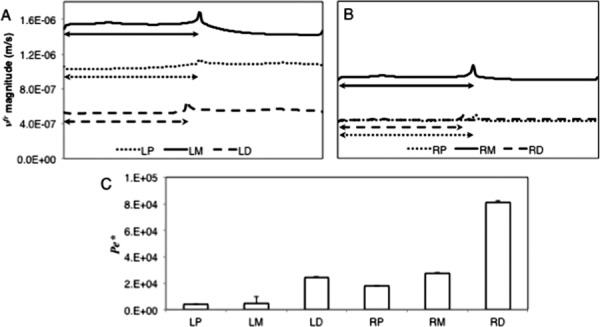
(a and b) vfr at line scan v along the length for the different vessel sections. The arrows represent the stented sections of the vessels. Lengths along the vessels are normalized. (c) is the Pecletlike number between arterial sections (Eq. (9)).
Fig. 5.
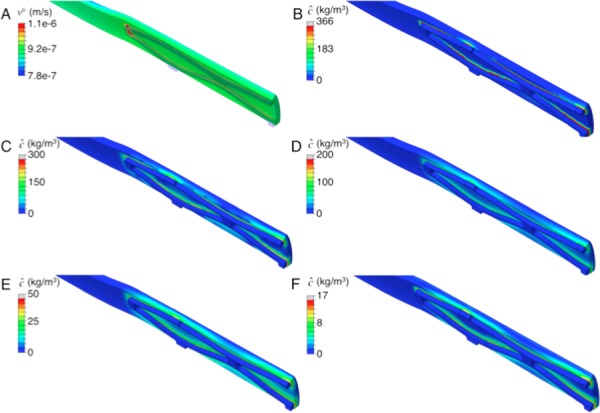
Representative vfr results (a), and concentration results at times of 18 (b), 36 (c), 72 (d), 126 (e), and 180 days (f). All contour plots are from RCA middle sections.
Using the Pe* metric, the RCA distal and middle regions were the most convection-dominated regions. The LAD proximal and middle regions were the most diffusion-dominated regions (Fig. 4(c)). In addition to these observations in the LAD sections, the RCA distal region has the smallest interstitial fluid velocity. Therefore, the ability of the fluid to transport the drug surrogate was more highly influenced by the pressure driven molecule transport in the RCA distal region.
Mass Transport Results.
Representative concentration contour plots may be seen in Figs. 5(b)–5(f) showing concentration over 180 days of elution. Transport was observed along with retention at focal (cellular) areas (spikes in the concentration profiles). Drug-surrogate was observed to move from the strut locations with more-luminal nodes increasing in concentration rapidly, presumably due to seeing higher concentrations of species eliciting a faster binding response. Eventually, concentration saturated through the thickness at strut locations within 60 days with complete spread between struts occurring at upwards of 180 days. While more-luminal nodes retained concentrations earlier in the analysis, species distribution was more homogenous at the end of the analysis. Between all regions, the iii regions had higher concentrations with a larger lateral spread of concentration (Fig. 6). Final concentrations for all arterial sections were on average 2.12 higher in the iii than the i regions. These differences were deemed relevant given that experimental variation as measured previously [16] in any given group were approximately18%.
Fig. 6.
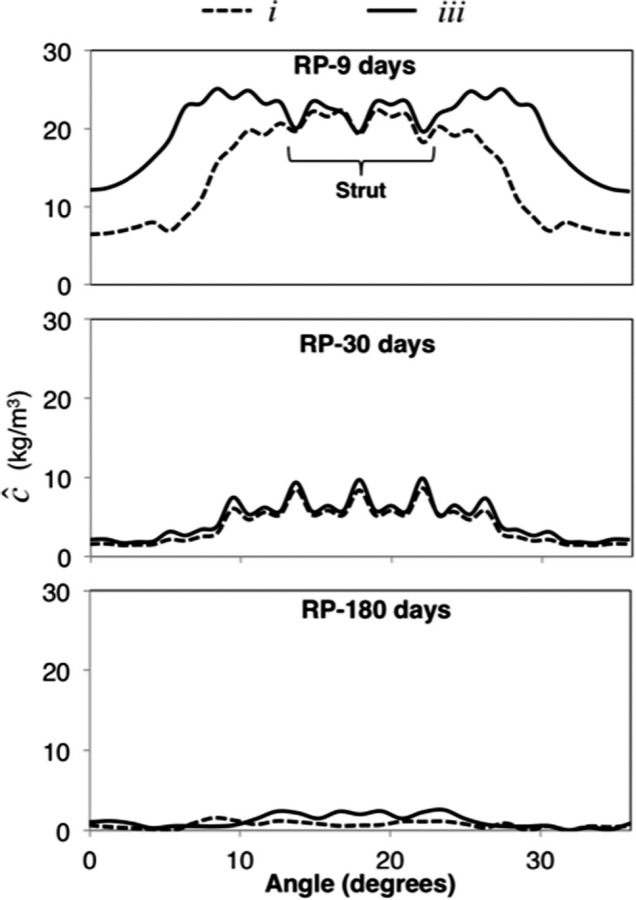
Representative concentration values for the i, and iii regions over time for a RCA middle section
Between arterial sections at earlier times (<nine days), RCA regions had higher concentrations with the RCA middle region having the highest concentration, and the LAD proximal region having the lowest (Fig. 7). Differences became more prevalent at times after 30 days. At 30 days the RCA middle section still had the highest concentrations, with the LAD distal region having the lowest concentrations. RCA regions having higher concentrations than LAD regions continued until about 90 days of elution. At 180 days final concentrations in the LAD distal regions had the highest concentration compared to the RCA distal region with the lowest. The difference between midstent and end-stent concentrations, at 180 days, was most substantial in the LAD middle region with a 2.1 kg/m3 difference (the next highest was the RCA middle regions with a 0.6 kg/m3 difference). Presumably, the LAD regions could have built up free and bound concentrations more slowly than their RCA counterparts due to the lower degree of convective influence (from the bcf values) since the diffusivity was not statistically different between the LAD and RCA arteries.
Fig. 7.
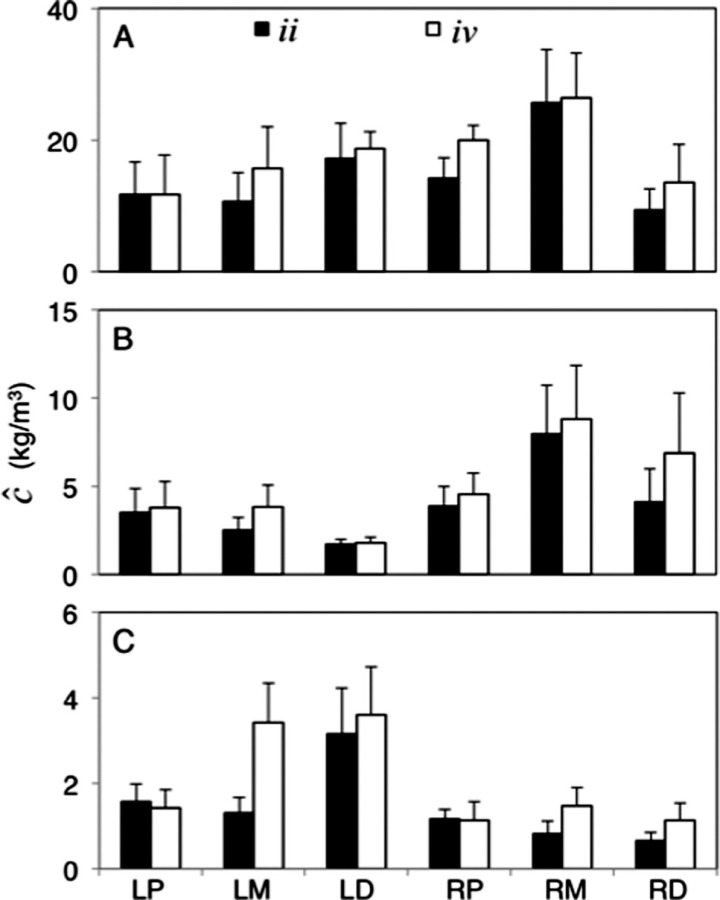
Average values 2over the ii and iv scans over times of 9, 30, and 180 days for (a), (b), and (c), respectively
When factoring in pulsatility, no differences were observed in concentration down to 1 × 10⁻⁹ kg/m3 for all time points. When eliminating binding sites, the concentration profiles showed an average difference of 31.2 ± 5.4 fold in the spread of molecules and a more than twofold difference in final retained concentrations, with the binding-included model having higher retained concentrations (Fig. 8).
Fig. 8.
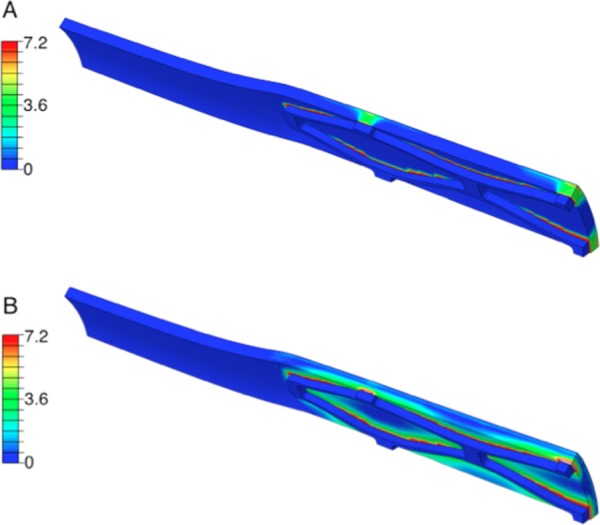
Representative concentration (kg/m3) contour plots for right middle sections for a noncell-binding model (a) and a cell-binding model (b)
Discussion
We showed in this study that variations exist in the mass transport of drug-surrogates between coronary arteries and along their length. This was done through the use of the porohyperelastic mass transport approach incorporating properties for LAD and RCA proximal, middle, and distal sections from one specific type of animal (barrow pigs of specific sizes and ages). In addition, we investigated the use or nonuse of the pulsatile and binding conditions on final distributions of pharmaceutical drug-surrogates.
The use of pulsatility in simulating transport had results that were not different in concentration when compared to the steady state concentration profile at all time points. This has been supported in previous literature for several biological scenarios [24,38]. This conclusion may not hold true if deformationally dependent properties are used, as previous work has shown changes in microstructure as a function of the pressure state. Incorporating cellular binding resulted in a significant difference in the retained concentration in the vascular wall. Between sections, differences in fluid transport through the porous artery varied between all sections except between the RCA proximal and distal sections with the middle LAD section having the highest vfr. When factoring differences in fluid transport into Peclet calculations, the RCA sections had higher convective influences due to the relative differences in the observed bcf values. For all sections, the middle of the stented region had higher average concentrations than the ends when examining circumferential distribution. Over the first half of the time course of elution, the RCA regions had higher concentrations of species, whereas near the end of elution, the LAD regions (in particular, the distal LAD) had the highest retained concentrations. The lower convective influences (via bcf) could potentially be a reason for this since diffusivities were not statistically different [16].
The study of coronary artery mass transport is a frequently reviewed topic due to its physiological severity and relevance. In particular, these studies are frequently focused on the biomechanical evaluation of the treatment of coronary artery disease. In evaluating the treatment of coronary artery disease, several researchers have used computational simulations to better understand the treatment environment (vessel, drug stent, balloon, etc.) [1,6,17,19–21,39–41]. The use of a sequential porohyperelastic mass transport approach has been used previously, for instance, in studies by Feenstra, et al. [17]. Our study is different from Ref. [17] in several ways: for instance properties were taken from one species on tests run by our research group, properties were built around previous in-laboratory software benchmarking [26], and the use of a coupling convection term in the transport of the molecule that has not been previously considered [16]. Mathematically, a coupling coefficient value of 0.01 would result in two orders of magnitude difference in convective transport flux via the second term on the right-hand side of Eq. (1), when using the coupling coefficient times permeability versus permeability alone. However, Feenstra et al. did include orthotropic effects as well as inclusion of the adventitia, which we were unable to include due to our experimental approach. Feenstra, et al. observed that the axial direction would have a deeper penetration, but in terms of the locations of peak pore fluid velocity and medial and adventitial accumulation, the Feenstra and Taylor study agreed with our general results. However, further comparisons of the results are not as applicable due to the use of completely different properties from different animal models, geometries, elution, and study focus.
The use of a reactivity term is a common method to implement drug retention, as has been previously demonstrated in animal experimentation and computational modeling [8,19]. We chose to implement binding on a local scale as opposed to using a bulk partition implementation scheme because our previous results using nonlinear microscopy (imaging of interstitial and cellular concentrations) were able to show localized areas for species accumulation [20]. Within our simulations, the observed concentration profiles did not contain detailed information that could not be captured utilizing a bulk response. This observation could be because smooth muscle cells account for a large degree of the constituents in the vascular wall [42].
Critical limitations of our study include the isotropy transport assumptions, geometry of the sections, material properties, and drug-elution characteristics. Regarding the vessel geometry, prismatic tubes were modeled since the mechanical and transport properties were quantified on relatively prismatic vessels. The coronary vasculature is nonprismatic down the lengths of each vessel. While the degree of taper in an individual third was less than 10%, the degree of curvature of the vessel (especially the RCA) could modify the results dramatically. In addition, curvature in the vasculature could influence changes through geometrical alterations. In previous reports of the properties, the vessels were deformed to be straight tubes and transport tested. While contour length to extended length did not vary by more than 10%, this 10% could be relevant. This is especially affected by our symmetry assumption. A future aspect of this work is to create testing fixtures that better match the in vivo geometry to determine if the curvature will affect transport. Related to this, the pulsatility of the heart would change the geometry to a further degree as related to the pulsatile cycle. Further studies into variations in geometrical homogeneity have been done previously, especially in regard to coronary hemodynamics studies [23,37]. These same techniques could be applied to our drug transport analyses.
While we did use properties that change along the lengths we made three assumptions that could change final in vivo observed concentrations: isotropy, homogeneity, and property gradients down the length. Since our previous studies reported properties that were isotropic for transport and orthotropic for solid mechanics, the isotropy assumption in transport was necessary, although other studies have reported variations in properties based on direction in the vascular wall [1,8]. The isotropy assumption has important ramifications, especially in conclusions drawn from the degree of axial penetration of the drug in relation to the stress transition zone. The gap between these two parameters would theoretically decrease given the inclusion of higher values of transport parameters in the axial and circumferential directions. Measuring properties along the length or circumferentially given techniques that were previously employed (nonlinear microscopy to measure interstitial fluorescent intensities) could be done in the future. In addition, the use of properties of a drug-surrogate, although similar to the pharmaceutical in many manners, could introduce error since transport properties were not exactly that of drug-eluting stent pharmaceuticals. We expect our conclusions to be relatively unaffected by this assumption since transport values were on the same order of magnitude as the pharmaceuticals. For similarities and differences between our drug surrogate and drug-eluting stent pharmaceuticals, see Ref. [16].
In addition, driving a computational model with porcine properties instead of human properties takes away from the clinical relevance. Pigs have been shown previously to be a good animal subject for preclinical translation [43,44]. A critical advantage of our experimentally driven computational study was that using a singular porcine model provides a laboratory-confirmable animal. However, without obtaining actual properties of humans and implementing the computational model with realistic geometry, we cannot state the exact clinical relevance. The purpose of our study was to identify the variations in transport and retention with a control (healthy) animal. A future aspect of our work is to obtain properties from animal models of the disease and human subjects.
The properties that were taken from our previous studies relied on averaging in each section (proximal, middle, or distal) to assume homogeneity. Previous work has shown that drug delivery in the vasculature can occur in a heterogeneous manner circumferentially [1]. Implementation of back-fitting methods to determine how these variations exist based on arterial location could better elucidate troublesome areas concerning cardiovascular complications to pharmaceutical therapies. In our study, we simulated regions as if the properties were homogeneous within a region, however, it is likely that the properties will change gradually along the arterial length [4]. Related to homogeneity, our assumption of homogenous release from the stent surface could result in clinical spatial variations in drug delivery, as has been shown previously [45]. In addition, nonhomogeneous polymer delamination over the stent surface could provide localized areas for a further degree of heterogeneity. Future wet-laboratory experimentation could be done on smaller sections or geometrical shifting of the tested areas could better elucidate how the properties change as a function of length. These data could provide researchers with even more detailed information regarding troublesome areas for cardiovascular pharmaceutical deployment. In addition, the length of the stent in the models was chosen to fit within the experimental sample window (i.e., no stent spanned multiple regions as split into three bins along the length of the coronary artery). In actuality, stents are frequently deployed that span multiple regions, although some clinical success has been suggested to occur with shorter stents [46]. Future studies with regard to multiregion stenting and how this could affect transport is currently being investigated in our laboratory.
Differences in our results to clinical observations in patient success could be attributed to several factors. For instance, we used a model of properties from a healthy pig with a relatively narrow demographic. In reality, plaque accumulation and disease-related remodeling can change properties. Baldwin, et al. reported that hydraulic conductivity would increase in hyperlipidemic cases and that atherosclerotic plaque did not augment this. Should this trend translate to each vessel segment, we would expect that segments with a higher convective influence will have a higher degree of transport, however, this could potentially be offset by the degree of vascular remodeling (70% in the same study) [47]. In addition, procedural characteristics like lesion-coverage, stent malposition, and balloon overdeployment have been shown to be partially responsible for restenosis [40].
Another source of potential variations can be determined from hemodynamics studies, as have been reported from Balakrishnan, et al. and Kolachalama, et al., among others [21–23,48]. In these studies flow patterns can vary circumferentially and alter distributions of proximal compared to distal drug distributions in-stent. These variations in flow patterns could be another source of location-dependent variations in transport that were unable to be captured by our study because pressures boundary conditions were imposed experimentally on prismatic tubes, and the porohyperelastic framework operates independently of the internal hemo-dynamic environment. We would expect even further axial distributions in this case, especially distally. The change in properties with respect to location may just be part of the variations that can exist in late-term lumen narrowing.
The mechanical environment has been suggested to have a role in vascular remodeling and, therefore, restenosis [49–51]. Specifically, previous studies have been able to determine that smooth muscle cells, in vitro, will respond with migration and proliferation under mechanical stimuli [52,53]. As expected, results indicated that peak stresses and strains occurred in the stented versus nonstented regions. However, the difference between the stented and nonstented areas was different based on arterial region. RCA regions had a generally larger difference in stress between the stented and nonstented areas (average of 2.5 times higher in the RCA versus LAD arteries). The LAD regions were 2.0 times higher in stress than the RCA regions without as large a difference between the stented and nonstented areas.
Higher strains than the native vessel exist 3.6 mm outside of the stented region on average. This distribution of strain indicates that smooth muscle cell migration and proliferation could occur outside of the stented region, as it has been previously described that the 5 mm region distal to the stent can experience restenosis [46,54]. With regard to drug transport in these regions: At earlier time points drugs are distributed in silico with low (<0.1 pg/ml) concentrations outside of the stented region. At 180 days, nano-gram concentrations are not observable past 2.6 mm away from the stent on average. These lower concentrations at the ends coupled with the level stress field could work synergistically to increase out-of-stent restenosis.
When coupling the biomechanical results to observations in drug delivery different deductions can be made regarding treatment. While mechanical states and concentrations profiles were different, the in-stent concentrations were relatively high even at 180 days compared to in vitro viable levels (∼1 × 10⁻⁶ kg/m3 for the inhibition of SMC migration and proliferation) [55]. However, without knowing the exact concentration in the wall needed to inhibit SMC migration and proliferation, the only conclusion that can be made is that certain regions are higher than others. When looking at concentrations relative to the amounts of stress, LAD sections maintained roughly equivalent values of stress between regions, with RCA sections having lower stresses down the length. Given that stresses were lower and concentrations were higher at all times up to 90 days in RCA regions, stent drug delivery may be more efficient in this region as compared to LAD vessels. When examining long-term results further, at 180 days LAD regions retained a higher concentration of drugs, however, given that previous studies have shown that peak smooth muscle cell proliferation occurs at 40 days, the higher concentrations at earlier time points (as exists in RCA sections) could be deemed as more critical to clinical success. These results indicate that it may be beneficial to have (1) concentrations that vary along the length and (2) different concentrations or elution characteristics based on the lesion location. In addition, drug delivery could be tuned to utilize different levels of hydrophobicity to tune the denominator (diffusion) of the Peclet-like number for the specific arterial section since it has been shown that different DES pharmaceuticals display different levels of hydrophobicity [56]. This can be especially relevant given the observed differences in vfr between regions. Regions with different vfr values could have drugs tuned based on convective transport to ensure proper pharmaceutical concentrations.
Conclusions
We have shown in this study that measured variations in porohyperelastic mass transport properties implemented into a computational model predicts differences in stress, strain, and concentration profiles between arterial sections. These variations show that throughout the entire time of drug elution RCA arteries undergo smaller stresses with higher concentrations prior to 90 days compared to the LAD arteries. In addition, LAD arteries are exposed to higher stresses with lower concentrations. Awareness of these differences between sections could allow for more personalized coronary intervention.
Acknowledgment
The authors would like to thank Dr. Timothy Secomb for his important scientific insight. The authors would also like to thank Dr. Michael Bruck and Dr. Lucy Carruthers for their help at the University of Arizona High Performance Computing facility. This work was supported, in parts, by an American Heart Association (AHA) Predoctoral Fellowship (11PRE7730024 to JTK), Achievement Rewards for College Scientific Scientists (ARCS; Mary Ann White Memorial Scholarship to JTK), and American Heart Association (AHA) Grant-in-Aid (10GRNT4580045 to JPVG).
Contributor Information
Joseph T. Keyes, Graduate Interdisciplinary Program in , Biomedical Engineering, , The University of Arizona, , P.O. Box 210240, , Tucson, AZ 85721 , e-mail: keyesj@email.arizona.edu
Bruce R. Simon, Department of Aerospace and , Mechanical Engineering, , The University of Arizona, , 1130 N Mountain Ave., , Tucson, AZ 85721 , e-mail: simonb@email.arizona.edu
Jonathan P. Vande Geest, Graduate Interdisciplinary Program in , Biomedical Engineering, , The University of Arizona, , P.O. Box 210240, , Tucson, AZ 85721;; Department of Aerospace and , Mechanical Engineering, , The University of Arizona, , 1130 N Mountain Ave., , Tucson, AZ 85721; Department of Biomedical Engineering, , The University of Arizona, , P.O. Box 210020, , Tucson, AZ 85721; BIO5 Institute for Biocollaborative Research, , The University of Arizona, , 1657 East Helen Street, , Tucson, AZ 85721 , e-mail: jpv1@email.arizona.edu
References
- [1]. Hwang, C. W. , Wu, D. , and Edelman, E. R. , 2001, “Physiological Transport Forces Govern Drug Distribution for Stent-Based Delivery,” Circulation, 104(5), pp. 600–605. 10.1161/hc3101.092214 [DOI] [PubMed] [Google Scholar]
- [2]. Hwang, C. W. , Wu, D. , and Edelman, E. R. , 2003, “Impact of Transport and Drug Properties on the Local Pharmacology of Drug-Eluting Stents,” Int. J. Cardiovasc. Interv., 5(1), pp. 7–12. Available at: http://web.mit.edu/hst-program/erelab/Publications/2003%20Papers/HwangImpactReview2003.pdf [DOI] [PubMed] [Google Scholar]
- [3]. Kang, S. J. , Mintz, G. S. , Park, D. W. , Lee, S. W. , Kim, Y. H. , Whan Lee, C. , Han, K. H. , Kim, J. J. , Park, S. W. , and Park, S. J. , 2011, “Mechanisms of In-Stent Restenosis After Drug-Eluting Stent Implantation: Intravascular Ultra-sound Analysis,” Circul. Cardiovasc. Interv., 4(1), pp. 9–14. 10.1161/CIRCINTERVENTIONS.110.940320 [DOI] [PubMed] [Google Scholar]
- [4]. Keyes, J. T. , Lockwood, D. R. , Simon, B. R. , and Vande Geest, J. P. , 2013, “Deformationally Dependent Fluid Transport Properties of Porcine Coronary Arteries Based on Location in the Coronary Vasculature,” J. Mech. Bev. Biomed. Mat., 17, pp. 296–306. 10.1016/j.jmbbm.2012.10.002 [DOI] [PMC free article] [PubMed] [Google Scholar]
- [5]. Levin, A. D. , Vukmirovic, N. , Hwang, C. W. , and Edelman, E. R. , 2004, “Specific Binding to Intracellular Proteins Determines Arterial Transport Properties for Rapamycin and Paclitaxel,” PNAS USA, 101(25), pp. 9463–9467. 10.1073/pnas.0400918101 [DOI] [PMC free article] [PubMed] [Google Scholar]
- [6]. Lovich, M. A. , Creel, C. , Hong, K. , Hwang, C. W. , and Edelman, E. R. , 2001, “Carrier Proteins Determine Local Pharmacokinetics and Arterial Distribution of Paclitaxel,” J. Pharm. Sci., 90(9), pp. 1324–1335. 10.1002/jps.1085 [DOI] [PubMed] [Google Scholar]
- [7]. Wan, W. K. , Lovich, M. A. , Hwang, C. W. , and Edelman, E. R. , 1999, “Measurement of Drug Distribution in Vascular Tissue Using Quantitative Fluorescence Microscopy,” J. Pharm. Sci., 88(8), pp. 822–829. 10.1021/js9803858 [DOI] [PubMed] [Google Scholar]
- [8]. Zhu, X. , Pack, D. W. , and Braatz, R. D. , 2012, “Modelling Intravascular Delivery From Drug-Eluting Stents With Biodurable Coating: Investigation of Anisotropic Vascular Drug Diffusivity and Arterial Drug Distribution,” Comput. Meth. Biomech. Biomed. Eng. (in press). [DOI] [PMC free article] [PubMed] [Google Scholar]
- [9]. Samady, H. , Eshtehardi, P. , McDaniel, M. C. , Suo, J. , Dhawan, S. S. , Maynard, C. , Timmins, L. H. , Quyyumi, A. A. , and Giddens, D. P. , 2011, “Coronary Artery Wall Shear Stress Is Associated With Progression and Transformation of Atherosclerotic Plaque and Arterial Remodeling in Patients With Coronary Artery Disease,” Circulation, 124(7), pp. 779–788. 10.1161/CIRCULATIONAHA.111.021824 [DOI] [PubMed] [Google Scholar]
- [10]. He, X. , and Ku, D. N. , 1996, “Pulsatile Flow in the Human Left Coronary Artery Bifurcation: Average Conditions,” ASME, J. Biomech. Eng., 118(1), pp. 74–82. 10.1115/1.2795948 [DOI] [PubMed] [Google Scholar]
- [11]. Krams, R. , Wentzel, J. J. , Oomen, J. A. , Vinke, R. , Schuurbiers, J. C. , de Feyter, P. J. , Serruys, P. W. , and Slager, C. J. , 1997, “Evaluation of Endothelial Shear Stress and 3D Geometry as Factors Determining the Development of Atherosclerosis and Remodeling in Human Coronary Arteries In Vivo. Combining 3D Reconstruction From Angiography and IVUS (ANGUS) With Computational Fluid Dynamics,” Arteriosc. Throm. Vasc. Biol., 17(10), pp. 2061–2065. 10.1161/01.ATV.17.10.2061 [DOI] [PubMed] [Google Scholar]
- [12]. Weydahl, E. S. , and Moore, J. E. , 2001, “Dynamic Curvature Strongly Affects Wall Shear Rates in a Coronary Artery Bifurcation Model,” J. Biomech., 34(9), pp. 1189–1196. 10.1016/S0021-9290(01)00051-3 [DOI] [PubMed] [Google Scholar]
- [13]. Plata, A. M. , Sherwin, S. J. , and Krams, R. , 2010, “Endothelial Nitric Oxide Production and Transport in Flow Chambers: The Importance of Convection,” Ann. Biomed. Eng., 38(9), pp. 2805–2816. 10.1007/s10439-010-0039-x [DOI] [PubMed] [Google Scholar]
- [14]. Tarbell, J. M. , 2003, “Mass Transport in Arteries and the Localization of Atherosclerosis,” Ann. Rev. Biomed. Eng., 5(1), pp. 79–118. 10.1146/annurev.bioeng.5.040202.121529 [DOI] [PubMed] [Google Scholar]
- [15]. O'Connell, B. M. , McGloughlin, T. M. , and Walsh, M. T. , 2010, “Factors That Affect Mass Transport From Drug Eluting Stents Into the Artery Wall,” Biomed. Eng. Online, 9(1), p. 15. 10.1186/1475-925X-9-15 [DOI] [PMC free article] [PubMed] [Google Scholar]
- [16]. Keyes, J. T. , Simon, B. R. , and Vande Geest, J. P. , 2012, “Location Dependent Coronary Artery Diffusive and Convective Mass Transport Properties of a Lipophilic Drug Surrogate Measured Using Nonlinear Microscopy,” Pharm. Res., 30(4), pp. 1147–1160. 10.1007/s11095-012-0950-y [DOI] [PMC free article] [PubMed] [Google Scholar]
- [17]. Feenstra, P. H. , and Taylor, C. A. , 2009, “Drug Transport in Artery Walls: A Sequential Porohyperelastic-Transport Approach,” Comput. Meth. Biomech. Biomed. Eng, 12(3), pp. 263–276. 10.1080/10255840802459396 [DOI] [PubMed] [Google Scholar]
- [18]. Wang, Z. , Sun, A. , Fan, Y. , and Deng, X. , 2012, “Comparative Study of Newtonian and Non-Newtonian Simulations of Drug Transport in a Model Drug-Eluting Stent,” Biorheology, 49(4), pp. 249–259. [DOI] [PubMed] [Google Scholar]
- [19]. Balakrishnan, B. , Dooley, J. F. , Kopia, G. , and Edelman, E. R. , 2007, “Intravascular Drug Release Kinetics Dictate Arterial Drug Deposition, Retention, and Distribution,” J. Control. Release, 123(2), pp. 100–108. 10.1016/j.jconrel.2007.06.025 [DOI] [PMC free article] [PubMed] [Google Scholar]
- [20]. Goriely, A. R. , Baldwin, A. L. , and Secomb, T. W. , 2007, “Transient Diffusion of Albumin in Aortic Walls: Effects of Binding to Medial Elastin Layers,” Am. J. Physiol., 292(5), pp. H2195–H2201. 10.1152/ajpheart.01294.2006 [DOI] [PubMed] [Google Scholar]
- [21]. Balakrishnan, B. , Tzafriri, A. R. , Seifert, P. , Groothuis, A. , Rogers, C. , and Edelman, E. R. , 2005, “Strut Position, Blood Flow, and Drug Deposition: Implications for Single and Overlapping Drug-Eluting Stents,” Circulation, 111(22), pp. 2958–2965. 10.1161/CIRCULATIONAHA.104.512475 [DOI] [PubMed] [Google Scholar]
- [22]. Kolachalama, V. B. , Levine, E. G. , and Edelman, E. R. , 2009, “Luminal Flow Amplifies Stent-Based Drug Deposition in Arterial Bifurcations,” PLoS One, 4(12), p. e8105. 10.1371/journal.pone.0008105 [DOI] [PMC free article] [PubMed] [Google Scholar]
- [23]. Kolachalama, V. B. , Tzafriri, A. R. , Arifin, D. Y. , and Edelman, E. R. , 2009, “Luminal Flow Patterns Dictate Arterial Drug Deposition in Stent-Based Delivery,” J. Control. Release, 133(1), pp. 24–30. 10.1016/j.jconrel.2008.09.075 [DOI] [PMC free article] [PubMed] [Google Scholar]
- [24]. Rappitsch, G. , and Perktold, K. , 1996, “Pulsatile Albumin Transport in Large Arteries: A Numerical Simulation Study,” ASME, J. Biomech. Eng., 118(4), pp. 511–519. 10.1115/1.2796038 [DOI] [PubMed] [Google Scholar]
- [25]. Vairo, G. , Cioffi, M. , Cottone, R. , Dubini, G. , and Migliavacca, F. , 2010, “Drug Release From Coronary Eluting Stents: A Multidomain Approach,” J. Biomech., 43(8), pp. 1580–1589. 10.1016/j.jbiomech.2010.01.033 [DOI] [PubMed] [Google Scholar]
- [26]. Vande Geest, J. P. , Simon, B. R. , Rigby, P. H. , and Newberg, T. P. , 2011, “Coupled Porohyperelastic Mass Transport (PHEXPT) Finite Element Models for Soft Tissues Using ABAQUS,” ASME, J. Biomech. Eng., 133(4), p. 044502. 10.1115/1.4003489 [DOI] [PubMed] [Google Scholar]
- [27]. Ayyalasomayajula, A. , Vande Geest, J. P. , and Simon, B. R. , 2010, “Porohyperelastic Finite Element Modeling of abdominal Aortic Aneurysms,” ASME, J. Biomech. Eng., 132(10), p. 104502. 10.1115/1.4002370 [DOI] [PubMed] [Google Scholar]
- [28]. Simulia, 2010, “Abaqus 6.98 Documentation,” Abaqus Theory Manual, D. Systemes, ed.France.
- [29]. Holzapfel, G. A. , and Weizsacker, H. W. , 1998, “Biomechanical Behavior of the Arterial Wall and Its Numerical Characterization,” Comput. Biol. Med., 28(4), pp. 377–392. 10.1016/S0010-4825(98)00022-5 [DOI] [PubMed] [Google Scholar]
- [30]. Medtronic, I. , 2012, “Resolute Integrity Zotarolimus-Eluting Coronary Stent System Over the Wire Delivery System: Instructions for Use.”
- [31]. Medtronic, I. , 2012, “FDA Summary of Safety and Effectiveness Data (SSED) PMA Number: P110013,” F. a. D. Administration, ed.
- [32]. Dirschinger, J. , Kastrati, A. , Neumann, F. J. , Boekstegers, P. , Elezi, S. , Mehilli, J. , Schuhlen, H. , Pache, J. , Alt, E. , Blasini, R. , Steinbeck, G. , and Schomig, A. , 1999, “Influence of Balloon Pressure During Stent Placement in Native Coronary Arteries on Early and Late Angiographic and Clinical Outcome: A Randomized Evaluation of High-Pressure Inflation,” Circulation, 100(9), pp. 918–923. 10.1161/01.CIR.100.9.918 [DOI] [PubMed] [Google Scholar]
- [33]. Meredith, I. T. , Worthley, S. , Whitbourn, R. , Walters, D. , Popma, J. , Cutlip, D. , and Fitzgerald, P. , 2007, “The Next-Generation Endeavor Resolute Stent: 4-Month Clinical and Angiographic Results From the Endeavor Resolute First-In-Man Trial,” EuroIntervention, 3(1), pp. 50–53. [PubMed] [Google Scholar]
- [34]. Meredith, I. T. , Ormiston, J. , Whitbourn, R. , Kay, I. P. , Muller, D. , Popma, J. J. , Cutlip, D. E. , and Fitzgerald, P. J. , 2007, “Four-Year Clinical Follow-Up After Implantation of the Endeavor Zotarolimus-Eluting Stent: ENDEAVOR I, The First-In-Human Study,” Am. J. Cardiol., 100(8B), pp. 56M–61M. 10.1016/j.amjcard.2007.08.023 [DOI] [PubMed] [Google Scholar]
- [35]. Seiler, C. , Fleisch, M. , Kaufmann, U. , and Meier, B. , 1997, “Measurements of Intracoronary Pressure and Blood Flow Velocity,” Praxis, 86(16), pp. 649–654. [PubMed] [Google Scholar]
- [36]. Seiler, C. , Kaufmann, U. , and Meier, B. , 1997, “Intracoronary Demonstration of Adenosine-Induced Coronary Collateral Steal,” Heart, 77(1), pp. 78–81. 10.1136/hrt.77.1.78 [DOI] [PMC free article] [PubMed] [Google Scholar]
- [37]. Huo, Y. , and Kassab, G. S. , 2006, “Pulsatile Blood Flow in the Entire Coronary Arterial Tree: Theory and Experiment,” Am. J. Physiol., 291(3), pp. H1074–H1087. 10.1152/ajpheart.00200.2006 [DOI] [PubMed] [Google Scholar]
- [38]. Ethier, C. R. , 2002, “Computational Modeling of Mass Transfer and Links to Atherosclerosis,” Ann. Biomed. Eng., 30(4), pp. 461–471. 10.1114/1.1468890 [DOI] [PubMed] [Google Scholar]
- [39]. Yang, C. , and Burt, H. M. , 2006, “Drug-Eluting Stents: factors Governing Local Pharmacokinetics,” Adv. Drug Del. Rev., 58(3), pp. 402–411. 10.1016/j.addr.2006.01.017 [DOI] [PubMed] [Google Scholar]
- [40]. Rogers, C. , Tseng, D. Y. , Squire, J. C. , and Edelman, E. R. , 1999, “Balloon-Artery Interactions During Stent Placement: A Finite Element Analysis Approach to Pressure, Compliance, and Stent Design as Contributors to Vascular Injury,” Circul. Res., 84(4), pp. 378–383. 10.1161/01.RES.84.4.378 [DOI] [PubMed] [Google Scholar]
- [41]. Hwang, C. W. , and Edelman, E. R. , 2002, “Arterial Ultrastructure Influences Transport of Locally Delivered Drugs,” Circul. Res., 90(7), pp. 826–832. 10.1161/01.RES.0000016672.26000.9E [DOI] [PubMed] [Google Scholar]
- [42]. Fischer, G. M. , and Llaurado, J. G. , 1966, “Collagen and Elastin Content in Canine Arteries Selected From Functionally Different Vascular Beds,” Circul. Res., 19(2), pp. 394–399. 10.1161/01.RES.19.2.394 [DOI] [PubMed] [Google Scholar]
- [43]. Swindle, M. M. , Horneffer, P. J. , Gardner, T. J. , Gott, V. L. , Hall, T. S. , Stuart, R. S. , Baumgartner, W. A. , Borkon, A. M. , Galloway, E. , and Reitz, B. A. , 1986, “Anatomic and Anesthetic Considerations in Experimental Cardiopulmo-nary Surgery in Swine,” Lab. Animal Sci., 36(4), pp. 357–361. [PubMed] [Google Scholar]
- [44]. Vilahur, G. , Padro, T. , and Badimon, L. , 2011, “Atherosclerosis and Thrombosis: Insights From Large Animal Models,” J. Biomed. Biotech., 2011, p. 907575. 10.1155/2011/907575 [DOI] [PMC free article] [PubMed] [Google Scholar]
- [45]. Denardo, S. J. , Carpinone, P. L. , Vock, D. M. , Batich, C. D. , and Pepine, C. J. , 2012, “Changes to Polymer Surface of Drug-Eluting Stents During Balloon Expansion,” JAMA, 307(20), pp. 2148–2150. 10.1001/jama.2012.4111 [DOI] [PMC free article] [PubMed] [Google Scholar]
- [46]. Wakabayashi, K. , Mintz, G. S. , Weissman, N. J. , Stone, G. W. , Ellis, S. G. , Grube, E. , Ormiston, J. A. , Turco, M. A. , Pakala, R. , Xue, Z. , Desale, S. , Laynez-Carnicero, A. , Romaguera, R. , Sardi, G. , Pichard, A. D. , and Waksman, R. , 2012, “Impact of Drug-Eluting Stents on Distal Vessels,” Circul. Cardiovasc. Interv., 5(2), pp. 211–219. 10.1161/CIRCINTERVENTIONS.111.965780 [DOI] [PubMed] [Google Scholar]
- [47]. Baldwin, A. L. , Wilson, L. M. , Gradus-Pizlo, I. , Wilensky, R. , and March, K. , 1997, “Effect of Atherosclerosis on Transmural Convection an Arterial Ultra-structure. Implications for Local Intravascular Drug Delivery,” Arteriosc. Throm. Vasc. Biol., 17(12), pp. 3365–3375. 10.1161/01.ATV.17.12.3365 [DOI] [PubMed] [Google Scholar]
- [48]. Lovich, M. A. , Philbrook, M. , Sawyer, S. , Weselcouch, E. , and Edelman, E. R. , 1998, “Arterial Heparin Deposition: Role of Diffusion, Convection, and Extravascular Space,” Am. J. Physiol., 275(6), pp. H2236–2242. [DOI] [PubMed] [Google Scholar]
- [49]. Boerckel, J. D. , Uhrig, B. A. , Willett, N. J. , Huebsch, N. , and Guldberg, R. E. , 2011, “Mechanical Regulation of Vascular Growth and Tissue Regeneration In Vivo,” PNAS USA, 108(37), pp. E674–E680. 10.1073/pnas.1107019108 [DOI] [PMC free article] [PubMed] [Google Scholar]
- [50]. Humphrey, J. D. , 2009, “Vascular Mechanics, Mechanobiology, and Remodeling,” J. Mech. Med. Biol., 9(2), pp. 243–257. 10.1142/S021951940900295X [DOI] [PMC free article] [PubMed] [Google Scholar]
- [51]. Cheng, J. K. , and Wagenseil, J. E. , 2012, “Extracellular Matrix and the Mechanics of Large Artery Development,” Biomech Model Mechanobiol., 11(8), pp. 1169–1186. 10.1007/s10237-012-0405-8 [DOI] [PMC free article] [PubMed] [Google Scholar]
- [52]. Gerthoffer, W. T. , 2007, “Mechanisms of Vascular Smooth Muscle Cell Migration,” Circul. Res., 100(5), pp. 607–621. 10.1161/01.RES.0000258492.96097.47 [DOI] [PubMed] [Google Scholar]
- [53]. Zhang, B. C. , Zhou, Z. W. , Li, X. K. , and Xu, Y. W. , 2011, “PI-3K/AKT Signal Pathway Modulates Vascular Smooth Muscle Cells Migration Under Cyclic Mechanical Strain,” VASA. Zeitschrift fur Gefasskrankheiten, 40(2), pp. 109–116. 10.1024/0301-1526/a000080 [DOI] [PubMed] [Google Scholar]
- [54]. Serruys, P. W. , Degertekin, M. , Tanabe, K. , Russell, M. E. , Guagliumi, G. , Webb, J. , Hamburger, J. , Rutsch, W. , Kaiser, C. , Whitbourn, R. , Camenzind, E. , Meredith, I. , Reeves, F. , Nienaber, C. , Benit, E. , Disco, C. , Koglin, J. , and Colombo, A. , 2004, “Vascular Responses at Proximal and Distal Edges of Paclitaxel-Eluting Stents: Serial Intravascular Ultrasound Analysis From the TAXUS II Trial,” Circulation, 109(5), pp. 627–633. 10.1161/01.CIR.0000112566.87022.32 [DOI] [PubMed] [Google Scholar]
- [55]. Poon, M. , Marx, S. O. , Gallo, R. , Badimon, J. J. , Taubman, M. B. , and Marks, A. R. , 1996, “Rapamycin Inhibits Vascular Smooth Muscle Cell Migration,” J. Clin. Invest., 98(10), pp. 2277–2283. 10.1172/JCI119038 [DOI] [PMC free article] [PubMed] [Google Scholar]
- [56]. Burke, S. E. , Kuntz, R. E. , and Schwartz, L. B. , 2006, “Zotarolimus (ABT-578) Eluting Stents,” Adv. Drug Del. Rev., 58(3), pp. 437–446. 10.1016/j.addr.2006.01.021 [DOI] [PubMed] [Google Scholar]
- [57]. Odahara, T. M. H. , and Chiba, A. , 2008, “Mechanical Properties of Biomedical Co-33Cr-5Mo-0.3N Alloy at Elevated Temperatures,” Mater. Trans., 49(9), pp. 1963–1969. 10.2320/matertrans.MAW200816 [DOI] [Google Scholar]