

Abstract
The mechanisms underlying the cellular entry of the HIV-1 Tat protein transduction domain (TatP) and the molecular information necessary to improve the transduction efficiency of TatP remain unclear due to the technical limitations for direct visualization of TatP's behavior in cells. Using confocal microscopy, total internal reflection fluorescence microscopy, and four-dimensional microscopy, we developed a single-molecule tracking assay for TatP labeled with quantum dots (QDs) to examine the kinetics of TatP initially and immediately before, at the beginning of, and immediately after entry into living cells. We report that even when the number of multivalent TatP (mTatP)-QDs bound to a cell was low, each single mTatP-QD first locally induced the cell's lateral transport machinery to move the mTatP-QD toward the center of the cell body upon cross-linking of heparan sulfate proteoglycans. The centripetal and lateral movements were linked to the integrity and flow of actomyosin and microtubules. Individual mTatP underwent lipid raft-mediated temporal confinement, followed by complete immobilization, which ultimately led to endocytotic internalization. However, bivalent TatP did not sufficiently promote either cell surface movement or internalization. Together, these findings provide clues regarding the mechanisms of TatP cell entry and indicate that increasing the valence of TatP on nanoparticles allows them to behave as cargo delivery nanomachines.
INTRODUCTION
Tat (trans-acting activator of transcription) crosses the cell membranes of living cells at low concentrations, and an 11-amino-acid region consisting of positively charged residues, known as the protein transduction domain (PTD), is responsible for Tat's membrane penetration (1–5).
When conjugated to Tat-PTD (TatP), various biologically active molecules, such as proteins, plasmids, short interfering RNAs, and nanoparticles, can serve as cargo both in vivo and in vitro (6, 7). Therefore, TatP and related peptides are envisaged as potentially attractive vectors for gene, protein, and drug therapy (1, 6–8). However, TatP-based technologies have some important limitations. For example, the transduction efficiency is greatly influenced by the characteristics of the target molecules, and in many cases, the efficacy has been insufficient even in in vitro applications (8, 9). Therefore, elucidating the mechanisms of TatP's cell entry is considered to be crucial for promoting its function as a cargo delivery vector. However, the pathway by which this peptide enters cells remains controversial (8, 10, 11). This controversy is partly a result of the lack of state-of-the-art techniques for directly visualizing the behavior of TatP.
Most early studies suggest that the translocation of TatP on the plasma membrane occurs via energy-independent direct penetration after a direct electrostatic interaction with the negatively charged plasma membrane (5, 10, 12). TatP does have direct biophysical effects on artificial model membranes composed of anionic lipids (13, 14); however, the anionic lipids are localized to the cytosolic face of the cell membranes of living cells, and the presence of anionic lipids on the outer leaflet occurs only when cells undergo apoptosis. TatP has also been shown to bind to many cellular polyanions via electrostatic interactions (11, 15), such as heparan sulfate (HS) proteoglycans (HSPGs) (11), RNA, and DNA (16). The binding affinity of TatP for HSPGs is greater than that for anionic lipids by 2 to 3 orders of magnitude (17). Furthermore, fixation artifacts have been identified in cell-based experiments using a fluorescently labeled TatP probe (18). Thus, the initial experiments that suggested that TatP undergoes direct cell surface translocation warrant reevaluation. In addition, there is increasing evidence suggesting that TatP initially electrostatically interacts with HSPGs, followed by adsorptive endocytic or macropinocytic internalization (19–21).
By taking advantage of the brightness and photostability of quantum dots (QDs) (22, 23), we have previously investigated the behavior of TatP labeled with QDs in living cells at a single-molecule resolution with high spatial accuracy (24, 25). In that study, by repeating short-period observations at different time points up to 15 min, we found (24, 25) that HSPGs serve as the cell surface receptors for TatP and that TatP-induced signaling may influence the kinetics of the TatP-HSPG complexes on living cells. However, we suspect that the detailed mechanisms of TatP cell surface movements and entry, as well as information that could be used to improve the transduction efficacy of TatP, cannot be fully elucidated solely by assembling serial short-period observations of the single-molecule kinetics of cell-bound TatP. Moreover, the molecular kinetics of TatP immediately before, at the beginning of, and immediately after internalization are not known.
In this study, we analyzed the molecular kinetics of TatP-QDs continuously for the initial 15 min after cell binding and before, at the beginning of, and after internalization using confocal microscopy (CM), total internal reflection fluorescence (TIRF) microscopy (TIRFM) (26–28), and four-dimensional (4D) (three dimensional [3D] plus time) microscopy (4DM) (29–31).
MATERIALS AND METHODS
Reagents.
Streptavidin (St)-QD655 and St-QD525 were purchased from Invitrogen (Carlsbad, CA). Unless otherwise specified, inhibitors of cellular proteins were purchased from Sigma-Aldrich (St. Louis, MO). The Rac-1 inhibitor NSC23766 was purchased from Calbiochem (San Diego, CA). The pAcGFP-actin and pAcGFP-tubulin vectors were purchased from Clontech (Palo Alto, CA). The pAcGFP-focal adhesion targeting (FAT) domain of focal adhesion kinase (32) was kindly provided by Masaaki Sato from Tohoku University.
Preparation of TatP-QDs.
The 11-amino-acid TatP sequence was synthesized (Toray, Osaka, Japan) as previously described (24). To label TatP with QDs, biotin-TatP was incubated with an St-QD (1 μM) at room temperature for 30 min at a TatP-to-St-QD molar ratio of 2 or 8. The labeled TatP-QD655 particles were designated bivalent (2-val) or multivalent (m) (Fig. 1A). The conjugated QDs were diluted in phenol red-free X-Vivo-10 buffer (Lonza, Walkersville, MD) for 45 min before the experiments.
Fig 1.

mTatP-QDs on the lamellipodial edge move centripetally via energy-dependent mechanisms. (A) Schematic comparison of bivalent (2 val) and multivalent (multival)-TatP-QDs initiating a downstream signaling cascade after binding to HSPGs. (B) Changes in the number of mTatP-QDs on the basal cell surface over time. Graph made from sequential TIRFM images at 2.5 Hz. (C and D) Selected CM frame (C), a phase-contrast image (C, inset), and maximum intensity projection (50 frames, 20 s) (D) of a HeLa cell exposed to 5 nM St-QDs. (E and F) Representative maximum intensity projections (50 frames, 20 s) for HeLa cells exposed to 30 pM mTatP-QDs and cultured with 10 U heparin (E) or treated with HS-lyase (F). Insets, phase-contrast images. (G) Phase-contrast and selected CM frames of a HeLa cell exposed to 30 pM mTatP-QDs. The marginal (green) and central (pink) areas of the cell are demarcated by color. (H) Typical time course of the numbers of mTatP-QDs bound to the total, marginal, and central areas. The arrow indicates mTatP-QD addition. (I) Representative maximum intensity projections (50 frames, 20 s) of mTatP-QDs. The lower panels are magnified images of the selected areas in the upper panels. Open and closed arrowheads indicate mTatP on the filopodia and mTatP moving centripetally on the basal cell surface, respectively. Panels C to I were from 2.5-Hz movies. (J) Representative TIRF micrograph of a HeLa cell expressing FAT domain-AcGFP. Arrowheads denote FAs. (K to M) Maximum intensity projections (200 frames, 20 s) of mTatP-QDs (30 pM) on HeLa cells cultured with 5 mM sodium azide (K) or at 8°C (L) and subsequently returned to 37°C (M). Panels K to M were from 10-Hz movies. Bars, 5 μm.
Cells, culture conditions, transfection, and drug treatments.
HeLa cells were obtained from the American Type Culture Collection (ATCC; Manassas, VA). The cells were cultured in minimal essential medium (MEM; Gibco, Carlsbad, CA) containing 10% fetal bovine serum (FBS) (Gibco) and 1% penicillin-streptomycin (Gibco) at 37°C in 5% CO2. The cells were detached and suspended at a concentration of 1 × 10⁵ cells/ml in phenol red-free MEM containing 10% FBS 24 h before the experiments. Subsequently, 30-μl aliquots were plated into 384-well microwell plates (Nalge Nunc, Naperville, IL) that had been coated with 33-fold-diluted phenol red-free Matrigel matrix (BD Bioscience, Bedford, MA) for 30 min, and then the cells were cultured overnight. One hour before the microscopy experiments, the culture medium was exchanged for phenol red-free X-Vivo-10 containing 4% FBS. The single-molecule microscopy experiments to visualize TatP-QDs were performed at 37°C.
The transfection of green fluorescent protein (GFP)-tagged expression vectors was performed using Fugene HD (Roche Applied Science, Mannheim, Germany) according to the manufacturer's instructions.
Cholesterol was partially depleted from the plasma membrane by incubating the cells in 4 mM methyl-β-cyclodextrin (24, 33). This treatment did not decrease the surface expression of HSPGs on HeLa cells, as previously described (24).
Single-particle tracking with CM or TIRFM and movement analysis.
Single-molecule CM imaging experiments were performed using an inverted microscope (IX-71; Olympus, Tokyo, Japan) equipped with an oil immersion objective lens (UPlanFLN; numerical aperture [NA] of 1.30; Olympus), a Nipkow-disk confocal unit (CSU10; Yokokawa, Tokyo, Japan), and an electron-multiplying charge-coupled device (EM-CCD) camera (iXon DV887; Andor Technology, Belfast, Northern Ireland), as described previously (24, 25, 34). For TIRFM imaging, an oil immersion objective lens (Apon60xOTIRF; NA of 1.49; Olympus) was used (27). Excitation was performed at 488 nm with solid-state lasers (Spectra-Physics, Mountain View, CA). Single-particle tracking and mean squared displacement (MSD) calculations were performed using G-Count software with a two-dimensional Gaussian fitting mode (G-Angstrom, Miyagi, Japan). The spatial precision of the x and y positions determined from a single QD on the glass surface was ∼7 nm, as previously described (24). We typically tracked 50 to 150 particles per cell, and we obtained the images from at least three independent experiments. We evaluated movements using a set of four analytical schemes: (i) trajectory analysis, (ii) velocity distributions, (iii) mean velocities, and (iv) MSD curves. The mean velocities and frequency distributions were first calculated for single cells and then averaged among cells treated under the same conditions. To calculate the diffusion coefficients (D) and velocities (V), the MSD values were estimated by fitting the first 10 points of the MSD curves using the following equations:
The D value was calculated using a custom program based on LabVIEW and Vision (National Instruments), as previously described (35).
The diffusion behaviors of mTatP-QDs on the ventral and dorsal membranes were similar (see Fig. S1 in the supplemental material) except for the initial binding of the mTatP-QDs, which was homogeneous on the dorsal surface.
4D single-molecule imaging and equations for single-particle tracking.
The microscope for 4D (3D plus time) imaging was identical to the confocal microscope described above except that the position of the objective lens (603PlanApo, 1.45 NA, oil; Olympus) was moved using a piezo actuator (FL301; Nanocontrol, Tokyo, Japan) with a feedback loop (NS202; Nanocontrol). A computer controlled the piezo actuator to synchronize the image acquisitions. The details of our 4D single-molecule imaging system have been described previously (29–31, 36). The 3D positions of individual particles as determined using a 3D Gaussian function and their trajectories were automatically created using a custom program, as described previously (29, 55).
Cellular uptake and imaging.
A solution of mTatP-QDs (30 pM or 3 pM) containing 3,3-dihexadecyloxacarbocyanine perchlorate (DiO) (5.0% [wt/vol] DiO in X-Vivo-10 with 4% FBS) was added to the cell culture. After exposure for 30 min, the cells were washed with X-Vivo-10 and then cultured with phenol red-free X-Vivo-10 containing 4% FBS. The initial localizations of the endosomes and mTatP-QDs were carefully observed using CM for 1.5 h. Next, the cells were fixed with 4% paraformaldehyde for 20 min for two-color imaging using CM. We did not notice any change in the cellular localizations of endosomes and mTatP-QDs before and after fixation.
RESULTS
Single-molecule imaging of mTatP-QDs on the surface of HeLa cells.
We have shown previously that the initial binding of TatP to cells occurs through the HS-glycosaminoglycan (GAG) chains of HSPGs on a wide variety of cells, such as HeLa cells; HepG2 cells; and T cells, B cells, and macrophages isolated from healthy donors (24). We have also reported that only multivalent TatP (mTatP)-QDs can induce the cross-linking of HSPGs and elicit a signal; in contrast, 2-val-TatP-QDs can bind to HSPGs but cannot induce the cross-linking of HSPGs or elicit intracellular signaling (Fig. 1A) (24). Thus, we employed mTatP-QDs and 2-val-TatP-QDs to study the influence of the HSPG cross-linking. In the present study, we used HeLa human carcinoma cells because this cell line is commonly used for studying TatP cell entry and for single-molecule-resolution imaging.
We collected movies using CM focused on the basal membrane with a frame rate of 2.5 Hz, and immediately after exposure of the cells to 30 pM mTatP-QDs, we observed fluorescent spots on the peripheral cell surfaces, including filopodia, slender cytoplasmic projections (37), and lamellipodia, sheet-like extensions of cytoplasm that form transient adhesions with the cell substrate (Fig. 1G and I) (38). The mTatP-QDs in the medium were not detectable as fluorescent spots because of the rapid Brownian motion in the solution. Meanwhile, in the absence of conjugated biotin-TatP, the St-QDs did not associate with the living cells at St-QD concentrations up to at least 5 nM (Fig. 1C and D). The fluorescent spots on the cell surface after exposure to 30 pM mTatP-QDs were completely absent after the addition of 10 U of heparin, a highly sulfated glycosaminoglycan (GAG) (Fig. 1E), or after the removal of the cellular HS-GAG chains with HS-lyase treatment (Fig. 1F). These results are consistent with our previous findings and confirm that the observed fluorescent spots on HeLa cells were due to mTatP-QDs bound to HSPGs through HS-GAG chains. When we examined the intensity and the nature of the “blinking” (39, 40) of QD spots during the first 2 min after exposure and compared these values with those of freshly prepared single QD samples, we noticed that the cell-bound QD spots exhibited fluorescence intensities and photocharacteristics similar to those of the single QD samples (data not shown). Therefore, under these conditions, we successfully visualized the movements of individual mTatP-QDs bound to cell surface HSPGs.
Single-QD imaging shows that mTatP bound to the marginal edge of the basal membrane initially undergoes centripetal movements.
After the addition of mTatP-QDs, the number of mTatP-QDs bound to the basal surface initially increased in the marginal area and then, over time, gradually increased in the central cell area (Fig. 1G and I). In contrast, mTatP-QDs were rapidly detected over the entire dorsal surface (data not shown). Thus, the QD particles (∼15 to 20 nm in hydrodynamic size) in solution or bound to the marginal basal surface might not readily enter the space between the basal membrane and the coverslip. Indeed, when we analyzed HeLa cells expressing AcGFP-fused FAT to mark focal adhesions (FAs; the substrate adhesion structures that anchor the ends of actin filaments to the substrates [38]) using TIRFM, we found that the entire basal membranes of HeLa cells formed stable adhesions to the coverslip through FAs (Fig. 1J). Similarly, when we analyzed AcGFP-actin-expressing HeLa cells using TIRFM, we observed that membranous actin spread across the glass surface (data not shown). These observations collectively indicate that HeLa cells tightly attach to the coverslip along the entire basal membrane and that mTatP-QDs that are in solution or bound to the marginal area of the basal surface cannot freely enter the space between the basal membrane and the coverslip.
Interactions between transmembrane proteins and the cytoskeleton and interactions between proteins within the membrane have been implicated in the regulation of the dynamics of surface molecules (33, 41). Similarly, endocytotic entry or translocation inside the cells also dramatically influences receptor dynamics (29, 35, 42). Therefore, it is essential to know how long the mTatP-QDs remain on the cell surface before being internalized. The selective visualization of the basal surfaces of cells exposed to 30 pM mTatP-QDs using TIRFM at 2.5 Hz revealed that the number of mTatP-QDs remaining on the basal surface did not significantly change between 7 and 15 min of observation (Fig. 1B). This result is similar to our previous finding that mTatP-QDs remain on the surface (24). This previous finding was based on an external medium accessibility test of cell-bound mTatP-QDs using an acute acid wash or a fluorescence resonance energy transfer dye. Therefore, almost all (∼99%) of the mTatP-QDs bound to a cell remain on the surface for at least 15 min after exposure to 30 pM mTatP-QDs.
When we analyzed mTatP-QDs on the basal membrane using CM at 2.5 Hz, we noticed that mTatP-QDs bound to the marginal edge initially moved centripetally and covered the entire basal surface at ∼6 min after exposure (Fig. 1G and I). When we quantitatively investigated the number of mTatP-QDs on the basal cell surface divided into two distinct areas, the central and marginal areas (Fig. 1G), we noticed that the number of mTatP-QDs in the marginal area initially increased rapidly and reached a plateau after ∼120 s of exposure (Fig. 1H). In contrast, the number of mTatP-QDs in the central area began to increase with a delay of ∼100 s. Similarly, the centripetal movement of mTatP-QDs can be visualized with a maximum intensity projection of 50 frames for every 20 s of mTatP-QD movement (Fig. 1I). Notably, the maximum intensity projections of the mTatP-QDs revealed a triangular shape with its vertex toward the center and its base toward the marginal area; there were also occasional linear streaks toward the center of the basal surface (Fig. 1I, closed arrowheads). Therefore, mTatP-QDs on the marginal edge initially moved as a whole toward the center of the basal surface; however, their movements were not uniform.
Single-QD imaging of mTatP-QDs on the basal surface with a higher frame rate.
To gain greater insight into mTatP's centripetal movements, we analyzed the trajectories of mTatP-QDs imaged using CM focused on the basal surface with a higher frame rate (10 Hz). The trajectories of the mTatP-QDs (Fig. 2B, second from the right) and their vectors for 8 s (Fig. 2B, right; red and black lines indicate QDs on lamellipodia and filopodia, respectively) and the maximum intensity projection for 16 s (Fig. 2B, second from the left) clearly demonstrated that the majority of the mTatP-QDs on the marginal edge initially moved toward the center of the cell. The analysis of the trajectories of individual mTatP-QDs for 90 s further revealed that the mTatP-QDs initially bound to the lamellipodia typically first moved toward the perinuclear region, followed by centrifugal movements toward the lamellipodia (Fig. 3A, trajectories 1 and 3). Similarly, mTatP-QDs initially bound to filopodia also first moved toward lamellipodia, followed by centripetal movements toward the perinuclear regions. Then, the particles moved centrifugally toward the lamellipodia (Fig. 3A, trajectory 2).
Fig 2.

Analysis of the mechanisms of the centripetal movement of TatP-QDs on lamellipodial edges. (A to G) Selected CM frames (left panels), representative maximum intensity projections (160 frames, 16 s) (second panels from the left), TatP-QD trajectories (8 s) (second panels from the right), and their vectors (right panels) on HeLa cells exposed to TatP-QDs with the indicated valence under different conditions. The images and trajectories were from 10-Hz movies. CM images of HeLa cells exposed to 300 pM 2-val-TatP-QDs (A) or 30 pM mTatP-QDs in the absence (B) and presence of 1 μM jasplakinolide (Jasp) (C), 50 μM blebbistatin (Bleb) (D), 10 mM nocodazole (Noc) (E), or 5 nM sodium azide (Azide) (G). CM images were also collected from HeLa cells exposed to 30 pM mTatP-QDs and cultured at 8°C (8°C) (F). The black and red arrows in the right panels indicate the QDs initially bound to the filopodia and lamellipodia, respectively. Bars, 5 μm. (H and I) Velocity distributions (H) and MSD curves (I) of TatP-QDs with the indicated valences on HeLa cells treated with the indicated drugs or cultured at 8°C. The mean velocities (±SEM) at 2.5 min after TatP exposure were 2.24 ± 0.01 μm/s (multival; n = 912), 1.66 ± 0.01 μm/s (2 val; n = 1,104, P < 10−3), 0.69 ± 0.01 μm/s (Jasp; n = 678, P < 10−4), 0.72 ± 0.01 μm/s (Bleb; n = 390, P < 10−4), 0.79 ± 0.01 μm/s (Noc; n = 183, P < 10−4), 1.62 ± 0.02 μm/s (Azide; n = 243, P < 10−3), and 1.08 ± 0.01 μm/s (8°C; n = 808, P < 10−4). The data were obtained from 10-Hz movies. *, P < 10−4. Error bars, SEM. The statistical significance was calculated with Dunnett's multiple comparison versus control.
Fig 3.

The movement of mTatP-QDs on the lamellipodial edge requires the integrity and flow of actomyosin and microtubules. (A to D) The entire trajectories of mTatP-QDs over 1.5 min on cells exposed to 30 pM mTatP-QDs in the absence (A) or presence of 1 μM jasplakinolide (B), 50 μM blebbistatin (C), or 10 mM nocodazole (D) are indicated by gray lines (left panels). Examples of representative trajectories are denoted with colors. The right panels are magnified images of the selected areas in the left panels. The accompanying arrows indicate the direction of movement. The trajectories were created from 10-Hz CM movies. (E) Representative maximum intensity projections for mTatP-QDs (600 frames, 1 min) recorded at 10 Hz. (F) The percentage of the area over which mTatP-QDs moved during 1 min was normalized to the entire cell surface area. HeLa cells were used in the absence (Cont) and presence of 0.3 or 1 μM jasplakinolide (Jasp), 10 or 50 μM blebbistatin (Bleb), 2 or 10 mM nocodazole (Noc), or 5 μM vinblastine (Vin). The data were from movies using ImageJ software. The values were first calculated for individual cells, and the results from three independent experiments performed under the same treatment conditions were averaged. Error bars, SEM. Bars, 5 μm. *, P < 10−5; **, P < 10−4. The statistical significance was calculated with Dunnett's multiple comparison versus control.
The initial centripetal movements of mTatP-QDs on the lamellipodial edge occur through an energy-dependent mechanism.
To determine whether the initial kinetics of mTatP-QDs on the basal surface are the result of an energy-dependent active process, we examined the mTatP-QDs' behavior on cells exposed to sodium azide (to partially deplete ATP) or cultured at 8°C. In cells exposed to 5 mM sodium azide (Fig. 1K) (43) or cultured at 8°C (Fig. 1L), mTatP-QDs bound to the marginal edge remained at a similar location even after 690 s of exposure and did not move centripetally. However, the brief exposure of the cells cultured at 8°C to 37°C led TatP to move centripetally (Fig. 1M). Similarly, the trajectories of the mTatP-QDs (Fig. 2F and G, second from the right) and their vectors for 8 s (Fig. 2F and G, right) or the maximum intensity projections for 16 s (Fig. 2F and G, second from the left; see the fixed points) in cells exposed to sodium azide or cultured at 8°C and observed at 10 Hz clearly demonstrated that the majority of the mTatP on the lamellipodia remained on the marginal edge and exhibited restricted movements.
For clear comparisons of the behaviors of mTatP under different conditions, we further calculated two parameters representing individual mTatP-QD movements, namely, the velocity and the MSD. The calculated velocities of individual mTatP-QDs were represented by the cumulative velocity frequency (Fig. 2H). The rightward shift of the distribution reflects an increase in the number of fast-moving molecules. The MSD values calculated for individual particle movements are presented here as plots of the MSD versus time (MSD curves, Fig. 2I). The slope of the MSD curve is proportional to the diffusion coefficient of the molecules, i.e., mobile molecules have larger MSD slopes. The cumulative velocity frequencies and the MSD curves of individual QDs clearly demonstrated that the movement of the mTatP-QDs was significantly restricted in cells exposed to 5 mM azide or cultured at 8°C (Fig. 2H and I). These observations collectively suggest that mTatP-QDs on the lamellipodial edge are initially transported centripetally by an energy-dependent process.
Each individual mTatP-QD locally induces an HSPG-mediated centripetal transportation mechanism.
To determine whether the movements of mTatP-QDs are linked to the activation of a cellular mechanism(s) induced by HSPG cross-linking, we examined the kinetics of 2-val-TatP-QDs. As shown in Fig. 2A, the trajectories of the 2-val-TatP-QDs (second from the right) and their vectors for 8 s (right) and the maximum intensity projection for 16 s (second from the left) revealed that 2-val-TatP-QDs did not move toward the center of the cell body. Similarly, the cumulative velocity frequency and the MSD curve of an individual 2-val-TatP-QD on the lamellipodial edge also demonstrated that there was significant restriction of the directional movements of 2-val-TatP-QDs (Fig. 2H and I). Therefore, these data support a model in which the initial centripetal movement of mTatP-QDs is induced by HSPG-mediated energy-dependent mechanisms. Furthermore, when we examined the kinetics of CXCR4, an unrelated membrane-bound protein, using a QD655-labeled anti-CXCR4 F(ab′)2 antibody (Ab) (12G5) in the presence and absence of 50 pM mTatP-QD525, we noticed that the anti-CXCR4 Ab initially bound to the marginal edge and remained in the marginal area for 10 min (data not shown). Similarly, the cumulative velocity frequency and MSD curve of CXCR4 did not differ between the mTatP-exposed and unexposed cells (see Fig. S2 in the supplemental material). Collectively, these data clearly demonstrate that mTatP-QDs, but not 2-val-TatP-QDs, induced an HSPG-mediated mTatP transportation mechanism(s); however, the transportation of TatP was not caused by the induction of general centripetal membranous flow.
mTatP-QDs on the lamellipodial edge initially move via the actomyosin-driven flow of the cortical network and microtubule-guided mechanisms.
By assembling short clips from movies, we previously found that the membrane cortical network regulates mTatP-QD/HSPG diffusion on the cell surface (24). Due to the initial radial nature of the movement of mTatP-QDs on the marginal edge of the basal membrane, we hypothesized that the centripetal mTatP movements were linked to the actomyosin-driven flow of the cortical network and/or to the movement of microtubule-guided motors or diffusion.
To test this hypothesis, we used pharmacological manipulators of cortical actin, myosin, and microtubules. We first examined whether these drugs influence the attachment of the cells to the coverslip. Because the highest level of traction stress between the basal membrane and the coverslip is located at FAs, we analyzed the effects of these drugs on cells expressing AcGFP-FAT using TIRFM (see Fig. S3 in the supplemental material). After 1 h of exposure to 1 μM jasplakinolide (an actin polymerization promoter) (44), 10 mM nocodazole (a microtubule inhibitor) (45), and 5 μM vinblastine (a microtubule inhibitor) (46), the size of the FAs was not significantly different from that of the untreated cells. In contrast, a 1-h exposure to 50 μM blebbistatin (a myosin II inhibitor) (47) significantly reduced the size of the FAs, and a 1-h exposure to 50 nM cytochalasin D (an actin inhibitor) (48) almost completely destroyed the FAs, and the treated cells attached to the coverslip only weakly (data not shown). These results indicate that exposure to the indicated concentrations of jasplakinolide, nocodazole, and vinblastine for 1 h had negligible effects on the attachment of cells to the coverslip. In contrast, blebbistatin influenced cell adhesion, and cytochalasin D markedly disrupted the stable cellular adhesion. Therefore, we used a relatively short exposure (for 10 min) to blebbistatin to test the role of myosin II, and jasplakinolide but not cytochalasin D exposure was employed to test the role of the actin meshwork in controlling the initial movements of TatP.
The treatment of the cells with 1 μM jasplakinolide to stabilize the existing actin structure almost completely suppressed the movement of mTatP on lamellipodia, which is clearly demonstrated by the trajectories (Fig. 2C, second from the right) and their vectors for 8 s (Fig. 2C, right, red lines), the maximum intensity projections for 16 s (Fig. 2C, second from the left; see the fixed points), the 90-s trajectories (Fig. 3B), and the cumulative velocity frequency and MSD curve of mTatP on lamellipodia (Fig. 2H and I). In contrast, a relatively short exposure to blebbistatin (50 μM for 10 min) to inhibit myosin II-based actin contraction significantly decreased the fraction of mTatP that moved toward the center in both the 8-s (Fig. 2D; compare the trajectories and their vectors of red lines to that in Fig. 2B) and 90-s (Fig. 3C; the trajectories are confined to the marginal edge) trajectories. The cumulative velocity frequency and MSD curve of mTatP on lamellipodia in blebbistatin-treated cells also demonstrated significantly restricted movements (Fig. 2H and I). Conversely, the depolymerization of microtubules completely abolished the movement of mTatP on the lamellipodial edge to the center, and the mTatP on filopodia moved across the junction between the base of the filopodia and the lamellipodia, as demonstrated by the trajectories and their vectors for 8 s (Fig. 2E, second from the right and farthest on the right), the maximum intensity projections for 16 s (Fig. 2E, second from the left), the 90-s trajectories (Fig. 3D), and the cumulative velocity frequency and MSD curve for the mTatP-QDs on the lamellipodial edge (Fig. 2H and I).
To confirm the results presented above, we used the maximum intensity projections of mTatP-QDs collected at 10 Hz for 600 frames (=1 min) to quantitatively analyze the range of the TatP movement. As shown in Fig. 3E and F, in untreated HeLa cells, the mTatP-QDs on the marginal edge moved to the basal surface within 7 min (93.2% ± 5.7% [standard error of the mean {SEM}] [n = 12] at times after 7 min). In contrast, when cortical actin was stabilized, myosin II-based actin contraction was inhibited, or microtubules were depolymerized, the centripetal movements of mTatP-QDs from the marginal edge were significantly suppressed (after 7 min, 20.2% ± 12.1% [SEM] [n = 6], 60.5% ± 4.3% [SEM] [n = 4], 26.7% ± 3.3% [SEM] [n = 5], and 25.8% ± 1.5% [SEM] [n = 4] for cells treated with jasplakinolide, blebbistatin, nocodazole, and vinblastine, respectively) (Fig. 3E and F). When the cells were treated with jasplakinolide, blebbistatin, or nocodazole, the level of suppression of mTatP-QD movement was proportional to the concentration of the drug (Fig. 3F). These results collectively demonstrate that the centripetal movements of mTatP-QDs on lamellipodia depend on the actomyosin-driven flow of the cortical network and/or on microtubule-guided motors or diffusion. Two-color imaging of mTatP-QDs and tubulin in fixed GFP-tubulin-expressing cells revealed that a significant fraction (48.25% ± 10.23% [standard deviation {SD}], n = 664 QDs on 12 cells) of the mTatP-QDs primarily colocalized with microtubules (8.24% ± 4.22% [SD; n = 209] of CXCR4, which is not associated with microtubules, colocalized with microtubules [P < 10−5] (see Fig. S4 in the supplemental material). However, regarding the induction of the initial lateral transport of mTatP-QDs, it can be hypothesized that intracellular signaling events are directly involved in this process. Alternatively, it can be hypothesized that the clustering of multiple surface HSPGs by mTatP-QDs increases the association with cytoskeletal structures or associated proteins to induce transportation by the preexisting actomyosin-driven flow of the cortical network. Future studies are needed to elucidate the detailed mechanism.
mTatP-QDs on filopodia are transported to the cell body by preexisting actin-guided mechanisms.
Although the initial movements of mTatP and 2-val-TatP on the lamellipodial edge were significantly different (Fig. 2A and B, red lines), their movements on filopodia appeared to be similar in the trajectory vector analysis (Fig. 2A and B, black lines). Therefore, we hypothesized that there are different molecular mechanisms involved in TatP transport on filopodia. Filopodia are thin, finger-like structures that are filled with tight parallel bundles of filamentous actin (37). Actin polymerizes at the barbed ends of the filaments located at the filopodial tip; therefore, the actin filaments within filopodia undergo a constant rearward movement toward the cell body, which is known as retrograde flow (31, 37, 49). Single QD tracking of the mTatP-QDs on filopodia at 10 Hz revealed rearward and forward directional movements along the filopodial shafts (Fig. 4A to C; see also Movie S1 in the supplemental material). Typically, mTatP-QDs bound at the base of the filopodia moved toward the tip of the filopodia with occasional stop-and-go motion. Once they reached the tip, the direction reversed (Fig. 4B, trajectories 1 and 3). These movements of mTatP-QDs on filopodia were significantly suppressed in cells cultured at 8°C and in cells exposed to 5 mM sodium azide, as clearly shown by the trajectories and mean diffusion coefficients (Fig. 4D and E and also Fig. 2F and D). However, 2-val-TatP on filopodia exhibited movements almost identical to those of mTatP at both 2.5 min and 7.5 min after exposure (Fig. 4D). These results demonstrate that TatP on filopodia are transported by energy-dependent mechanisms; however, the cross-linking of HSPGs is not essential to induce this mechanism.
Fig 4.
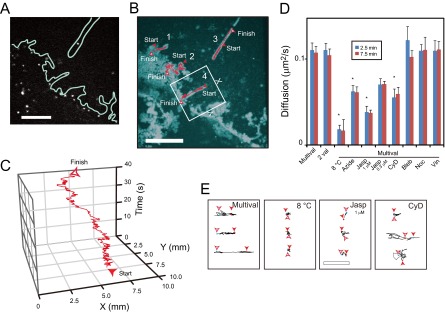
mTatP-QDs on filopodia move via preexisting actin-guided mechanisms. (A to C) Representative trajectories of mTatP-QDs on filopodia in cells exposed to 30 pM mTatP-QDs recorded at 10 Hz. Selected CM frame (A), maximum intensity projection and trajectories (B), and a typical position-over-time trajectory (selected area from panel B) (C). Also see Movie S1 in the supplemental material. (D and E) Effects of the TatP valence, culture temperature, and specific inhibitors on the movement of mTatP-QDs on filopodia. The mean diffusion coefficients (D) at 2.5 and 7.5 min after mTatP-QD exposure and representative trajectories (at 2.5 min after exposure for a 6-s observation, cell body on the right) (E) of 2-val- and multivalent-TatP on filopodia under the indicated conditions. Jasp, 0.3 or 1 μM jasplakinolide; Bleb, 50 μM blebbistatin; Noc, 10 mM nocodazole; Vin, 5 μM vinblastine; CyD, 50 nM cytochalasin D. *, P < 10−4. Error bars, SEM. Bars, 3 μm. The statistical significance was calculated with Dunnett's multiple comparison versus control.
Both stabilizing and disrupting actin with drugs significantly suppressed the movement of mTatP on filopodia, as shown by the trajectories and mean diffusion coefficients (Fig. 4D and E). In contrast, the suppression of myosin II activity and the depolymerization of microtubules had no effects on the movements of mTatP on filopodia (Fig. 4D and E). However, as revealed by mTatP-QD tracking (Fig. 3D, trajectories 14, 16, 17, and 19 to 21), QD movement at the junction between the base of the filopodia and the lamellipodia was significantly suppressed by nocodazole. Thus, mTatP-QDs on filopodia moved via actin-guided energy-dependent mechanisms, whereas a microtubule-linked mechanism is also involved in the movement of mTatP-QDs across the base of the filopodia to the cell body. The number of QDs on the filopodia was determined under various conditions, and both stabilizing actin and depolymerizing microtubules significantly increased the number of mTatP-QDs on each filopodium (see Fig. S5 in the supplemental material). In contrast, the suppression of myosin II activity had no impact. Along with the result that mTatP-QDs continuously bind to filopodia, these results indicate that the suppression of transportation results in an increase in the number of mTatP-QDs on filopodia.
The calculated mean velocities of the rearward and forward movements of mTatP-QDs were 0.70 ± 0.01 μm/s (±SEM, n = 42) and 0.69 ± 0.01 μm/s (±SEM, n = 38), respectively, and these values are much greater than the previously reported average rate of filopodial retrograde flow of ∼0.01 μm/s (49). Therefore, we assumed that both the forward and rearward movements of TatP-QDs on filopodia are likely linked to motor proteins that move along actin filaments, in agreement with the model proposed by Ruan et al. (50).
Single-QD visualization of mTatP entry into cells using TIRFM.
Next, we analyzed the molecular kinetics of TatP immediately before and at the beginning of entry using TIRFM. As shown in Fig. 5A, at 30 min after exposure, mTatP started to disappear from the cell surface. Because QDs blink, it can be difficult to distinguish true internalization from simple blinking-off when attempting to analyze the entry of individual mTatP-QDs using TIRFM. The total time during which a freshly prepared single QD655 spent in the off state during 30 s of observation with TIRFM was 6.32 ± 4.82 s (SD; n = 151). The shortest period in the blinking-off state of a single QD655 was 1.12 s (n = 151), and the longest single off period was 24.6 s (n = 151). Thus, we added a buffer corresponding to the longest blinking-off period, and we considered mTatP-QDs that disappeared for ≥60 s as internalized inside the cells. We found that the mTatP-QDs that had disappeared for ≥60 s remained visible by changing the focus to the internal site (data not shown). Therefore, utilizing this criterion, we could successfully identify the mTatP-QDs that were truly internalized.
Fig 5.

Single-molecule TIRFM imaging demonstrates the kinetics of mTatP-QDs immediately before and during internalization. (A) Changes in the number of mTatP molecules on the basal cell surface of HeLa cells from 28 min to 40 min after exposure to 30 pM mTatP-QDs. The graph was created from 2.5-Hz TIRFM movies. (B to E) Maximum intensity projection (800 frames, 320 s) (B), trajectory of mTatP-QDs for 320 s (C) or the indicated time interval (D), and velocity-versus-time plots (E). The data were obtained from 2.5-Hz TIRFM movies. Temporary confinements are marked with pink circles. The numbers of temporal immobilizations of the trajectories in panel E correspond to numbers in panel D. Bars, 5 μm. The mTatP-QDs repeatedly visited the same microdomains (see zones 3, 6, and 9 or 7 and 10). The arrow in panel E shows the moment at which the QDs disappeared from the TIRFM image. See Movie S2 in the supplemental material. (F to H) Maximum intensity projection (F) and typical trajectories of mTatP-QDs during prolonged immobilization (G) obtained from 2.5-Hz TIRFM micrographs. Selected TIRFM frames (H, top panels) and surface plots (H, bottom panels). The arrowheads indicate immobilized QDs. Bars, 5 μm. Fluorescence intensity-versus-time plots (I) of the indicated immobilized QDs. Oblique lines, change in the average intensities. See Movie S3 in the supplemental material.
Continuous recruitment to the membrane microdomains followed by immobilization is a precondition for mTatP-QD entry into the cell.
We have previously shown that mTatP but not 2-val-TatP exhibits significantly slower TatP diffusion ∼10 min after exposure (24). Indeed, the cumulative velocity frequency and the MSD curve of mTatP on the basal surface clearly demonstrate the slowing of mTatP-QD diffusion at ∼25 min after exposure (see Fig. S1 in the supplemental material). Therefore, after the initial centripetal movement, other, slower mechanisms of mTatP-QD movement are activated. We have previously reported (24) that the compartmentalization of mTatP-QD diffusion on the membrane is linked to membrane cortical actin matrix corrals, as proposed by Kusumi et al. (41), and that mTatP-QDs can trigger membrane actin reorganization and induce slower TatP diffusion. When analyzing the motions of mTatP-QDs at ∼25 min after exposure, we noticed that virtually all of them exhibited a distinct pattern of movement. Namely, the mTatP-QDs underwent simple diffusion and frequent temporal confinement. This movement continued before the particles were incorporated into the cells (see Fig. S6 in the supplemental material). Interestingly, when we analyzed the mTatP trajectory between 32 and 36 min after exposure, we found that the mTatP-QDs revisited the same microzones several times before becoming completely immobilized and entering the cell (see zones 3, 6, and 9 or zones 7 and 10 in Fig. 5B to D; also see Movie S2 in the supplemental material). The partial depolymerization of actin filaments by addition of 50 nM cytochalasin D at 7 min after mTatP exposure blocked the temporary confinement at 25 min after exposure (frequency of temporal confinement, 64.8% [n = 68] versus 4.1% [n = 72] for control and cytochalasin D exposure, respectively), suggesting that the mTatP-QDs cluster on actin filaments and/or actin-associated membrane microdomains. The partial depletion of cholesterol with 4 mM methyl-β-cyclodextrin at 7 min after exposure also blocked these temporary confinements at 25 min after exposure (frequency of temporal confinement, 7.4% [n = 54]), in agreement with the hypothesis that lipid rafts are both rich in cholesterol and associated with the cytoskeleton (51). Thus, the temporal confinements are most likely induced by the binding of mTatP-QDs to lipid raft microdomains. These temporary confinements persisted for nearly half of the total observation time, and the ratio of the duration of temporary confinement to the total time of diffusion was 1:1.93 (n = 68 for 120 s of observation) (Fig. 5E, results between 0 and 180 s). The actin compartments cover the entire cell membrane, and these compartments are separated by narrow fences that remain near the bilayer. Therefore, the distance between each sequential pause is not expected to be observed in the initial kinetics of mTatP-QDs on the basal cell surface. In fact, the pausing period of mTatP-QDs at 2 min after exposure is generally short, i.e., ∼0.46 s on average (n = 24). In contrast, the average temporary confinements of mTatP-QDs appeared to be longer than those corrals (7.83 s [n = 68]), and the distance between each confinement was larger, i.e., ∼423.24 nm (n = 68) on average. Surprisingly, the movement during the continuous simple diffusion periods and the temporal confinement of mTatP-QDs immediately before entry were very similar to the stimulation-induced temporary arrest of lateral diffusion (STALL) behavior exhibited by cross-linked CD59, a glycosylphosphatidylinositol-anchored receptor, as reported by Suzuki et al. (33). Notably, the STALL behavior of CD59 has a key function in converting the extracellular CD59 signal into an intracellular signal by recruiting the intracellular signaling molecules to the CD59 clusters when CD59 is transiently immobilized on a lipid raft (33). In fact, consistent with our previous report that the exposure of HeLa cells to mTatP-QDs induces Rac-1 membrane recruitment and activation (24), the exposure of HeLa cells to a Rac-1 inhibitor (NSC23766) at 50 μM (52) significantly suppressed the STALL-like behavior of mTatP-QDs (percent STALL-like behavior was reduced from 64.8% [n = 68] to 8.5% [n = 35] in NSC23766-exposed cells). Thus, the STALL-like behavior of mTatP could play a role in converting the HSPG-mediated signal into an intracellular signal by recruiting Rac-1 or other intracellular signaling molecules. However, further study is needed to confirm this hypothesis.
After this period of STALL-like behavior, the mTatP-QDs were completely immobilized, and the spot intensity decreased gradually (Fig. 5B to I; see also Movies S2 and S3 in the supplemental material), which is a typical feature of internalized QDs when observed by TIRFM. Of the QDs (n = 185) that were continuously observed for 8 min (∼29 min to 37 min after exposure), ∼75% (n = 139) were immobilized for ≥5 s (84.8 ± 62.3 s [SD], ranging from 15 to 176 s). Figure 5B to E presents the STALL-like movements followed by a long period of immobilization before entry (immobilization in zone 12 is shown in Fig. 5D, and the immobilization period before entry is shown in Fig. 5E). Figure 5F to I also presents longer periods of surface immobilization before entry (Fig. 5H and I; the immobilized spots accompanied the gradual decrease in intensity). For the remaining QDs, the periods of immobilization were short (6.4 ± 0.7 s [SD], n = 46), ranging from 5.2 to 8.5 s (see trajectories 1, 2, and 16 in Fig. S6 in the supplemental material). Collectively, these results suggest that STALL-like behavior is likely linked to the continuous recruitment of mTatP-QDs/HSPGs to lipid rafts, followed by immobilization, and is a precondition for entry into the cell. However, future studies are needed to confirm this hypothesis because inhibitors always simultaneously influence various pathways and the biophysical nature of cellular structures.
When examining the QD intensities inside a cell at 45 min after exposure to 30 pM mTatP-QDs using CM focused inside the cell, the fluorescence intensities of most of the internalized QDs (>82.54%, n = 154 [data not shown]; see also Fig. S6 in the supplemental material; among 22 spots, only spots 12, 13, and 14 showed any merging with others before being cointernalized) were similar to those of the freshly prepared single QDs. Thus, each mTatP-QD was individually incorporated inside the cell.
4D single mTatP-QD tracking revealed the unidirectional kinetics of internalized mTatP.
We then further analyzed the dynamics of QD internalization from the cell surface at 35 min after TatP exposure using our newly developed system of 4DM (3D plus time) for QD tracking (29–31). Automatic QD tracking is achieved by identifying the nearest neighbor with a similar QD particle intensity; however, the fluorescence intensity of a QD usually changes due to blinking. Therefore, if the number of QDs in an area is higher, a large number of QDs in the area may simultaneously change its fluorescent intensities. Thus, there is a high likelihood that the computer program will mistakenly identify the wrong QD in the subsequent frames. To avoid such errors and to track the movements of QDs using our 4DM method, the cells were exposed to 3 pM mTatP-QDs (∼24.3 mTatP-QDs/cell [n = 10] at 10 min after exposure). To observe the sequential TatP-QD internalization events in 3D, one set of nine confocal 3D images of the QDs was taken every 330 ms with 1.0-μm step movements of the objective. The 3D position of the fluorophore was calculated by fitting the fluorescence images in various focal planes with 3D Gaussian functions, as described previously (29, 30). We found that after 35 min of exposure, the TatP-QDs that completely stopped their random movements had been internalized and began unidirectional movement toward the nucleus with a velocity of 0.59 ± 0.09 μm/s (n = 12) (Fig. 6). In contrast, when we tracked the 2-val-TatP-QDs after 35 min of exposure, the QDs exhibited continuous random movements at the surface and were not internalized (data not shown). Collectively, these results confirm that after immobilization, each mTatP is individually internalized into the cell despite the low number of QDs bound to the surface; however, the 2-val-TatP-QDs did not exhibit this behavior.
Fig 6.
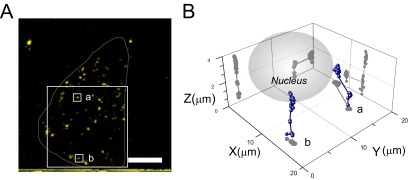
Single-molecule 4DM demonstrates the kinetics of mTatP-QDs immediately after internalization. (A) Stereomicrograph generated from 3D reconstructed images of mTatP-QDs on HeLa cells at 35 min after exposure to 3 pM mTatP-QDs. Use view glasses to see the 3D structure (left = red). (B) 3D trajectories of mTatP-QDs moving from the surface membrane to the nucleus. Two representative trajectories of mTatP-QDs from the selected areas in panel A are shown. The z axis corresponds to the line from the basal membrane to the nucleus, and the xy plane is parallel to the membrane. Bar, 10 μm.
mTatP-QDs enter the cells exclusively through endocytosis.
Using two-color imaging, we further investigated the TatP internalization pathway by observing mTatP-QDs on HeLa cells labeled with the green fluorescent dye DiO, a lipophilic dye that stains endosomes and related organelles (53). We found that all of the mTatP-QDs (99.7%, n = 378) colocalized with DiO-stained organelles with a spot size of 86.2 nm (n = 378) in diameter 2 h after exposure (Fig. 7A). Notably, the analysis of the fluorescence intensities of the mTatP-QDs revealed that 76.6% of the QDs that colocalized with the DiO-stained organelles were single mTatP-QDs (Fig. 7B). Given that all mTatP-QDs colocalized with DiO-stained organelles that had sizes typical of endosomes, these results undoubtedly suggest that each mTatP-QD is internalized from the cell surface exclusively through endocytosis.
Fig 7.

Colocalization of the endosome-tracking dye DiO and TatP-QDs. (A) Colocalization studies of mTatP-QDs (red) and an endosome-tracking dye (DiO, green) that were codelivered into HeLa cells for 2 h. Arrows indicate the representative TatP molecules that did not colocalize with the DiO-labeled vesicles. Bar, 10 μm. (B) Intensity histogram of TatP-QDs inside endosomes fitted to two Gaussian curves (top). The mean of the first peak corresponds to single mTatP-QDs (bottom), defined as q1.
The levels of centripetal and lateral TatP-QD transport depend on the valence of TatP but not on the number of TatP-QDs bound to the cell surface.
The data presented above indicate that initial centripetal movement and internalization occurred for mTatP-exposed cells but not 2-val-TatP-exposed cells. We then further examined whether the valence or the number of TatP-QDs per cell is the primary determinant inducing the initial centripetal and lateral movements and later endocytosis. We therefore examined the kinetics of TatP-QDs on the lamellipodial edge at 10 Hz in cells exposed to 3 or 30 pM mTatP-QDs; at these concentrations, the numbers of QD particles per cell after 10 min were 24.3 and 428.7 mTatP-QDs (n = 10), respectively. As shown by the trajectories, a significant portion of the mTatP-QDs moved centripetally and laterally on cells exposed to 3 pM (see trajectories 4, 5, 7, 8, 9, 11, and 14 in Fig. S7 in the supplemental material). The cumulative velocity frequencies and the MSD curves of QDs on the lamellipodial edge of cells exposed to 3 pM and 30 pM mTatP-QDs were almost identical (Fig. 8A, B, and D). In contrast, 300 pM 2-val-TatP-QDs, which results in 238.1 mTatP-QD particles per cell (n = 8) at 10 min, exhibited significantly restricted movements compared with those when using 30 pM mTatP-QDs at 5 min after exposure (Fig. 8C and D). Because the slowing of the movements of TatP is linked to actin reorganization and lipid rafts, these results collectively indicate that the critical determinant of the levels of centripetal transport, immobilization, and endocytosis of TatP-QDs is the valence of TatP and not the number of TatP-QDs bound to the cell surface.
Fig 8.
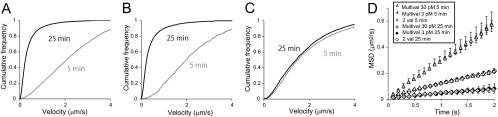
Effects of mTatP valence and the number of QDs/cell. (A to C) Velocity distributions of TatP on cells at 5 min and 25 min after exposure to 30 pM (A) or 3 pM (B) mTatP-QDs or 300 pM 2-val-TatP-QDs (C). (D) MSD curves on cells at 5 min and 25 min after exposure to the indicated conditions of TatP-QDs. The mean velocities (±SEM) were 2.16 ± 0.01 μm/s (30 pM mTatP for 5 min; n = 191), 2.13 ± 0.04 μm/s (3 pM mTatP for 5 min; n = 57, P = 0.96), 0.80 ± 0.01 μm/s (300 pM 2-val-TatP for 5 min; n = 251, P < 10−3), 0.18 ± 0.001 μm/s (30 pM mTatP for 25 min; n = 247), 0.15 ± 0.01 μm/s (3 pM mTatP for 25 min; n = 64, P = 0.94), and 0.72 ± 0.01 μm/s (300 pM 2-val-TatP for 5 min; n = 238, P < 10−4). The data were obtained from 10-Hz movies. The statistical significance was calculated with Dunnett's multiple comparison versus control.
DISCUSSION
In this study, we demonstrated that when eight TatP molecules (molecular formula, C70H155N35O28) were linked to each QD, the mTatP-QDs induced HSPG-mediated events at each site where QD was bound, even if there was a low number of QDs bound per cell; these events included initial energy-dependent centripetal transportation (Fig. 1 to 3 and 8) and later internalization (Fig. 5 to 7). Because the cellular structure and transport mechanisms are intertwined with each other in complex ways, it is insufficient to clearly explore their transportation mechanisms using inhibitors alone (38). Nonetheless, we found that the centripetal movements of mTatP-QDs on the lamellipodial edge are dependent on the actomyosin-driven flow of the cortical network and/or on microtubules (Fig. 2 and 3), and the transport of TatP on filopodia is linked to preexisting motor proteins that move along actin filaments (Fig. 4; schematic figures summarizing the results are shown in Fig. S8 in the supplemental material). These results clearly demonstrated that TatP transduction is energy dependent and that the triggering of HSPG-mediated events is necessary for efficient TatP endocytotic internalization. These results also indicate that the cross-linking of HSPGs influences the cellular transportation mechanisms of TatP-HSPGs at various levels.
Our findings here are strikingly consistent with those of previous studies (28, 54), in which the number of TatP molecules conjugated to nanoparticles influences cellular uptake and in which there is a threshold PTD-to-cargo ratio required for the cellular mechanism of particle uptake to become dominant, or multimeric target proteins tend to be more efficiently transduced into cells. Thus, we claim that when the number of TatP peptides linked per nanoparticle is increased to the correct number, those nanoparticles have the ability to behave as cargo delivery nanomachines. That is, each individual particle possesses the ability to induce local events to activate or link the cellular machinery, thus allowing each particle to move on the cell surface and be internalized. Utilizing multivalent TatP or related PTD peptides, we can invent a new type of drug delivery system that renders an individual cargo capable of efficiently binding to and entering cells regardless of the concentration. Thus, improving the multivalent PTD technology will lead to a novel drug delivery system for macromolecules that is extremely potent compared with the conventional methods. However, we have not yet determined which HSPGs are responsible for the cell surface binding and entry of TatP or whether the strength of the HSPG-mediated signal is linked to the efficiency of TatP endosomal release. Future studies should focus on these issues.
Supplementary Material
ACKNOWLEDGMENTS
Y.S. acknowledges the financial support from the Ministry of Health, Labor, and Welfare of Japan in the form of a grant-in-aid for AIDS research, from the Japanese Foundation for AIDS Prevention, and from the Ministry of Education, Culture, Sports, Science and Technology in the form of a Grant-in-Aid for Challenging Exploratory Research.
Footnotes
Published ahead of print 3 june 2013
Supplemental material for this article may be found at http://dx.doi.org/10.1128/MCB.01717-12.
REFERENCES
- 1.Fawell S, Seery J, Daikh Y, Moore C, Chen LL, Pepinsky B, Barsoum J. 1994. Tat-mediated delivery of heterologous proteins into cells. Proc. Natl. Acad. Sci. U. S. A. 91:664–668 [DOI] [PMC free article] [PubMed] [Google Scholar]
- 2.Frankel AD, Pabo CO. 1988. Cellular uptake of the tat protein from human immunodeficiency virus. Cell 55:1189–1193 [DOI] [PubMed] [Google Scholar]
- 3.Green M, Loewenstein PM. 1988. Autonomous functional domains of chemically synthesized human immunodeficiency virus Tat trans-activator protein. Cell 55:1179–1188 [DOI] [PubMed] [Google Scholar]
- 4.Nagahara H, Vocero-Akbani AM, Snyder EL, Ho A, Latham DG, Lissy NA, Becker-Hapak M, Ezhevsky SA, Dowdy SF. 1998. Transduction of full-length TAT fusion proteins into mammalian cells: TAT-p27Kip1 induces cell migration. Nat. Med. 4:1449–1452 [DOI] [PubMed] [Google Scholar]
- 5.Vives E, Brodin P, Lebleu B. 1997. A truncated HIV-1 Tat protein basic domain rapidly translocates through the plasma membrane and accumulates in the cell nucleus. J. Biol. Chem. 272:16010–16017 [DOI] [PubMed] [Google Scholar]
- 6.Koren E, Torchilin VP. 2012. Cell-penetrating peptides: breaking through to the other side. Trends Mol. Med. 18:385–393 [DOI] [PubMed] [Google Scholar]
- 7.Zorko M, Langel U. 2005. Cell-penetrating peptides: mechanism and kinetics of cargo delivery. Adv. Drug Deliv. Rev. 57:529–545 [DOI] [PubMed] [Google Scholar]
- 8.Chauhan A, Tikoo A, Kapur AK, Singh M. 2007. The taming of the cell penetrating domain of the HIV Tat: myths and realities. J. Control. Release 117:148–162 [DOI] [PMC free article] [PubMed] [Google Scholar]
- 9.Gump JM, Dowdy SF. 2007. TAT transduction: the molecular mechanism and therapeutic prospects. Trends Mol. Med. 13:443–448 [DOI] [PubMed] [Google Scholar]
- 10.Lundberg P, Langel U. 2003. A brief introduction to cell-penetrating peptides. J. Mol. Recognit. 16:227–233 [DOI] [PubMed] [Google Scholar]
- 11.Ziegler A. 2008. Thermodynamic studies and binding mechanisms of cell-penetrating peptides with lipids and glycosaminoglycans. Adv. Drug Deliv. Rev. 60:580–597 [DOI] [PubMed] [Google Scholar]
- 12.Herce HD, Garcia AE. 2007. Molecular dynamics simulations suggest a mechanism for translocation of the HIV-1 TAT peptide across lipid membranes. Proc. Natl. Acad. Sci. U. S. A. 104:20805–20810 [DOI] [PMC free article] [PubMed] [Google Scholar]
- 13.Mishra A, Gordon VD, Yang L, Coridan R, Wong GC. 2008. HIV TAT forms pores in membranes by inducing saddle-splay curvature: potential role of bidentate hydrogen bonding. Angew. Chem. Int. Ed. Engl. 47:2986–2989 [DOI] [PubMed] [Google Scholar]
- 14.Ziegler A, Blatter XL, Seelig A, Seelig J. 2003. Protein transduction domains of HIV-1 and SIV TAT interact with charged lipid vesicles. Binding mechanism and thermodynamic analysis. Biochemistry 42:9185–9194 [DOI] [PubMed] [Google Scholar]
- 15.Pujals S, Fernandez-Carneado J, Lopez-Iglesias C, Kogan MJ, Giralt E. 2006. Mechanistic aspects of CPP-mediated intracellular drug delivery: relevance of CPP self-assembly. Biochim. Biophys. Acta 1758:264–279 [DOI] [PubMed] [Google Scholar]
- 16.Ziegler A, Seelig J. 2007. High affinity of the cell-penetrating peptide HIV-1 Tat-PTD for DNA. Biochemistry 46:8138–8145 [DOI] [PubMed] [Google Scholar]
- 17.Ziegler A, Seelig J. 2004. Interaction of the protein transduction domain of HIV-1 TAT with heparan sulfate: binding mechanism and thermodynamic parameters. Biophys. J. 86:254–263 [DOI] [PMC free article] [PubMed] [Google Scholar]
- 18.Richard JP, Melikov K, Vives E, Ramos C, Verbeure B, Gait MJ, Chernomordik LV, Lebleu B. 2003. Cell-penetrating peptides—a reevaluation of the mechanism of cellular uptake. J. Biol. Chem. 278:585–590 [DOI] [PubMed] [Google Scholar]
- 19.Goncalves E, Kitas E, Seelig J. 2005. Binding of oligoarginine to membrane lipids and heparan sulfate: structural and thermodynamic characterization of a cell-penetrating peptide. Biochemistry 44:2692–2702 [DOI] [PubMed] [Google Scholar]
- 20.Kaplan IM, Wadia JS, Dowdy SF. 2005. Cationic TAT peptide transduction domain enters cells by macropinocytosis. J. Control. Release 102:247–253 [DOI] [PubMed] [Google Scholar]
- 21.Wadia JS, Stan RV, Dowdy SF. 2004. Transducible TAT-HA fusogenic peptide enhances escape of TAT-fusion proteins after lipid raft macropinocytosis. Nat. Med. 10:310–315 [DOI] [PubMed] [Google Scholar]
- 22.Jaiswal JK, Mattoussi H, Mauro JM, Simon SM. 2003. Long-term multiple color imaging of live cells using quantum dot bioconjugates. Nat. Biotechnol. 21:47–51 [DOI] [PubMed] [Google Scholar]
- 23.Medintz IL, Uyeda HT, Goldman ER, Mattoussi H. 2005. Quantum dot bioconjugates for imaging, labelling and sensing. Nat. Mater. 4:435–446 [DOI] [PubMed] [Google Scholar]
- 24.Imamura J, Suzuki Y, Gonda K, Roy CN, Gatanaga H, Ohuchi N, Higuchi H. 2011. Single particle tracking confirms that multivalent Tat protein transduction domain-induced heparan sulfate proteoglycan cross-linkage activates Rac1 for internalization. J. Biol. Chem. 286:10581–10592 [DOI] [PMC free article] [PubMed] [Google Scholar]
- 25.Suzuki Y. 2012. Exploring transduction mechanisms of protein transduction domains (PTDs) in living cells utilizing single-quantum dot tracking (SQT) technology. Sensors (Basel) 12:549–572 [DOI] [PMC free article] [PubMed] [Google Scholar]
- 26.Axelrod D. 2003. Total internal reflection fluorescence microscopy in cell biology. Methods Enzymol. 361:1–33 [DOI] [PubMed] [Google Scholar]
- 27.Fujita H, Hatakeyama H, Watanabe TM, Sato M, Higuchi H, Kanzaki M. 2010. Identification of three distinct functional sites of insulin-mediated GLUT4 trafficking in adipocytes using quantitative single molecule imaging. Mol. Biol. Cell 21:2721–2731 [DOI] [PMC free article] [PubMed] [Google Scholar]
- 28.Sung M, Poon GM, Gariepy J. 2006. The importance of valency in enhancing the import and cell routing potential of protein transduction domain-containing molecules. Biochim. Biophys. Acta 1758:355–363 [DOI] [PubMed] [Google Scholar]
- 29.Watanabe TM, Higuchi H. 2007. Stepwise movements in vesicle transport of HER2 by motor proteins in living cells. Biophys. J. 92:4109–4120 [DOI] [PMC free article] [PubMed] [Google Scholar]
- 30.Watanabe TM, Sato T, Gonda K, Higuchi H. 2007. Three-dimensional nanometry of vesicle transport in living cells using dual-focus imaging optics. Biochem. Biophys. Res. Commun. 359:1–7 [DOI] [PubMed] [Google Scholar]
- 31.Watanabe TM, Tokuo H, Gonda K, Higuchi H, Ikebe M. 2010. Myosin-X induces filopodia by multiple elongation mechanism. J. Biol. Chem. 285:19605–19614 [DOI] [PMC free article] [PubMed] [Google Scholar]
- 32.Mitra SK, Hanson DA, Schlaepfer DD. 2005. Focal adhesion kinase: in command and control of cell motility. Nat. Rev. Mol. Cell Biol. 6:56–68 [DOI] [PubMed] [Google Scholar]
- 33.Suzuki KG, Fujiwara TK, Sanematsu F, Iino R, Edidin M, Kusumi A. 2007. GPI-anchored receptor clusters transiently recruit Lyn and G alpha for temporary cluster immobilization and Lyn activation: single-molecule tracking study 1. J. Cell Biol. 177:717–730 [DOI] [PMC free article] [PubMed] [Google Scholar]
- 34.Yoo J, Kambara T, Gonda K, Higuchi H. 2008. Intracellular imaging of targeted proteins labeled with quantum dots. Exp. Cell Res. 314:3563–3569 [DOI] [PubMed] [Google Scholar]
- 35.Hatakeyama H, Kanzaki M. 2011. Molecular basis of insulin-responsive GLUT4 trafficking systems revealed by single molecule imaging. Traffic 12:1805–1820 [DOI] [PubMed] [Google Scholar]
- 36.Gonda K, Watanabe TM, Ohuchi N, Higuchi H. 2010. In vivo nano-imaging of membrane dynamics in metastatic tumor cells using quantum dots. J. Biol. Chem. 285:2750–2757 [DOI] [PMC free article] [PubMed] [Google Scholar]
- 37.Mattila PK, Lappalainen P. 2008. Filopodia: molecular architecture and cellular functions. Nat. Rev. Mol. Cell Biol. 9:446–454 [DOI] [PubMed] [Google Scholar]
- 38.Parsons JT, Horwitz AR, Schwartz MA. 2010. Cell adhesion: integrating cytoskeletal dynamics and cellular tension. Nat. Rev. Mol. Cell Biol. 11:633–643 [DOI] [PMC free article] [PubMed] [Google Scholar]
- 39.Biju V, Itoh T, Ishikawa M. 2010. Delivering quantum dots to cells: bioconjugated quantum dots for targeted and nonspecific extracellular and intracellular imaging. Chem. Soc. Rev. 39:3031–3056 [DOI] [PubMed] [Google Scholar]
- 40.Pinaud F, Clarke S, Sittner A, Dahan M. 2010. Probing cellular events, one quantum dot at a time. Nat. Methods 7:275–285 [DOI] [PubMed] [Google Scholar]
- 41.Kusumi A, Nakada C, Ritchie K, Murase K, Suzuki K, Murakoshi H, Kasai RS, Kondo J, Fujiwara T. 2005. Paradigm shift of the plasma membrane concept from the two-dimensional continuum fluid to the partitioned fluid: high-speed single-molecule tracking of membrane molecules. Annu. Rev. Biophys. Biomol. Struct. 34:351–378 [DOI] [PubMed] [Google Scholar]
- 42.Saxton MJ, Jacobson K. 1997. Single-particle tracking: applications to membrane dynamics. Annu. Rev. Biophys. Biomol. Struct. 26:373–399 [DOI] [PubMed] [Google Scholar]
- 43.Kang J, Heart E, Sung CK. 2001. Effects of cellular ATP depletion on glucose transport and insulin signaling in 3T3-L1 adipocytes. Am. J. Physiol. Endocrinol. Metab. 280:E428–E435 [DOI] [PubMed] [Google Scholar]
- 44.Bubb MR, Senderowicz AM, Sausville EA, Duncan KL, Korn ED. 1994. Jasplakinolide, a cytotoxic natural product, induces actin polymerization and competitively inhibits the binding of phalloidin to F-actin. J. Biol. Chem. 269:14869–14871 [PubMed] [Google Scholar]
- 45.Hoebeke J, Van Nijen G, De Brabander M. 1976. Interaction of oncodazole (R 17934), a new antitumoral drug, with rat brain tubulin. Biochem. Biophys. Res. Commun. 69:319–324 [DOI] [PubMed] [Google Scholar]
- 46.Jordan MA, Himes RH, Wilson L. 1985. Comparison of the effects of vinblastine, vincristine, vindesine, and vinepidine on microtubule dynamics and cell-proliferation in vitro. Cancer Res. 45:2741–2747 [PubMed] [Google Scholar]
- 47.Straight AF, Cheung A, Limouze J, Chen I, Westwood NJ, Sellers JR, Mitchison TJ. 2003. Dissecting temporal and spatial control of cytokinesis with a myosin II inhibitor. Science 299:1743–1747 [DOI] [PubMed] [Google Scholar]
- 48.Cooper JA. 1987. Effects of cytochalasin and phalloidin on actin. J. Cell Biol. 105:1473–1478 [DOI] [PMC free article] [PubMed] [Google Scholar]
- 49.Mallavarapu A, Mitchison T. 1999. Regulated actin cytoskeleton assembly at filopodium tips controls their extension and retraction. J. Cell Biol. 146:1097–1106 [DOI] [PMC free article] [PubMed] [Google Scholar]
- 50.Ruan G, Agrawal A, Marcus AI, Nie S. 2007. Imaging and tracking of tat peptide-conjugated quantum dots in living cells: new insights into nanoparticle uptake, intracellular transport, and vesicle shedding. J. Am. Chem. Soc. 129:14759–14766 [DOI] [PubMed] [Google Scholar]
- 51.Allen JA, Halverson-Tamboli RA, Rasenick MM. 2007. Lipid raft microdomains and neurotransmitter signalling. Nat. Rev. Neurosci. 8:128–140 [DOI] [PubMed] [Google Scholar]
- 52.Gao Y, Dickerson JB, Guo F, Zheng J, Zheng Y. 2004. Rational design and characterization of a Rac GTPase-specific small molecule inhibitor. Proc. Natl. Acad. Sci. U. S. A. 101:7618–7623 [DOI] [PMC free article] [PubMed] [Google Scholar]
- 53.Duan HW, Nie SM. 2007. Cell-penetrating quantum dots based on multivalent and endosome-disrupting surface coatings. J. Am. Chem. Soc. 129:3333–3338 [DOI] [PubMed] [Google Scholar]
- 54.Lewin M, Carlesso N, Tung CH, Tang XW, Cory D, Scadden DT, Weissleder R. 2000. Tat peptide-derivatized magnetic nanoparticles allow in vivo tracking and recovery of progenitor cells. Nat. Biotechnol. 18:410–414 [DOI] [PubMed] [Google Scholar]
- 55.Hatakeyama H, Kanzaki M. 2013. Regulatory mode shift of Tbc1d1 is required for acquisition of insulin-responsive GLUT4-trafficking activity. Mol. Biol. Cell 24:809–817 [DOI] [PMC free article] [PubMed] [Google Scholar]
Associated Data
This section collects any data citations, data availability statements, or supplementary materials included in this article.