

Abstract
Mucopolysaccharidoses (MPS) are lysosomal storage disorders characterized by mutations in enzymes that degrade glycosaminoglycans (GAGs). Joint disease is present in most forms of MPS, including MPS I. This work aimed to describe the joint disease progression in the murine model of MPS I. Normal (wild-type) and MPS I mice were sacrificed at different time points (from 2 to 12 months). The knee joints were collected, and haematoxylin–eosin staining was used to evaluate the articular architecture. Safranin-O and Sirius Red staining was used to analyse the proteoglycan and collagen content. Additionally, we analysed the expression of the matrix-degrading metalloproteinases (MMPs), MMP-2 and MMP-9, using immunohistochemistry. We observed progressive joint alterations from 6 months, including the presence of synovial inflammatory infiltrate, the destruction and thickening of the cartilage extracellular matrix, as well as proteoglycan and collagen depletion. Furthermore, we observed an increase in the expression of MMP-2 and MMP-9, which could conceivably explain the degenerative changes. Our results suggest that the joint disease in MPS I mice may be caused by a degenerative process due to increase in proteases expression, leading to loss of collagen and proteoglycans. These results may guide the development of ancillary therapies for joint disease in MPS I.
Keywords: alpha-L-iduronidase, joint disease, matrix metalloproteinases, mucopolysaccharidoses type I
Mucopolysaccharidoses (MPS) are lysosomal storage disorders characterized by mutations in enzymes that degrade glycosaminoglycans (GAGs). Joint disease is present in most forms of MPS, including MPS I (Giugliani et al. 2010).
Mucopolysaccharidoses I occurs due to a deficiency of the enzyme alpha-L-iduronidase (IDUA), which is involved in the degradation of heparan sulphate and dermatan sulphate. Consequently, these two GAGs accumulate in the lysosomes and in the extracellular space, leading to the clinical manifestations observed. Bone and joint disease in MPS I patients is characterized by abnormal cartilage and bone development, short stature, dysostosis multiplex and degenerative joint disease (Pastores & Meere 2005).
The animal model of MPS I was created through the disruption of the Idua gene (Ohmi et al. 2003) and has been proven to be a valuable tool for the study of disease pathogenesis (Ohmi et al. 2003; Ma et al. 2008). The mice present with joint disease in later stages of life (Visigalli et al. 2010), but a complete description of the disease was never reported.
Therefore, in the present work, we created a score to characterize the histological abnormalities present in the knee joints of MPS I mice. This histological profile allowed us to study the age of onset of joint disease and its progression. In addition, we also attempted to suggest possible mechanisms underlying the disease.
Material and methods
Animals
All animal studies were approved by the authors' institutional review board, and MPS I mice bred on a C57BL/6 background (kindly donated by Dr. Elizabeth Neufeld, UCLA, USA) were used. Both male and female Idua−/− mice (MPS I group) and their normal littermate controls, Idua−/+ and Idua+/+ (wild-type group, wt), served as subjects for experiments. MPS I mice were identified by PCR (Baldo et al. 2012), and group sizes ranged from 6 to 11 animals at each time point. Animals were maintained in conventional housing under a 12-h light/12-h dark cycle with controlled temperature (19 ± 1 °C) and humidity (50 ± 10%) and sacrificed at 2, 4, 6, 8 or 12 months.
Ethical Approval
All experimental procedures involving animals were performed in accordance with the National Institutes of Health Guide for Care and Use of Animals and with the approval of our institutional ethics committee.
Histological analyses
Mouse knees from both rear legs were collected and placed in buffered formalin from 24 h to up to 1 week, and tissue samples were decalcified with 14% EDTA for up to 1 week. Paraffin sections (7 μm thickness) were produced and stained with haematoxylin/eosin (H–E) for articular architecture, Safranin-O for proteoglycan (PG) content and Sirius Red for the evaluation of collagen levels.
The extent of joint disease was scored, given the following abnormalities analysed with H–E staining: presence of inflammatory infiltrate (0 – absent, 1 – present); bone resorption (0 – absent, 1 – mild, 2 – moderate, 3 – severe); cartilage resorption (0 – absent, 1 – mild, 2 – moderate, 3 – severe) and fibrocartilaginous proliferation (0 – absent, 1 – mild, 2 – moderate, 3 – severe). The maximum score was 10. An example of each abnormality scored can be found in Figure 1.
Figure 1.
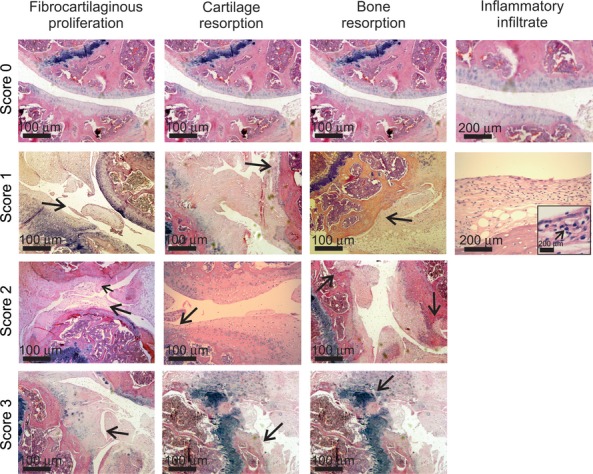
Example of abnormalities observed in the score used for evaluation of joint disease in MPS I mice (H–E stain). Arrows indicate the specific abnormality shown in each picture. In the inflammatory infiltrate picture grade 1, an insert of higher magnification was used to better exemplify the mononuclear cells observed in the synovium area (arrow). In some cases, the same picture was used more than once, when it contained more than one abnormality or in the case of normal architecture.
Safranin is a cationic dye in which staining is proportional to proteoglycan content in normal cartilage. When analysing the Safranin-O slides for cartilage proteoglycan content, the following semi-quantitative scoring was used: 0 – normal staining of non-calcified cartilage; 1 – decreased but not complete loss of Safranin-O staining over 1–100% of the articular surface; 2 – complete loss of Safranin-O staining in the non-calcified cartilage, extending to <25% of the articular surface; 3 – complete loss of Safranin-O staining in the non-calcified cartilage, extending to 25–50% of the articular surface; 4 – complete loss of Safranin-O staining in the non-calcified cartilage, extending to 50–75% of the articular surface; and 5 – complete loss of Safranin-O staining in the non-calcified cartilage, extending to >75% of the articular surface (Schmitz et al. 2010). In all cases, both legs were blindly analysed by the pathologist, and the final scores were obtained from the leg featuring more severe pathology.
To evaluate the collagen content, a single batch of slides were stained with Sirius Red. Images were obtained using a digital camera that was coupled to a microscope (Zeiss, Germany). Pictures of the articular cartilage were used to obtain the total pixel values (red signal), which corresponded to the extent of collagen staining.
Growth plate alterations
The length of growth plates obtained from wt and MPS I mice was measured using the Photoshop computer program. Photographs of the tibial growth plate (H–E slides) were taken at 20× magnification and assembled to form a single picture. The length of the growth plate was measured in at least six distinct points located throughout the growth plate extension along the axis of the chondrocyte column, as indicated in Figure 4c. The average length was obtained for each animal.
Figure 4.
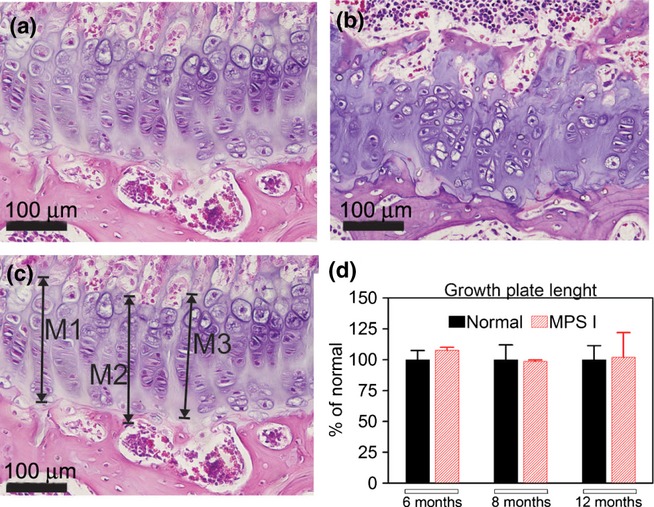
Measurements of the length of the growth plate. On the upper panels, an example of a growth plate from a normal (a) and a MPS I (b) mouse, with disorganization of the chondrocyte axis being shown in MPS I mice. On the lower panel, an example on how the growth plate length was measured (c) and the results for growth plate length (d) are visualized. No differences in length were found between normal and MPS I mice at any time points analysed. N = 6 mice/group. M, measure.
Expression of matrix metalloproteinases
Immunohistochemistry for matrix metalloproteinase type 2 (MMP-2, Abbiotec, USA) and MMP-9 (Santa Cruz, USA) was performed using the primary antibody in a 1:200 dilution, incubated overnight at 4 °C. The secondary antibody (multispecies, DAKO, USA) conjugated to peroxidase was incubated in a 1:1000 dilution for 18 h, and the samples were developed with DAB. Quantification was performed on a signal per area basis, excluding areas with no tissue, using the ImageProPlus software, as previously described (Baldo et al. 2011a,b). The results were expressed as fold change from normal values (normal average pixels was considered as a value of 1).
Statistical analysis
Results for general score, growth plate abnormalities and immunohistochemistry were compared using t-test. P value <0.05 was considered to be significant. All analyses were performed using the SigmaStat software, version The results are presented as mean and standard deviation.
Results
Time course of histological alterations
Glycosaminoglycan storage could be visualized as early as 2 months in MPS I mice; however, no other major histological abnormalities were observed at 2 and 4 months (Figure 2b). Other alterations became detectable at 6 months (Figure 2c), when 66% (4 of 6) of MPS I mice presented with mild inflammatory infiltrate. Inflammatory cells were leucocytes, observed in the synovial membrane. Fibrocartilaginous proliferation was present in 66% (4/6) of MPS I mice, with three of the animals exhibiting mild alterations. In contrast, cartilage resorption was mild and present in only 2 of 6 mice. Similarly, bone resorption was rare (1/6) and mild at this time point. Animals had uneven articular surfaces, and proteoglycan depletion was mild at this age. The average score for MPS I mice at 6 months was 2.3 ± 1.4 vs. 0.1 ± 0.3 in wt mice (P < 0.01, Figure 2f).
Figure 2.
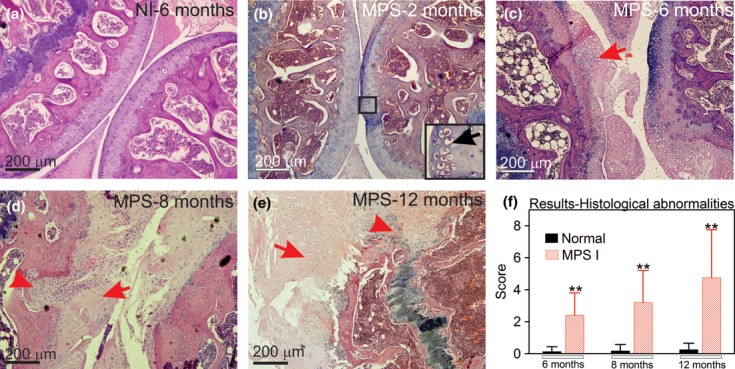
Aspect of knee joints using H–E stain. (a) Joint sections representative from a wt mouse at 6 months; (b) MPS I mice at 2 months, insert indicates GAG storage; (c) MPS I mouse at 6 months, with the arrow indicating damage to the articular surface; (d) MPS I mouse at 8 months, with the arrowhead representing bone resorption and the arrow indicating fibrocartilaginous proliferation; (e) MPS I mouse at 12 months, with the arrowhead showing intense bone resorption and the arrow indicating intense fibrocartilaginous proliferation; and (f) results from histological scores obtained in wt and MPS I mice joints at 6, 8 and 12 months (N = 6–11). Score was based on abnormalities described in Figure 1 and detailed in the methods section, where the higher the score, the worse the joint. The maximum score is 10. **P < 0.01, using Student's t-test. N = 6–11 mice/group.
Joint alterations were even more pronounced at 8 and 12 months, with evidence of proteoglycan and collagen depletion in the cartilage matrix and underlying the bone. At 8 months, inflammatory infiltrate was still mild but present in 91% of MPS I mice (10/11). Other parameters were also present in almost all mice, including fibrocartilaginous proliferation, irregularities at the articular surface and cartilage resorption. Bone resorption was present in only one mouse. The average score for MPS I mice was 3.2 ± 2.0, whereas for wt mice, it was 0.2 ± 0.4 (P < 0.01, Figure 2d).
At 12 months, more striking differences were observed, including bone resorption in 50% of MPS I mice (4/8). The inflammatory infiltrate was still mild but present in 88% of the mice. Other parameters were also more prominent. The average score for MPS I mice was 4.8 ± 3.1 vs. 0.25 ± 0.5 in wt mice (P < 0.01, Figure 2e, f). The individual results for each parameter can be seen in supplement Figure S1.
A loss of cartilage proteoglycan content was progressive with age (6–12 months of age, Figure 3a–d). Collagen levels, analysed by Sirius Red stain, suggest that wt mice show constant collagen levels from 6 to 12 months, whereas the MPS I mice present with a progressive reduction in collagen content (Figure 3e–g). At 12 months, the MPS I mice exhibited only 45% of the collagen levels observed in wt mice (P < 0.01).
Figure 3.
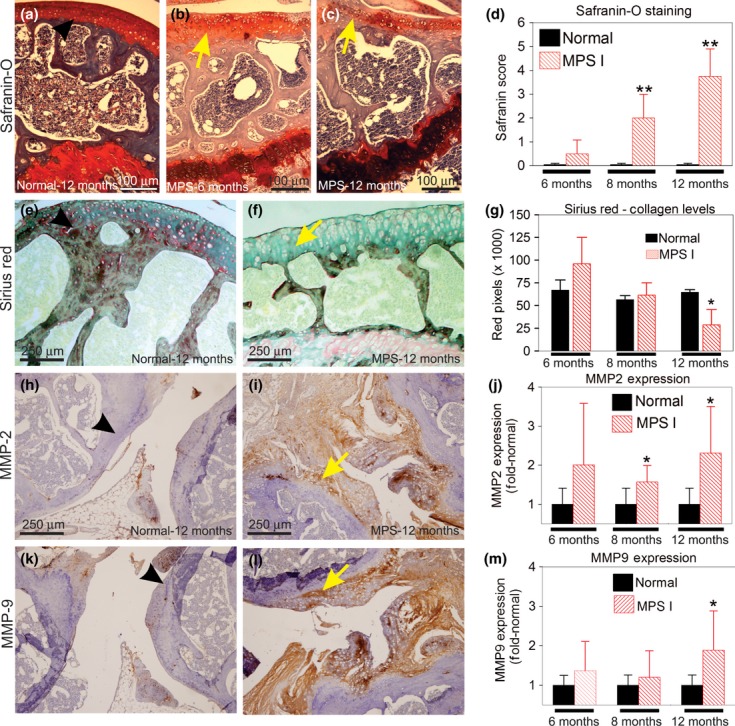
Mechanisms of joint degeneration in MPS I. (a-d) Safranin-O staining. (a) Representative section of a wt joint at 12 months. (b) MPS I mouse at 6 months. (c) MPS I mouse at 12 months, with loss of red signal (yellow arrow) showing loss of proteoglycans. (d) Results from the histological scores obtained with the Safranin-O stain at 6, 8 and 12 months. **P = 0.01, using Student's t-test. N = 3–4 mice/group. (e–g) Collagen levels evaluated by Sirius Red stain. (e) Wt joint at 12 months. (f) MPS I mouse at 12 months, showing loss of red stain (yellow arrow). (g) Quantification of the red signal in wt and MPS I mice. A significant reduction in the collagen levels was observed in the MPS I mice at 12 months (**P < 0.01, Student's t-test). (h–m) Immunohistochemistry for the matrix metalloproteinases (MMP). (h) MMP-2 expression in 12 months wt mouse; (i) MMP-2 expression in 12 months' MPS I mouse, yellow arrow denotes positive staining (brown areas). (j) Quantification of MMP-2 positive signal.*P < 0.05, t-test. N = 6–9 mice/group. (k) MMP-9 expression in Wt mouse at 12 months. (l) MMP-nine expression in MPS I joint at 12 months. (m) Quantification of MMP-2 positive signal. *P < 0.05, t-test. Results are shown as fold-normal, with the normal values being considered 1. Black arrows represent the normal histology, while yellow arrows represent the abnormal findings. N = 6–9 mice/group.
Overall, the joint disease manifests as intracellular GAG accumulation and articular cartilage matrix abnormalities characterized by a significant increase in the volume of the extracellular matrix and limited inflammation. These changes cause further destruction of the joints in a process that, in some aspects, resembles osteoarthritis. Interestingly, articular lesions were asymmetric, given that the more severe joint was analysed. No inflammatory cells were observed in wt mice at any age.
Growth plate alterations
No differences in the lengths of the growth plates were found at any of the time points analysed. However, we observed an overall disorganization of the growth plate in the MPS I mouse tibiae (Figure 4), manifested as difficulty in identifying the axes of the chondrocytes.
MMP-2 and MMP-9 expression
MMP-2 expression was upregulated in MPS I mice (Figure 3h–j). At 6 months, it was already twofold the normal levels, although not significant (P = 0.1). At 8 and 12 months, MMP-2 was 1.6- and 2.3-fold the normal values (P = 0.025 and 0.013) respectively. MMP-9 expression was mildly elevated at 6 and 8 months, 1.4- and 1.2-fold the normal values respectively (changes were not significant). At 12 months, it was 1.9-fold the normal levels (P = 0.019, Figure 3m). The areas with increased MMP-2 and MMP-9 were those with reduced proteoglycan stain, specifically in the synovial membrane and cartilage.
Discussion
The pathogenesis of joint and bone disease in MPS is a critical process that requires studies focused on disease pathogenesis, given that the currently available treatments have shown only modest results in correcting these complications (Tylki-Szymanska et al. 2010).
Here, we have shown that MPS I mice present with a progressive disease that, in some of its histological aspects, resembles osteoarthritis. A previous study has reported that several genes differentially expressed in rheumatoid arthritis were also elevated on MPS VI synovial cells (Simonaro et al. 2008). These included genes related to inflammation as well as upregulation of proteases, which are also present in osteoarthritis. Our findings suggest that an inflammatory process is indeed occurring in MPS I mice, although of mild intensity. The degradation of proteoglycans is also present, yet histologically, the process in MPS I mice resembles that of osteoarthritis, which agrees with observations found in the mouse MPS IX model (Martin et al. 2008).
Previous studies (Hinek & Wilson 2000) have shown that proteins such as elastin may have an incorrect assembly in MPS I cells and that could affect bone and joints in these patients. However, the MPS I mice were normal at first and then developed joint alterations. This made us hypothesize that collagenases could have their expression altered and could be causing the destructive changes observed. Matrix metalloproteinases, including MMP-2 and MMP-9, have been identified in injured cartilage. MMP-2 has been shown to be upregulated in MPS VII mouse aortas (Baldo et al. 2011a,b) at the mRNA level, as well as in patients with osteoarthritis (Kevorkian et al. 2005). Importantly, MMP-2 is the most active MMP against collagen type II, which is the main collagen in the cartilage (Zhen et al. 2008). MMP-9 is known for its ability to degrade a series of substrates, which includes elastin, proteoglycans, laminin and fibronectin (Shapiro 1998). Those facts motivated us to investigate the expression of MMP-2 and MMP-9 in the joints, and they were upregulated in affected mice. Simonaro et al. (2005) have also demonstrated the upregulation of these two genes in the MPS VI synovium, which suggest that the pathogenic processes in MPS I and VI may share some common aspects (Simonaro et al. 2005). We conclude that the upregulation of MMP-2 and MMP-9 might contribute to joint disease in MPS I. Other extracellular matrix-degrading enzymes, including cathepsins, have been shown to be altered in the skeletal tissue of MPS I mice (Russell et al. 1998; Wilson et al. 2009) and may therefore contribute to the disease phenotype as well.
Growth plate width in MPS I mice did not show significant differences from age-matched controls. The previous papers analysing MPS I and VII growth plates have shown a reduction in the growth plate and an increase in the apoptosis of chondrocytes in the MPS VII mice, but not in MPS I mice (Metcalf et al. 2009). Our results strengthen those findings. Notably, MPS I patients often have a short stature of unknown origin, whereas the MPS I mice have very mild alterations in bone length (Metcalf et al. 2009) and stature (Russell et al. 1998), suggesting that not all aspects of the human disease can be found in the mouse model (Clarke et al. 1997). Interestingly, we have described in a previous publication that MPS I mice have abnormal gait at late stages in life (Baldo et al. 2012). Based on these current findings, we cannot exclude the possibility that the abnormalities observed might be due to joint or bone disease.
Conclusions
In conclusion, our results suggest that MPS I mice present with progressive symptoms of joint disease that is characterized by bone and cartilage resorption, mild inflammation, as well as the depletion of collagen and proteoglycans, possibly caused by an upregulation of destructive proteases, such as MMP-2 and MMP-9. These findings highlight the importance of studies on the pathogenesis of the joint disease in MPS I, given that patients may not obtain complete benefits from the current treatments.
Acknowledgments
This work was supported by CNPq (Conselho Nacional de Desenvolvimento Científico e Tecnologico of Brazil), CAPES (Coordenação de Aperfeiçoamento de Pessoal de Nível Superior of Brazil) and FIPE (Fundação de Incentivo à Pesquisa do Hospital de Clínicas de Porto Alegre/RS-BR).
Conflict of interest
The authors declare that they have no conflict of interest.
Funding source
CNPq, CAPES and FIPE funded and supported this research.
Authors' contributions
All authors were involved in drafting the article and/or critically revising it for important intellectual content, and all authors approved the final version to be published. Dr. Xavier had full access to all of the data in the study, and he assumes responsibility for the integrity of the data and the accuracy of the data analyses.
Supporting information
Additional Supporting Information may be found in the online version of this article:
Figure S1. Time-course for each abnormality observed in MPS I mice. (a) Fibrocartilaginous proliferation. (b) Cartilage resorption. (c) Bone resorption and (d) Inflammatory infiltrate. Each dot represents the score from a single mouse at each time point. In case of a, b and c, the score varies from 0 (normal) to 3 (severe alteration). In case of inflammatory infiltrate, it was considered only as 0-absent or 1-present, a sit was always considered discrete.
References
- Baldo G, Wu S, Howe RA, et al. Pathogenesis of aortic dilatation in mucopolysaccharidosis VII mice may involve complement activation. Mol. Genet. Metab. 2011a;104:608–619. doi: 10.1016/j.ymgme.2011.08.018. [DOI] [PMC free article] [PubMed] [Google Scholar]
- Baldo G, Kretzmann NA, Tieppo J, et al. Bone marrow cells reduce collagen deposition in the rat model of common bile duct ligation. Cell. Sci. Ther. 2011b;2:1–6. [Google Scholar]
- Baldo G, Mayer FQ, Martinelli B, et al. Evidence of a progressive motor dysfunction in Mucopolysaccharidosis type I mice. Behav. Brain Res. 2012;233:169–175. doi: 10.1016/j.bbr.2012.04.051. [DOI] [PMC free article] [PubMed] [Google Scholar]
- Clarke LA, Russell CS, Pownall S, et al. Murine mucopolysaccharidosis type I: targeted disruption of the murine alpha-L-iduronidase gene. Hum. Mol. Genet. 1997;6:503–511. doi: 10.1093/hmg/6.4.503. [DOI] [PubMed] [Google Scholar]
- Giugliani R, Federhen A, Muñoz Rojas MV, et al. Enzyme replacement therapy for mucopolysaccharidoses I, II and VI: recommendations from a group of Brazilian F experts. Rev. Assoc. Med. Bras. 2010;56:271–277. doi: 10.1590/s0104-42302010000300009. [Article in Portuguese] [DOI] [PubMed] [Google Scholar]
- Hinek A, Wilson SE. Impaired elastogenesis in Hurler disease: dermatan sulfate accumulation linked to deficiency in elastin-binding protein and elastic fiber assembly. Am. J. Pathol. 2000;156:925–938. doi: 10.1016/S0002-9440(10)64961-9. [DOI] [PMC free article] [PubMed] [Google Scholar]
- Kevorkian L, Young DA, Darrah C, et al. Expression profiling of metalloproteinases and inhibitors in cartilage. Int. J. Clin. Exp. Pathol. 2005;86:131–141. doi: 10.1002/art.11433. [DOI] [PubMed] [Google Scholar]
- Ma X, Tittiger M, Knutsen RH, et al. Upregulation of elastase proteins results in aortic dilatation in mucopolysaccharidosis I mice. Mol. Genet. Metab. 2008;94:298–304. doi: 10.1016/j.ymgme.2008.03.018. [DOI] [PMC free article] [PubMed] [Google Scholar]
- Martin DC, Atmuri V, Hemming RJ, et al. A mouse model of human mucopolysaccharidosis IX exhibits osteoarthritis. Hum. Mol. Genet. 2008;17:1904–1915. doi: 10.1093/hmg/ddn088. [DOI] [PubMed] [Google Scholar]
- Metcalf JA, Zhang Y, Hilton MJ, Long F, Ponder KF. Mechanism of shortened bones in mucopolysaccharidosis VII. Mol. Genet. Metab. 2009;97:202–211. doi: 10.1016/j.ymgme.2009.03.005. [DOI] [PMC free article] [PubMed] [Google Scholar]
- Ohmi K, Greenberg DS, Rajavel KS, Ryazantsev S, Li HH, Neufeld EF. Activated microglia in cortex of mouse models of mucopolysaccharidoses I and IIIB. Proc. Natl Acad. Sci. USA. 2003;100:1902–1907. doi: 10.1073/pnas.252784899. [DOI] [PMC free article] [PubMed] [Google Scholar]
- Pastores GM, Meere PA. Musculoskeletal complications associated with lysosomal storage disorders: Gaucher disease and Hurler-Scheie syndrome (mucopolysaccharidosis type I) Curr. Opin. Rheumatol. 2005;17:70–78. doi: 10.1097/01.bor.0000147283.40529.13. [DOI] [PubMed] [Google Scholar]
- Russell C, Hendson G, Jevon G, et al. Murine MPS I: insights into the pathogenesis of Hurler syndrome. Clin. Genet. 1998;53:349–361. doi: 10.1111/j.1399-0004.1998.tb02745.x. [DOI] [PubMed] [Google Scholar]
- Schmitz N, Laverty S, Kraus VB, Aigner T. Basic methods in histopathology of joint tissues. Osteoarthr. Cartil. 2010;18(Suppl. 3):s113–s116. doi: 10.1016/j.joca.2010.05.026. [DOI] [PubMed] [Google Scholar]
- Shapiro SD. Matrix metalloproteinase degradation of extracellular matrix: biological consequences. Curr. Opin. Cell Biol. 1998;10:602–608. doi: 10.1016/s0955-0674(98)80035-5. [DOI] [PubMed] [Google Scholar]
- Simonaro CM, D'Angelo M, Haskins ME, Schuchman EH. Joint and bone disease in mucopolysaccharidoses VI and VII: identification of new therapeutic targets and biomarkers using animal models. Pediatr. Res. 2005;57(5 Pt 1):701–707. doi: 10.1203/01.PDR.0000156510.96253.5A. [DOI] [PubMed] [Google Scholar]
- Simonaro CM, D'Angelo M, He X, et al. Mechanism of glycosaminoglycan-mediated bone and joint disease - implications for the mucopolysaccharidoses and other connective tissue diseases. Am. J. Pathol. 2008;172:112–122. doi: 10.2353/ajpath.2008.070564. [DOI] [PMC free article] [PubMed] [Google Scholar]
- Tylki-Szymanska A, Marucha J, Jurecka A, Syczewska M, Czartoryska B. Efficacy of recombinant human alpha-L-iduronidase (laronidase) on restricted range of motion of upper extremities in mucopolysaccharidosis type I patients. J. Inherit. Metab. Dis. 2010;33:151–157. doi: 10.1007/s10545-010-9059-9. [DOI] [PubMed] [Google Scholar]
- Visigalli I, Delai S, Politi LS, et al. Gene therapy augments the efficacy of hematopoietic cell transplantation and fully corrects mucopolysaccharidosis type I phenotype in the mouse model. Blood. 2010;116:5130–5139. doi: 10.1182/blood-2010-04-278234. [DOI] [PMC free article] [PubMed] [Google Scholar]
- Wilson S, Hashamiyan S, Clarke L, et al. Glycosaminoglycan-mediated loss of cathepsin K collagenolytic activity in MPS I contributes to osteoclast and growth plate abnormalities. Am. J. Pathol. 2009;175:2053–2062. doi: 10.2353/ajpath.2009.090211. [DOI] [PMC free article] [PubMed] [Google Scholar]
- Zhen EY, Brittain IJ, Laska DA, et al. Characterization of metalloprotease cleavage products of human articular cartilage. Arthritis Rheum. 2008;58:2420–2431. doi: 10.1002/art.23654. [DOI] [PubMed] [Google Scholar]
Associated Data
This section collects any data citations, data availability statements, or supplementary materials included in this article.