

Abstract
Background
A preference for sweet tastes has been repeatedly shown to be associated with alcohol preference in both animals and humans. In this study, we tested the extent to which recent drinking is related to blood oxygen dependent (BOLD) activation from an intensely sweet solution in orbitofrontal areas known to respond to primary rewards.
Methods
Sixteen right-handed, non-treatment seeking, healthy volunteers (mean age 26 years; 75% male) were recruited from the community. All underwent a taste test using a range of sucrose concentrations, as well as functional magnetic resonance imaging (fMRI) during pseudorandom, event-driven stimulation with water and a 0.83M concentration of sucrose in water.
Results
[Sucrose > Water] provoked significant BOLD activation in primary gustatory cortex and amygdala, as well as in the right ventral striatum and in bilateral orbitofrontal cortex. Drinks/drinking day correlated significantly with the activation as extracted from the left orbital area (r = 0.52, p = 0.04 after correcting for a bilateral comparison). Using stepwise multiple regression, the addition of rated sucrose-liking accounted for significantly more variance in drinks/drinking day than did left orbital activation alone (multiple R= 0.79, p = 0.002).
Conclusions
Both the orbitofrontal response to an intensely sweet taste, as well as rated liking of that taste, accounted for significant variance in drinking behavior. The brain response to sweet tastes may be an important phenotype of alcoholism risk.
Keywords: alcoholism, alcohol, fmri, sweet, taste, gustatory, sucrose
Introduction
Several human studies have reported a relationship between the preference for highly sweet tastes and alcohol use disorders (Kampov-Polevoy et al., 1997; Kampov-Polevoy et al., 1998; Kampov-Polevoy et al., 2001; Krahn et al., 2006; but for negative findings also see; Bogucka-Bonikowska et al., 2001; Tremblay et al., 2009). These human data are still more compelling when considering the extensive animal literature showing that sweet consumption is related to alcohol intake (Kampov-Polevoy et al., 1990; Sinclair et al., 1992; Gosnell and Krahn, 1992; Belknap et al., 1993; Overstreet et al., 1993; Dess et al., 1998). Similarly, others have shown a relationship between sweet preference and alcohol seeking behaviors (Bell et al., 1994; Woods et al., 2003; Eiler et al., 2005).
Equally compelling is the indication of genetic underpinnings to these findings. Thus, an elevated sweet preference is characteristic of lines of alcohol-preferring rodents, in both alcohol-exposed and alcohol-naïve animals (e.g., Sinclair et al., 1992; Belknap et al., 1993; Kampov-Polevoy et al., 1996; Woods et al., 2003; Badia-Elder et al., 2003; Eiler et al., 2005; Oberlin et al., 2011). The relationship also applies conversely. Thus, as compared to animals bred for low-saccharin preference, animals bred for high-saccharin preference drink more alcohol and have a preference for other drugs (see Carroll et al., 2008 for review).
Although all humans find some degree of sweet taste rewarding, genetically mediated individual differences remain. In 324 twin pairs, Keskitalo, et al. (2007b) found that 49–53% of variance in sweet liking and sweet consumption was accounted for by genetic factors; pleasantness ratings for high intensity sucrose solutions show the strongest genetic influence (Keskitalo et al., 2007a). In that regard, several human studies have also reported an association between a family history of alcoholism and sweet-liking in both those with and without alcohol use disorders (Kampov-Polevoy et al., 2001; Kampov-Polevoy et al., 2003; Wronski et al., 2007; Lange et al., 2010). Some studies have not, however, found this relationship between familial alcoholism and sweet preference (Scinska et al., 2001; Kranzler et al., 2001; Tremblay et al., 2009).
Despite the many reports of subjective sweet preference in humans, we know of no studies that relate drinking behavior to the brain reward circuit response to sweet tastes. What is known about the brain mechanisms of sweet taste responses makes it clear that this taste modality shares common neural pathways with the rewarding properties of alcohol and other drugs of abuse (e.g., Pecina and Berridge, 2005; Wassum et al., 2009; Bassareo and Di Chiara, 1999a; Bassareo and Di Chiara, 1999b; Rada et al., 2005).
In this preliminary study, we therefore sought to determine if recent drinking in healthy human subjects is related to both the brain response to an intensely sweet stimulus (a 0.83M solution that is more than 2.5 times the sucrose concentration of Coca Cola Classic®) in orbitofrontal regions that encode primary rewards (Kringelbach and Rolls, 2004), as well as to subjectively rated liking of the sweet solution used to provoke that cortical response.
Methods
Subjects
Sixteen right-handed healthy volunteers (Table 1) with a range of recent drinking were recruited from the community. All denied any history of current neurological problems of cerebral origin, as well as any psychiatric symptoms consistent with a DSM-IV Axis I diagnosis (other than that related to an alcohol use disorder). All were non-smokers, although four were former smokers (range of 3 – 15 years abstinence) whose drinks/drinking day (mean= 2.9, range 1.7 – 3.2) and drinks/week (mean = 7.3, range 1.9 – 20.9) was similar to the same parameters in the never-smokers (drinks/drinking day = 2.5, range = 1.4 – 4.4; drinks/week= 6.8, range = 0.9 – 12.8). None of the subjects expressed any interest in treatment for their alcohol use, and none reported any disorders of smell or taste. All passed a brief screen of olfactory sensory ability (Smell Identification Test; Doty, 1995). Subjects consented to a urine screen for common drugs of abuse, and were excluded for results indicating the presence of cocaine, amphetamine, methamphetamine, methadone, opiates, PCP, barbiturates, or benzodiazepines (for which none tested positive). Given its long half-life and high comorbid use with alcohol, however, we did not exclude subjects who tested positive for marijuana use (one of the 16 subjects did test positive for marijuana, but without obvious evidence of acute intoxication).
Table 1.
Subject characteristics
| Mean | SD | Range | % | |
|---|---|---|---|---|
|
|
||||
| Age | 26.1 | 4.4 | 21 – 35 | |
| Education (yrs) | 15.5 | 1.8 | 12 – 20 | |
| % Male | 75.0 | |||
| % of European ancestry | 87.5 | |||
| % with any FHA | 43.8 | |||
| % with a 1st degree relative with alcoholism | 12.5 | |||
| BMI | 25.9 | 3.2 | 20.7 – 31.5 | |
| AUDIT | 6.6 | 3.8 | 3 – 19 | |
| % with elevated AUDIT* | 50.0 | |||
| Average drinks/drinking day | 2.8 | 1.0 | 1.4 – 4.4 | |
| % exceeding average 4 per occasion | 18.8 | |||
| Average drinks/week | 7.1 | 4.9 | 0.9 – 20.1 | |
| % exceeding average weekly limits† | 18.8 | |||
| Average heavy drinking days/week | 0.3 | 0.4 | 0 – 1.5 | |
BMI= Body Mass Index; AUDIT= Alcohol Use Disorder Identification Test; Drinking data from 90-day Timeline Follow-back Interview;
Elevated AUDIT cutoffs for men= 6, women= 4 (Johnson, et al 2013);
Men= 14/week, women= 7/week.
Procedure
Subjects arrived at the imaging facility approximately two hours prior to their scheduled scan, when height and weight were recorded, and the urine screen for illicit drug use was performed. All participants were asked to eat their normal breakfast one hour prior to arriving, and during a standardized range between 7:30 am and 8:30 am. Subjects were asked to refrain from eating or drinking after breakfast. Imaging began between 9:30 am and 10:30 am.
Taste Test
Prior to imaging, all subjects had a brief taste test to determine perceived liking and perceived intensity of a range of sweetened water solutions. To replicate the concentrations most used in similar studies (e.g., Kampov-Polevoy et al., 1997; Kampov-Polevoy et al., 2003; Tremblay et al., 2009), a range of molar (M) concentrations (0.05M, 0.10M, 0.21M, 0.42M, 0.83M) were prepared by dissolving table sugar in 50 ml of deionized water. The taste test was administered in three blocks, with each of the five solutions presented once per block in a randomized fashion (total of three tastings per solution)1. Subjects sampled 10 ml of each solution, “swished” it for 5 seconds in the mouth, and then spit the solution into a waste cup without swallowing. Using a 100 mm visual analog scale (VAS), subjects then rated the solution’s perceived intensity of sweetness (“intensity”), anchored with the labels “Barely Detectable” (0) to “Strongest Imaginable” (100), as well as their subjective “liking,” anchored by the labels “Disliked Very Much” (0) and “Liked Very Much” (100). After rating each sample, subjects used 10 ml of deionized water to rinse and spit to cleanse their palate before tasting and rating the next sample.
Gustatory stimulus paradigm
All gustatory stimuli were delivered using a computer controlled, five-channel gustometer modeled closely after a design proposed by Marciani et al. (2006), in which gear pumps rapidly infused the water and sucrose solution through a spray nozzle that efficiently covered the tongue with small amounts of solution. During imaging, the highest concentration of sucrose (0.83M) was delivered through the spray nozzle, as was a control stimulus of water with a tasteless thickening agent (ThickenUp Clear®, Nestlē Health Sciences, Veyvey, Switzerland) to approximate the viscosity of the sucrose solution. Each stimulus presentation trial (either sucrose or water) comprised 1.5 ml of liquid sprayed onto a subject’s tongue, followed by 0.5 ml of water (which in the case of sucrose trials served to purge the nozzle volume of residual sucrose solution).
Subjects were alerted to the impending delivery of a spray by text displayed on a screen through the rear of the scanner bore, and asked to hold the solution in their mouth until prompted to swallow by a visual command (variable 1–3 seconds after the spray; Figure 1). In each of the four functional imaging scans, the sucrose solution was presented 8 times and the water control presented 16 times in a pseudorandom mixed event design in which two sucrose events were never presented consecutively. This resulted in a total of 32 sucrose events and 64 water events. However, to maximize the taste contrast between the sucrose and the control, only water controls that followed an immediately preceding water event were used when analyzing the [Sucrose > water] contrast of interest. Thus, the resulting contrast of interest was comprised of 32 water events matched to 32 sucrose trials. Four distinct sequences of stimulus events were generated with an11 – 17 sec inter-trial (onset-to-onset) interval, each run once per MRI session in a randomized order.
Figure 1.

Diagram of events (not to temporal scale), with text prompts in quotation marks indicating visual cues shown to subjects. A 3 sec visually displayed “Ready” text prompt alerted subjects to the impending 1 sec liquid spray, which was also accompanied by a text prompt (“Spray”). A subsequent 1 sec water purge followed immediately and contiguously to purge the volume of the spray nozzle. A variable 1–3 sec blank interval ensued (hatched area), followed by a 1 sec “Swallow” prompt. A variable 4–8 sec interval (during which a fixation cross appeared) separated the trials. Total trial length was 11 – 17 sec.
Intra-MRI Assessment
Following each functional scan, and while remaining in the scanner, subjects rated their hunger and thirst, as well as their craving for both sweet and salty tastes. After each scan, subjects were also asked to rate their liking of the 0.83M sucrose solution as administered during the immediately preceding BOLD scan, the perceived sweet intensity of that solution, and their desire to increase or decrease its level sweetness. All questions were asked using a 100 mm horizontally oriented VASs.
Image Acquisition
Subjects were imaged on a Siemens (Siemens Healthcare, Erlangen, Germany) 3T Magnetom Trio-Tim scanner using a 12-channel head coil array. Four consecutive 5:53 min long echo-planar imaging (EPI) scans evaluated responses to the gustatory stimuli (165 BOLD contrast-sensitive volumes, gradient echo, repetition time 2,100 ms, echo time 29 ms, flip angle 77°, 37 contiguous 3 mm thick axial slices, acquisition matrix 88×88, 2.5×2.5×3.0 mm3 voxels, GRAPPA acceleration factor 2, 3D prospective acquisition correction algorithm). The total duration of BOLD imaging was 32–37 min, including post-scan water spray delivery time and subjective ratings during imaging. In addition, high resolution (1×1×1.2 mm3 voxels) anatomical images acquired with an MP-RAGE sequence were obtained for each subject to facilitate transformation to a common stereotactic system.
Image Analysis
SPM8 (Wellcome Department of Imaging Neuroscience, University College, London, UK) was utilized for slice-timing correction, rigid-body realignment of each subject’s BOLD volumes, and co-registration of the BOLD volumes to each subject’s own high resolution anatomical image. SPM8’s tissue segmentation routine of the MPRAGE images was used to derive normalization parameters that were then applied to nonlinearly transform the BOLD volumes into Montreal Neurological Institute (MNI) space.
BOLD fMRI data are influenced by artifact sources that are typically subject-specific and include effects of head motion, eye movements, respiration, and pulsatile blood flow. A variety of denoising algorithms have been developed to improve signal detection and allow artifact-corrupted data retention. While we largely accounted for the effects of gross head motion by using prospective motion correction during acquisition and SPM’s realignment algorithm, the presence of more localized jaw and related motion during swallowing was best addressed by an independent component analysis (ICA) technique as implemented by McKeown et al, (1998). Specifically, we performed probabilistic ICA (pICA) from FMRIB’s Software Library (FSL, MELODIC tool) on each subject’s motion-corrected BOLD volumes. Each session/scan data were filtered to remove low frequency drifts (<1/128 Hz) and spatially smoothed with a 5 mm full width at half maximum (FWHM) Gaussian kernel. The imaging artifact components for each scan/session were removed using MELODIC’s fsl_regfilt command-line program. These filtered, denoised, and normalized BOLD volumes with isotropic (2 mm/side) voxels were presented to the GLM-based analysis in SPM8. Within-subject, fixed-effects of the BOLD response to sucrose and water trials (as specified above) were then estimated using SPM’s canonical hemodynamic response function, with an autoregressive AR(1) model accounting for serial correlations.
To limit the number of comparisons, a group random effects analysis of the [Sucrose > Water] contrast was constrained to a 472,880 mm3 (59110 voxels, 1741.9 resels) volume that comprised cortical gustatory (frontal, parietal, and insular regions), as well as cortical (orbitofrontal, insular) and subcortical (striatal, amygdala) reward regions (see online supplementary table for other responses falling outside this mask). We used small volume corrections to test for responses in: (a) the gustatory regions of “area G” (insula/parietal junction) and the peri-Rolandic parietal areas identified by Ogawa et al. (2005), (b) the gray matter volumes of the amygdala as identified by the MarsBar utility, (c) posterior orbitofrontal areas identified by coordinates from the meta-analysis of Kringelbach & Rolls (2004) as responding to primary reinforcers, and (d) the anatomic region of the ventral striatum as described previously (Kareken et al., 2010).
Results
Pre-Imaging Taste Ratings
Sweet Intensity
As analyzed in a Concentration(5) × Block(3) mixed linear model, there was a significant effect for Concentration on perceived sweet intensity (p < 0.001), but no main effect for Block (p = 0.14) or Block × Concentration interaction (p = 0.25). As is clear from Figure 2, sweet intensity ratings increased with higher sucrose concentrations, with the 0.83M solution rated as being the most intense when compared to the remaining concentrations (p≤ 0.001).
Figure 2.
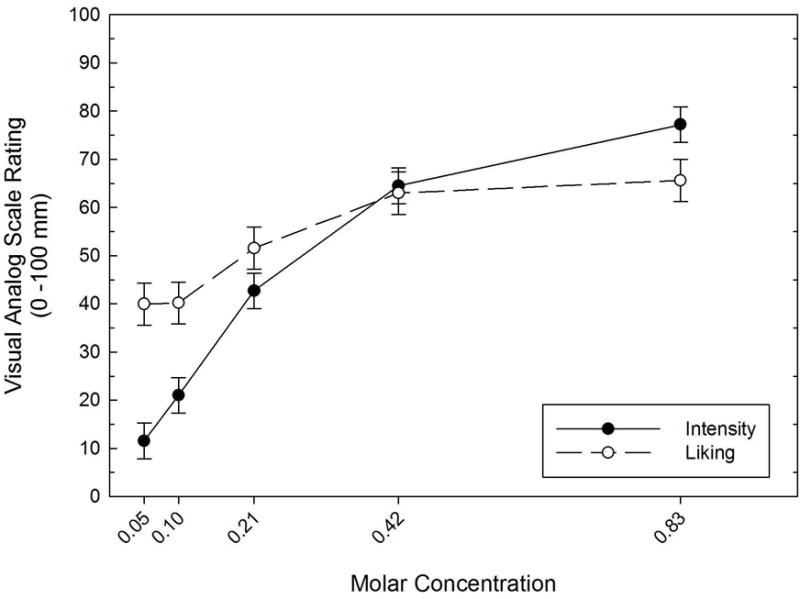
Perceived intensity and liking of the sweet solutions as a function of sucrose molar concentration. Error bars = standard errors.
Sweet Liking
Analyzed in a Concentration(5) × Block(3) mixed linear model, there was a significant effect of Concentration on sucrose liking (p < 0.001), as well as an effect of Block (p = 0.009). The liking gradient generally mirrored that of perceived sweet intensity (Figure 2), with perceived liking for the 0.83M concentration being significantly different than all other concentrations (p ≤ 0.014), except for the adjacent 0.42M solution (p= 0.51). There was no Block × Concentration interaction (p = 0.553). The liking gradient generally mirrored perceived sweet intensity (Figure 2), although as a whole, the group’s perceived liking for the 0.83M concentration was insignificantly different than liking for the 0.42M concentration (p= 0.51).
Applying the classification scheme proposed by Kampov-Polevoy and colleagues (1998), 8 subjects could be labeled as “sweet likers,” as their liking ratings peaked at the 0.83M solution. Six subjects had liking ratings that peaked at the 0.42M solution, while the remaining two subjects had liking ratings that peaked at the 0.10M solution.
Intra-MRI Subjective Ratings
Over the course of imaging, perceived intensity of the 0.83M sucrose solution (average across all scans = 62.0, SD= 8.8) was lower than the average perceived intensity as rated during the pre-imaging taste test (77.0, SD= 16.7, p = 0.002), suggestive of some habituation by the time of imaging. Average perceived liking during fMRI (59.6, SD= 18.5) was, however, insignificantly different from liking as rated during the pre-imaging taste test (64.5, SD= 24.1; paired t-test, p = 0.23).
Within subject mixed linear models tested for any effects of Time on the subjects’ four ratings after each of the four BOLD scans (sucrose intensity and liking, hunger, thirst, sweet craving, salt craving, and desire to change the intensity of the sucrose solution; Table 2). Of these dependent measures, the only statistically significant main effects for Time were those that reflected increasing hunger (p = 0.007) and desire to change (weaken; p = 0.025) the sucrose concentration. In the case of Hunger, the main effect of Time was due to a significant difference between ratings after scans 1 and 2 (p = 0.008) only. In the case of the desire to change sucrose intensity, pairwise contrasts showed that scan 1 differed from scans 3 and 4 (ps = 0.021 and 0.014, respectively). Although the effect of Time was not statistically significant for Liking (p = 0.102), post hoc paired comparisons did suggest that, as compared to scan 1’s mean rating (68.4, SE= 4.4), sweet solution liking declined slightly by the time of scans 3 (52.4, SE= 6.5; p = 0.022) and 4 (52.3, SE= 7.5; p = 0.042), suggesting some possible habituation.
Table 2.
Subjective ratings during the imaging session.
| Scan 1 | Scan 2 | Scan 3 | Scan 4 | |||||
|---|---|---|---|---|---|---|---|---|
| Mean | SD | Mean | SD | Mean | SD | Mean | SD | |
| Intensity | 59.4 | 9.9 | 61.8 | 7.8 | 63.3 | 14.9 | 63.8 | 11.4 |
| Liking | 66.4 | 17.6 | 58.8 | 21.9 | 52.4 | 25.9 | 52.3 | 30.0 |
| Sweet Craving | 28.0 | 14.8 | 24.3 | 16.8 | 22.5 | 18.7 | 21.8 | 18.4 |
| Salt Craving | 28.6 | 19.0 | 33.3 | 22.7 | 35.6 | 24.1 | 37.8 | 26.4 |
| Hunger* | 63.0 | 11.6 | 68.3 | 12.9 | 66.9 | 19.3 | 69.3 | 21.2 |
| Thirst | 37.6 | 13.5 | 37.0 | 18.0 | 33.6 | 21.9 | 34.3 | 23.5 |
| Desire to Change* | 52.9 | 13.9 | 48.9 | 17.9 | 41.3 | 21.8 | 42.8 | 17.3 |
Notes. Rating times are following each of four BOLD scans. All ratings were made on a 100 mm vertical visual analog scale. Ascending numbers reflect increasing attributes except for ‘Desire to Change,’ in which higher numbers reflected a desire for a stronger solution and lower numbers reflect a desire for a weaker solution.
Main effects for time (p< 0.05; see text for detail). Underlined values represent significant post hoc differences as compared to Scan 1.
BOLD Responses
The [Sucrose > Water] contrast showed significant BOLD responses in gustatory cortex (area G, peri-Rolandic operculum; Figure 3a; Table 2). Foci in the peri-Rolandic operculum were significant after correcting for family-wise error (FWE) based on spherical (8 mm radius) regions surrounding left ([−36, −6, 12], pFWE< 0.001) and right area G, as well as left ([−62, −18, 22], pFWE= 0.001) and right ([64, −16, 22], pFWE= 0.048;[58, −16, 18], pFWE= 0.038) Rolandic areas, and as identified by Ogawa, et al. (2005) in their study of cortical gustatory regions.
Figure 3.
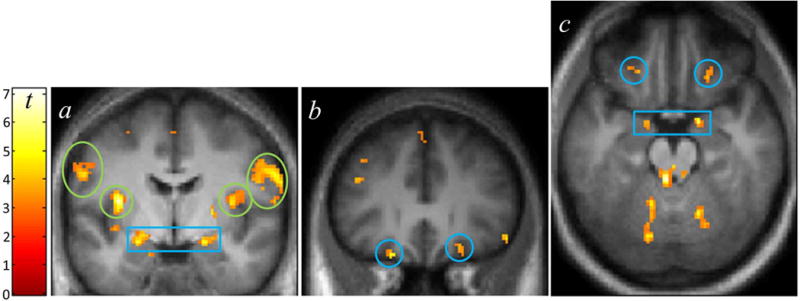
BOLD activation from the [Sucrose > Water] contrast. (1) Coronal slice (y=−4 mm) showing activation in the bilateral insula/“area G” (green circles), dorsal amygdala (blue box), and peri-Rolandic cortex (green ovals, in this slice corresponding to the prefrontal gyrus). (b) Bilateral orbitofrontal (y = 30 mm) activation (blue circles). (c) Axial view (z=−20 mm) of activation in the orbital and amygdala areas. Display, p < 0.005, k > 10. Color bar indicates t-statistic.
In limbic and reward areas, there was [Sucrose > Water] activation in the dorsal anterior cingulate, bilateral ventral insula, the right ventral striatum (pFWE = 0.006 when corrected for an anatomically defined ventral striatal ROI; see Kareken et al., 2010), and the bilateral orbitofrontal cortex, which was significant when correcting for volumes (8 mm radius spheres) centered on orbital coordinates identified by Kringelbach & Rolls (2004) as responding to primary reinforcers (left: [−22, 30, −22], pFWE= 0.013; right:[22, 26, −18], pFWE= 0.020; Figure 3b,c, blue circles). Activation was present in the bilateral dorsal amygdala, which was also significant when accounting for the gray matter volume of the amygdalae (left: [−24, −6, −14], pFWE= 0.011; right: [22, −2, −14], pFWE= 0.004; Figure 3a,c, blue box).
Given the previously identified role of posterior orbital cortex in coding for primary reinforcers, we extracted the [Sucrose > Water] orbital activation clusters at a voxel-wise threshold of p < 0.01 (uncorrected) using the MarsBar utility. We then determined if these orbital clusters correlated with drinking, defined as either drinks/drinking day or drinks/week. Right orbital activation did not correlate with either drinking measure, and left orbital activation did not correlate with drinks/week. Left orbital activation did, however, correlate significantly with drinks/drinking day (r = 0.52, p= 0.02, p= 0.04 when correcting for the bilateral comparison; Figure 4).
Figure 4.

(Top) Brain image shows responding cluster, as extracted from each subject, at a voxel-wise threshold of p < 0.01, uncorrected. (Bottom) Scatter plot of the correlation between [Sucrose > Water] BOLD contrast in the extracted left orbital area (as depicted in top image) and drinks/drinking day from the Timeline Followback interview (r = 0.52, p= 0.02; p = 0.04 corrected for the bilateral comparison).
Liking of the sucrose solution (VAS rating at the pre-imaging taste test) was marginally correlated with drinks/drinking day (r = 0.40, p = 0.06), but not with [Sucrose > Water] activation in the responding left orbital cluster (r = −0.32, p = 0.11). When entered into a stepwise multiple regression, however, rated liking of the sucrose solution incrementally accounted for significantly more variance in drinks/drinking day (R2 change= 0.36; p < 0.004), above and beyond that accounted for by the orbital activation alone (multiple R= 0.79, p = 0.002). Thus, the combination of both sweet taste-induced orbital activation and liking of the sweet solution accounted for significant variance in drinks/drinking day.
The recent drinking measures did not correlate with extracted activation from either the right ventral striatum or from either the left or right ventral insula.
Discussion
In this study, intraoral stimulation with an intensely sweet stimulus (0.83M sucrose solution) strongly activated areas known to be involved in human and primate gustation, such as the insular/opercular junction representing “area G” and peri-Rolandic opercular cortex (Ogawa et al., 2005). The bilateral dorsal amygdala was also activated, and likely reflects the solution’s marked intensity (Small et al., 2003; Anderson et al., 2003). These findings provide confidence that the stimulation paradigm was effective in eliciting human gustatory system activity.
More directly relevant for alcoholism, the sucrose solution (compared to the water baseline) activated regions of the reward circuit, including the bilateral ventral insula (which also receives indirect gustatory projections; see Ogawa, 1994), the right ventral striatum, and the bilateral orbitofrontal cortex, where the peaks corresponded to orbital areas that are principally responsive to primary (e.g., ingested) reinforcers (Kringelbach & Rolls, 2004). Moreover, the left orbitofrontal response was significantly and positively correlated with drinks/drinking day. Thus, the stronger the response in this region, the greater the density of subjects’ reported daily drinking. In addition to this correlation, subjective liking of the intensely sweet stimulus accounted for additional variance in drinks/drinking day, above and beyond that accounted for by the left orbital response itself. Thus, both the reward system’s response to a highly sweet taste, as well as subjective liking of the same taste, helped to significantly account for self-reported drinking.
The findings here extend a sizable body of literature that shows a relationship between sweet liking and a preference for both alcohol and other drugs (see Carroll et al., 2008, for review). The question then arises as to why there might be an association between sweet liking and alcohol use. Sweet tastes are intrinsic, primary reinforcers that can provoke responses within the reward system. And as with drugs of abuse, sweet tastes and sugar consumption can provoke ventral striatal dopamine transmission (e.g., Bassareo et al., 2003; Rada et al., 2005), with dopaminergic responses to gustatory sucrose stimulation (isolated from their metabolic value by sham feeding) being highly concentration dependent (Hajnal et al., 2004). The capacity of both palatable food (sucrose) and alcohol to provoke dopaminergic responses appears partly mediated by μ-opioid mechanisms (Tanda and Di Chiara, 1998). Sucrose palatability is also linked to endogenous opioid transmission in the nucleus accumbens (Pecina & Berridge, 2005; Wassum et al., 2009), consistent with the finding that the opioid antagonist naltrexone (used in the treatment of alcoholism) reduces sugar’s rewarding properties (Langleben et al., 2012).
One theoretical framework in which to understand the findings of this investigation is that of a “reward deficiency” syndrome that, in its broadest form, refers to an abnormal basal state of tonically low endogenous reward (Blum et al., 1995). As a result, a greater degree of stimulation (as from drugs) is then needed to elicit a normal level of reinforcement arousal. However, a preference for an intensely sweet taste could be also consistent with an intrinsic need for a greater than average degree of hedonic stimulation. In the current context, our employed 0.83M sucrose solution compares to the much lower 0.32M sucrose solution of Coca-Cola Classic®, which is already considered by many to be a highly sweet beverage.
With that said, not all results from human studies are consistent with the reward deficiency hypothesis of alcoholism itself, or of the genetic predisposition to alcoholism in those yet to manifest the disease. Thus, using the “normal” reward of small amounts of money, some studies do report less ventral striatal activation to monetary reward receipt in alcoholic patients than in controls (Wrase et al., 2007; Beck et al., 2009), although Bjork et al. (2008a) did not find such a group difference. In groups at risk for alcoholism, Andrews et al. (2011) found lower ventral striatal responses to the anticipation of monetary reward in those with a family history of alcoholism, while Bjork, et al. (2008b) reported no difference between the adolescent children of alcoholics and adolescent controls.
In the end, our study does not unambiguously address the idea of a hypo-responsiveness to normal reward, as we did not, as described above, employ a “normally” sweet concentration (the response to which should correlate inversely with recent drinking, assuming a reward deficiency hypothesis). On the other hand, the variable outcome in studies of monetary reward may stem from inter-individual differences in the subjective scaling of the money’s value, as the same amount may imply different values to those of different cultural backgrounds or financial means. On a broader scale, Odum & Baumann (2007) showed that food was more steeply discounted than money in a delay discounting paradigm, suggesting a potentially different valuation of ingestible primary rewards as compared to secondary reinforcers. Thus, the more natural, primary reinforcer of a sweet taste may be an alternative stimulus with which to pursue the reward deficiency hypothesis (or even of reward sensitivity).
There are some limitations to this study. First, the sample appears to be one that is largely “sweet liking,” with only two subjects preferring the weakest solutions. The majority of the subjects preferred either the strongest (0.83M) or the next strongest (0.42M) sucrose solutions, and a sample with a larger range of sweet preferences might produce different results. The sample was also not a particularly heavy-drinking group (average drinks/drinking day= 2.8), and the nature of the findings might not extend to significantly more hazardous drinkers. Similarly, and although the results are significant, the sample size is limited in size and may not be entirely representative of the larger population. Finally, although the orbitofrontal response to sucrose stimulation was bilateral, the correlation between the orbital response and recent drinking was apparent only on the left.
In summary, we believe this to be the first report of a human association between the brain response to an intensely sweet stimulus and drinking behavior. Despite the sample size limitation, the outcomes reported here extend the association between human sweet-liking and alcohol preference. We thus believe that these data constitute preliminary and promising evidence that the orbitofrontal response to an intensely sweet taste may be a phenotypic marker of alcohol preference in humans, and potentially of alcohol use disorders.
Supplementary Material
Table 3.
Stereotactic coordinates for activated regions.
| Region | Cluster size |
Peak Z | punc | MNI | ||
|---|---|---|---|---|---|---|
| x | y | z | ||||
| L-Posterior, Dorsal Insula/Frontal Operculum | 77* | 4.65 | < 0.001 | −36 | −6 | 12 |
| L-Frontal Opercular cortex | 103* | 4.42 | < 0.001 | −62 | −16 | 20 |
| R-Inferior Frontal Gyrus | 193* | 4.29 | < 0.001 | 56 | 10 | 30 |
| L-Middle Frontal Gyrus | 12 | 4.21 | < 0.001 | −42 | 28 | 26 |
| R-Dorsal Amygdala | 42* | 4.14 | < 0.001 | 22 | −2 | −14 |
| L-Middle Frontal Gyrus | 13 | 4 | < 0.001 | −44 | 14 | 44 |
| R-Ventral Striatum/Nucleus Accumbens | 11 | 3.95 | < 0.001 | 8 | 6 | −4 |
| L-Precentral Gyrus | 30 | 3.83 | < 0.001 | −56 | 4 | 24 |
| L-Dorsal Amygdala | 33 | 3.81 | < 0.001 | −24 | −6 | −14 |
| L-Orbitofrontal Cortex (anterior orbital gyrus) | 5 | 3.73 | < 0.001 | −22 | 30 | −22 |
| R-Parietal Opercular Cortex (post-central gyrus) | 43* | 3.64 | < 0.001 | 46 | −14 | 16 |
| R-Orbitofrontal Cortex (anterior orbital gyrus) | 6 | 3.59 | < 0.001 | 22 | 26 | −18 |
| L-Ventral Anterior Insula | 9 | 3.56 | < 0.001 | −40 | 0 | −12 |
| R-Post Central Gyrus | 6 | 3.53 | < 0.001 | 58 | −16 | 16 |
| L-Uncus/Amygdala | 8 | 3.51 | < 0.001 | −16 | 4 | −24 |
| R-Middle Frontal Gyrus | 6 | 3.49 | < 0.001 | 38 | 46 | 2 |
| L-Inferior Frontal Gyrus | 10 | 3.46 | < 0.001 | −56 | 10 | 16 |
| R-Middle Cingulate | 5 | 3.4 | < 0.001 | 12 | 12 | 40 |
| R-Ventral Insula | 5 | 3.39 | < 0.001 | 38 | 2 | −10 |
| L-Posterior Orbital Cortex (medial orbital gyrus) | 5 | 3.38 | < 0.001 | −16 | 14 | −16 |
| L-Supplementary Motor Area | 7 | 3.38 | < 0.001 | −2 | −2 | 56 |
| L-Ventral Postcentral Gyrus | 6 | 3.31 | < 0.001 | −48 | −14 | 32 |
Derived from a volume of 472,880 mm3 (59110 voxels, 1741.9 resels) comprising gustatory and reward regions; see text. MNI= Montreal Neurological Coordinates in mm.
p< 0.05 false discovery rate corrected cluster significance, based on assessed volume at p< 0.001 height threshold.
Acknowledgments
Supported by a pilot grant from the Department of Neurology at the Indiana University School of Medicine and the Elvin S. Eyster Fund in Neurology, with additional funding from R01 AA017661-01A1S1 (DAK). BGO was supported by T32 AA007462 and WJE received support from R01 DK089070. We are grateful to Stella Tran, Rose Case, and Christina Soeurt for subject recruiting and management, Michele Beal and Courtney Robbins for technical assistance with MRI acquisition, Dwight Hector, Ph.D. for design refinements and construction of the gustometer, and Nicholas Grahame, Ph.D. and Ann E.K. Kosobud, Ph.D. for comments on prior versions of this paper.
Footnotes
One subject completed only two blocks given time constraints.
References
- Anderson AK, Christoff K, Stappen I, Panitz D, Ghahremani DG, Glover G, Gabrieli JD, Sobel N. Dissociated neural representations of intensity and valence in human olfaction. Nat Neurosci. 2003;6:196–202. doi: 10.1038/nn1001. [DOI] [PubMed] [Google Scholar]
- Andrews MM, Meda SA, Thomas AD, Potenza MN, Krystal JH, Worhunsky P, Stevens MC, O’Malley S, Book GA, Reynolds B, Pearlson GD. Individuals Family History Positive for Alcoholism Show Functional Magnetic Resonance Imaging Differences in Reward Sensitivity That Are Related to Impulsivity Factors. Biol Psychiatry. 2011;69:675–683. doi: 10.1016/j.biopsych.2010.09.049. [DOI] [PMC free article] [PubMed] [Google Scholar]
- Badia-Elder NE, Stewart RB, Powrozek TA, Murphy JM, Li TK. Effects of Neuropeptide Y on Sucrose and Ethanol Intake and on Anxiety-Like Behavior in High Alcohol Drinking (HAD) and Low Alcohol Drinking (LAD) Rats. Alcohol Clin Exp Res. 2003;27:894–899. doi: 10.1097/01.ALC.0000071929.17974.DA. [DOI] [PubMed] [Google Scholar]
- Bassareo V, Di Chiara G. Differential responsiveness of dopamine transmission to food-stimuli in nucleus accumbens shell/core compartments. Neuroscience. 1999a;89:637–641. doi: 10.1016/s0306-4522(98)00583-1. [DOI] [PubMed] [Google Scholar]
- Bassareo V, De Luca MA, Aresu M, Aste A, Ariu T, Di Chiara G. Differential adaptive properties of accumbens shell dopamine responses to ethanol as a drug and as a motivational stimulus. Eur J Neurosci. 2003;17:1465–1472. doi: 10.1046/j.1460-9568.2003.02556.x. [DOI] [PubMed] [Google Scholar]
- Bassareo V, Di Chiara G. Modulation of feeding-induced activation of mesolimbic dopamine transmission by appetitive stimuli and its relation to motivational state. Eur J Neurosci. 1999b;11:4389–4397. doi: 10.1046/j.1460-9568.1999.00843.x. [DOI] [PubMed] [Google Scholar]
- Beck A, Schlagenhauf F, Wnstenberg T, Hein J, Kienast T, Kahnt T, Schmack K, Hägele C, Knutson B, Heinz A, Wrase J. Ventral Striatal Activation During Reward Anticipation Correlates with Impulsivity in Alcoholics. Biol Psychiatry. 2009;66:734–742. doi: 10.1016/j.biopsych.2009.04.035. [DOI] [PubMed] [Google Scholar]
- Belknap JK, Crabbe JC, Young ER. Voluntary consumption of ethanol in 15 inbred mouse strains. Psychopharmacology. 1993;112:503–510. doi: 10.1007/BF02244901. [DOI] [PubMed] [Google Scholar]
- Bell SM, Gosnell BA, Krahn DD, Meisch RA. Ethanol reinforcement and its relationship to saccharin preference in Wistar rats. Alcohol. 1994;11:141–145. doi: 10.1016/0741-8329(94)90055-8. [DOI] [PubMed] [Google Scholar]
- Bjork JM, Smith AR, Hommer DW. Striatal sensitivity to reward deliveries and omissions in substance dependent patients. NeuroImage. 2008a;42:1609–1621. doi: 10.1016/j.neuroimage.2008.06.035. [DOI] [PMC free article] [PubMed] [Google Scholar]
- Bjork J, Knutson B, Hommer D. Incentive-elicited striatal activation in adolescent children of alcoholics. Addiction. 2008b;103:1308–1319. doi: 10.1111/j.1360-0443.2008.02250.x. [DOI] [PubMed] [Google Scholar]
- Blum K, Sheridan PJ, Wood RC, Braverman ER, Chen TJH, Comings DE. Dopamine D2 Receptor Gene Variants – Association and Linkage Studies in Impulsive-Addictive-Compulsive Behavior. Pharmacogenetics. 1995;5:121–141. doi: 10.1097/00008571-199506000-00001. [DOI] [PubMed] [Google Scholar]
- Bogucka-Bonikowska A, Scinska A, Koros E, Polanowska E, Habrat B, Woronowicz B, Kukwa A, Kostowski W, Bienkowski P. Taste responses in alcohol-dependent men. Alcohol Alcohol. 2001;36:516–519. doi: 10.1093/alcalc/36.6.516. [DOI] [PubMed] [Google Scholar]
- Carroll ME, Morgan AD, Anker JJ, Perry JL, Dess NK. Selective breeding for differential saccharin intake as an animal model of drug abuse. Behav Pharmacol. 2008;19:435–460. doi: 10.1097/FBP.0b013e32830c3632. [DOI] [PubMed] [Google Scholar]
- Dess NK, Badia-Elder NE, Thiele TE, Kiefer SW, Blizard DA. Ethanol Consumption in Rats Selectively Bred for Differential Saccharin Intake. Alcohol. 1998;16:275–278. doi: 10.1016/s0741-8329(98)00010-x. [DOI] [PubMed] [Google Scholar]
- Doty RL. The Smell Identification Test™: Administration Manual. 3. Haddon Heights NJ: Sensonics, Inc; 1995. [Google Scholar]
- Eiler WJA, Woods JE, Masters J, McKay PF, Hardy L, Goergen JJ, Mensah-Zoe B, Cook JB, Johnson NJ, June HL. Brain Stimulation Reward Performance and Sucrose Maintained Behaviors in Alcohol-Preferring and -Nonpreferring Rats. Alcohol Clin Exp Res. 2005;29:571–583. doi: 10.1097/01.alc.0000158934.50534.b7. [DOI] [PubMed] [Google Scholar]
- Gosnell BA, Krahn DD. The relationship between saccharin and alcohol intake in rats. Alcohol. 1992;9:203–206. doi: 10.1016/0741-8329(92)90054-e. [DOI] [PubMed] [Google Scholar]
- Hajnal A, Smith GP, Norgren R. Oral sucrose stimulation increases accumbens dopamine in the rat. Am J Physiol Regul Integr Comp Physiol. 2004;286:R31–R37. doi: 10.1152/ajpregu.00282.2003. [DOI] [PubMed] [Google Scholar]
- Kampov-Polevoy A, Garbutt JC, Janowsky D. Evidence of preference for a high-concentration sucrose solution in alcoholic men. Am J Psychiatry. 1997;154:269–270. doi: 10.1176/ajp.154.2.269. [DOI] [PubMed] [Google Scholar]
- Kampov-Polevoy AB, Garbutt JC, Davis CE, Janowsky DS. Preference for higher sugar concentrations and tridimensional personality questionnaire scores in alcoholic and nonalcoholic men. Alcohol Clin Exp Res. 1998;22:610–614. doi: 10.1111/j.1530-0277.1998.tb04300.x. [DOI] [PubMed] [Google Scholar]
- Kampov-Polevoy AB, Garbutt JC, Khalitov E. Family history of alcoholism and response to sweets. Alcohol Clin Exp Res. 2003;27:1743–1749. doi: 10.1097/01.ALC.0000093739.05809.DD. [DOI] [PubMed] [Google Scholar]
- Kampov-Polevoy AB, Kasheffskaya OP, Sinclair JD. Initial acceptance of ethanol: Gustatory factors and patterns of alcohol drinking. Alcohol. 1990;7:83–85. doi: 10.1016/0741-8329(90)90065-k. [DOI] [PubMed] [Google Scholar]
- Kampov-Polevoy AB, Tsoi MV, Zvartau EE, Neznanov NG, Khalitov E. Sweet liking and family history of alcoholism in hospitalized alcoholic and non-alcoholic patients. Alcohol Alcohol. 2001;36:165–170. doi: 10.1093/alcalc/36.2.165. [DOI] [PubMed] [Google Scholar]
- Kampov-Polevoy AB, Kasheffskaya OP, Overstreet DH, Rezvani AH, Viglinskaya IV, Badistov BA, Seredenin SB, Halikas JA, Sinclair JD. Pain sensitivity and saccharin intake in alcohol-preferring and -nonpreferring rat strains. Physiol Behav. 1996;59:683–688. doi: 10.1016/0031-9384(95)02110-8. [DOI] [PubMed] [Google Scholar]
- Kareken DA, Bragulat V, Dzemidzic M, Cox C, Talavage T, Davidson D, O’Connor SJ. Family history of alcoholism mediates the frontal response to alcoholic drink odors and alcohol in at-risk drinkers. NeuroImage. 2010;50:267–276. doi: 10.1016/j.neuroimage.2009.11.076. [DOI] [PMC free article] [PubMed] [Google Scholar]
- Keskitalo K, Knaapila A, Kallela M, Palotie A, Wessman M, Sammalisto S, Peltonen L, Tuorila H, Perola M. Sweet taste preferences are partly genetically determined: identification of a trait locus on chromosome 16. Am J Clin Nutr. 2007a;86:55–63. doi: 10.1093/ajcn/86.1.55. [DOI] [PubMed] [Google Scholar]
- Keskitalo K, Tuorila H, Spector TD, Cherkas LF, Knaapila A, Silventoinen K, Perola M. Same genetic components underlie different measures of sweet taste preference. Am J Clin Nutr. 2007b;86:1663–1669. doi: 10.1093/ajcn/86.5.1663. [DOI] [PubMed] [Google Scholar]
- Krahn D, Grossman J, Henk H, Mussey M, Crosby R, Gosnell B. Sweet intake, sweet-liking, urges to eat, and weight change: Relationship to alcohol dependence and abstinence. Addict Behav. 2006;31:622–631. doi: 10.1016/j.addbeh.2005.05.056. [DOI] [PubMed] [Google Scholar]
- Kranzler HR, Sandstrom KA, Van Kirk J. Sweet Taste Preference as a Risk Factor for Alcohol Dependence. Am J Psychiatry. 2001;158:813–815. doi: 10.1176/appi.ajp.158.5.813. [DOI] [PubMed] [Google Scholar]
- Kringelbach ML, Rolls ET. The functional neuroanatomy of the human orbitofrontal cortex: evidence from neuroimaging and neuropsychology. Prog Neurobiol. 2004;72:341–372. doi: 10.1016/j.pneurobio.2004.03.006. [DOI] [PubMed] [Google Scholar]
- Lange LA, Kampov-Polevoy AB, Garbutt JC. Sweet Liking and High Novelty Seeking: Independent Phenotypes Associated with Alcohol-related Problems. Alcohol Alcohol. 2010 doi: 10.1093/alcalc/agq040. agq040. [DOI] [PubMed] [Google Scholar]
- Marciani L, Pfeiffer JC, Hort J, Head K, Bush D, Taylor AJ, Spiller RC, Francis S, Gowland PA. Improved methods for fMRI studies of combined taste and aroma stimuli. J Neurosci Methods. 2006;158:186–194. doi: 10.1016/j.jneumeth.2006.05.035. [DOI] [PubMed] [Google Scholar]
- McKeown MJ, Makeig S, Brown GG, Jung TP, Kindermann SS, Bell AJ, Sejnowski TJ. Analysis of fMRI data by blind separation into independent spatial components. Hum Brain Mapp. 1998;6:160–188. doi: 10.1002/(SICI)1097-0193(1998)6:3<160::AID-HBM5>3.0.CO;2-1. [DOI] [PMC free article] [PubMed] [Google Scholar]
- Oberlin B, Best C, Matson L, Henderson A, Grahame N. Derivation and Characterization of Replicate High- and Low-Alcohol Preferring Lines of Mice and a High-Drinking Crossed HAP Line. Behav Genet. 2011;41:288–302. doi: 10.1007/s10519-010-9394-5. [DOI] [PMC free article] [PubMed] [Google Scholar]
- Odum AL, Baumann AAL. Cigarette smokers show steeper discounting of both food and cigarettes than money. Drug Alcohol Depend. 2007;91:293–296. doi: 10.1016/j.drugalcdep.2007.07.004. [DOI] [PubMed] [Google Scholar]
- Ogawa H, Wakita M, Hasegawa K, Kobayakawa T, Sakai N, Hirai T, Yamashita Y, Saito S. Functional MRI Detection of Activation in the Primary Gustatory Cortices in Humans. Chem Senses. 2005;30:583–592. doi: 10.1093/chemse/bji052. [DOI] [PubMed] [Google Scholar]
- Ogawa H. Gustatory cortex of primates: anatomy and physiology. Neurosci Res. 1994;20:1–13. doi: 10.1016/0168-0102(94)90017-5. [DOI] [PubMed] [Google Scholar]
- Overstreet DH, Kampov-Polevoy AB, Rezvani AH, Murrelle L, Halikas JA, Janowsky DS. Saccharin Intake Predicts Ethanol Intake in Genetically Heterogeneous Rats as Well as Different Rat Strains. Alcoholism: Clinical and Experimental Research. 1993;17:366–369. doi: 10.1111/j.1530-0277.1993.tb00777.x. [DOI] [PubMed] [Google Scholar]
- Pecina S, Berridge KC. Hedonic Hot Spot in Nucleus Accumbens Shell: Where Do μ-Opioids Cause Increased Hedonic Impact of Sweetness? J Neurosci. 2005;25:11777–11786. doi: 10.1523/JNEUROSCI.2329-05.2005. [DOI] [PMC free article] [PubMed] [Google Scholar]
- Rada P, Avena NM, Hoebel BG. Daily bingeing on sugar repeatedly releases dopamine in the accumbens shell. Neuroscience. 2005;134:737–744. doi: 10.1016/j.neuroscience.2005.04.043. [DOI] [PubMed] [Google Scholar]
- Scinska A, Bogucka-Bonikowska A, Koros E, Polanowska E, Habrat B, Kukwa A, Kostowski W, Bienkowski P. Taste responses in sons of male alcoholics. Alcohol Alcohol. 2001;36:79–84. doi: 10.1093/alcalc/36.1.79. [DOI] [PubMed] [Google Scholar]
- Sinclair JD, KampovPolevoy A, Stewart R, Li TK. Taste preferences in rat lines selected for low and high alcohol-consumption. Alcohol. 1992;9:155–160. doi: 10.1016/0741-8329(92)90027-8. [DOI] [PubMed] [Google Scholar]
- Small DM, Gregory MD, Mak YE, Gitelman D, Mesulam MM, Parrish T. Dissociation of neural representation of intensity and affective valuation in human gustation. Neuron. 2003;39:701–711. doi: 10.1016/s0896-6273(03)00467-7. [DOI] [PubMed] [Google Scholar]
- Tanda G, Di Chiara G. A dopamine- μ1 opioid link in the rat ventral tegmentum shared by palatable food (Fonzies) and non-psychostimulant drugs of abuse. Eur J Neurosci. 1998;10:1179–1187. doi: 10.1046/j.1460-9568.1998.00135.x. [DOI] [PubMed] [Google Scholar]
- Tremblay KA, Bona JM, Kranzler HR. Effects of a Diagnosis or Family History of Alcoholism on the Taste Intensity and Hedonic Value of Sucrose. Am J Addict. 2009;18:494–499. doi: 10.3109/10550490903206023. [DOI] [PMC free article] [PubMed] [Google Scholar]
- Wassum KM, Ostlund SB, Maidment NT, Balleine BW. Distinct opioid circuits determine the palatability and the desirability of rewarding events. PNAS. 2009;106:12512–12517. doi: 10.1073/pnas.0905874106. [DOI] [PMC free article] [PubMed] [Google Scholar]
- Woods JE, McKay PF, Masters J, Seyoum R, Chen A, La Duff L, Lewis MJ, June HL. Differential Responding for Brain Stimulation Reward and Sucrose in High-Alcohol-Drinking (HAD) and Low-Alcohol-Drinking (LAD) Rats. Alcohol Clin Exp Res. 2003;27:926–936. doi: 10.1097/01.ALC.0000071920.53470.C1. [DOI] [PubMed] [Google Scholar]
- Wrase J, Schlagenhauf F, Kienast T, Wustenberg T, Bermpohl F, Kahnt T, Beck A, Strohle A, Juckel G, Knutson B, Heinz A. Dysfunction of reward processing correlates with alcohol craving in detoxified alcoholics. NeuroImage. 2007;35:787–794. doi: 10.1016/j.neuroimage.2006.11.043. [DOI] [PubMed] [Google Scholar]
- Wronski M, Skrok-Wolska D, Samochowiec J, Ziolkowski M, Swiecicki L, Bienkowski P, Korkosz A, Zatorski P, Kukwa W, Scinska A. Perceived Intensity and Pleasantness of Sucrose Taste in Male Alcoholics. Alcohol Alcohol. 2007;42:75–79. doi: 10.1093/alcalc/agl097. [DOI] [PubMed] [Google Scholar]
Associated Data
This section collects any data citations, data availability statements, or supplementary materials included in this article.