

Significance
Robust and predictive in vitro models of human cardiac tissue function could have transformative impact on our ability to test new drugs and understand cardiac disease. Despite significant effort, the generation of high-fidelity adult-like human cardiac tissue analogs remains challenging. In this paper, we systematically explore the design criteria for pluripotent stem cell-derived engineered cardiac tissue. Parameters such as biomechanical stress during tissue remodeling, input-cell composition, electrical stimulation, and tissue geometry are evaluated. Our results suggest that a specified combination of a 3D matrix-based microenvironment, uniaxial mechanical stress, and mixtures of cardiomyocytes and fibroblasts improves the performance and maturation state of in vitro engineered cardiac tissue.
Keywords: microfabrication, heart regeneration, tissue engineering, cardiac toxicity, arrhythmia disease model
Abstract
Access to robust and information-rich human cardiac tissue models would accelerate drug-based strategies for treating heart disease. Despite significant effort, the generation of high-fidelity adult-like human cardiac tissue analogs remains challenging. We used computational modeling of tissue contraction and assembly mechanics in conjunction with microfabricated constraints to guide the design of aligned and functional 3D human pluripotent stem cell (hPSC)-derived cardiac microtissues that we term cardiac microwires (CMWs). Miniaturization of the platform circumvented the need for tissue vascularization and enabled higher-throughput image-based analysis of CMW drug responsiveness. CMW tissue properties could be tuned using electromechanical stimuli and cell composition. Specifically, controlling self-assembly of 3D tissues in aligned collagen, and pacing with point stimulation electrodes, were found to promote cardiac maturation-associated gene expression and in vivo-like electrical signal propagation. Furthermore, screening a range of hPSC-derived cardiac cell ratios identified that 75% NKX2 Homeobox 5 (NKX2-5)+ cardiomyocytes and 25% Cluster of Differentiation 90 OR (CD90)+ nonmyocytes optimized tissue remodeling dynamics and yielded enhanced structural and functional properties. Finally, we demonstrate the utility of the optimized platform in a tachycardic model of arrhythmogenesis, an aspect of cardiac electrophysiology not previously recapitulated in 3D in vitro hPSC-derived cardiac microtissue models. The design criteria identified with our CMW platform should accelerate the development of predictive in vitro assays of human heart tissue function.
Directed differentiation strategies for generating and preserving human pluripotent stem cell (hPSC)-derived cardiomyocytes (CMs) are well-developed (1–7), and several CM cell-surface markers that can be used to enrich target subpopulations have been discovered (8, 9). Although differentiation of hPSCs into contracting CMs is well-established, their maturation into adult-equivalent cells, and their formulation into functional adult-like tissue, remains an unmet challenge (5). We and others have previously developed in vitro heart tissue models (10–12); however, these recently developed systems require further definition in terms of their underlying design criteria and the impact of key design parameters such as tissue geometry and input-cell composition on microtissue properties.
In the developing heart, gradients of cytokines drive differentiation along various cardiovascular lineages and, later, the adult heart is capable of dynamically maintaining a balanced composition of cardiomyocytes, cardiac fibroblasts, smooth muscle cells, and endothelial cells within a highly ordered extracellular matrix (ECM). It is through complex cell–cell and cell–ECM interactions that the heart maintains homeostasis and, to a limited extent, repair in response to ischemic injury (13). In contrast with this native microenvironment, conventional in vitro model platforms for drug screening and toxicity testing use tissue culture-treated polystyrene surfaces coated with a basal membrane. These 2D substrates lack topographical cues, limit cell–ECM adhesion to only one side of the cell, and have an elastic modulus that is orders of magnitude greater than the native substrate of the targeted cell type. Additionally, cardiomyocytes in these assays are cultured either on their own, with conditioned media from stromal cells, or with a physiologically inappropriate proportion of supporting cell types. It is established that multiple cell types are required to build physiological tissue (14). Supporting cells, such as cardiac fibroblasts, provide mechanotransductive cues and paracrine factors that influence cardiomyocyte assembly and maturation. In addition, gradients of electrical (15) and dynamic mechanical forces (16) provide critical electro- and mechanotransduction signaling throughout development and maturation (17) and following disease, injury, and repair. Cell morphology (18), rate of proliferation, migration (19), differentiation potential (20), drug responsiveness (12), and juxtracrine signaling (21) are all influenced by ECM-mediated mechanotransduction. To accurately determine the effects of test compounds, the niche of the target cell type—CMs in this case—must be recapitulated in an in vitro model. To engineer this niche, however, key design criteria must be established.
Engineered myocardial tissue models have been used to both elucidate fundamental features of myocardial biology and develop organotypic in vitro model systems for screening. Our previous engineered heart tissue design, which used centimeter-scale collagen scaffolds, had an isotropic matrix architecture (that induced limited CM alignment) and heterogeneity in spatial cell distribution within the volume of the matrix (10). Eschenhagen and coworkers have advanced the field by developing aligned tissue models suitable for some multiwell-plate analytics and that are capable of measuring forces of contraction (22). Together, these and other systems (23, 24) have already proven their utility as models for cell transplantation (25) and drug candidate evaluation (12, 26, 27). We have recently used microfabrication to miniaturize such aligned tissue models into microscale tissues (11). Despite these significant advances, we still do not have established criteria for the design and formulation of 3D microtissues, particularly with respect to input-cell composition, ECM–cell interactions during remodeling mediated by biomechanical forces, accessibility to rapid nondestructive measurements, tissue geometry and cell alignment properties, and, importantly, reproducible electrophysiological properties.
We describe an integrated computational and experimental strategy for the rational design of cardiac microtissues from cardiac differentiated hPSC derivatives. Our so-called cardiac microwire (CMW) system formulated NKX2-5+ cardiomyocytes and CD90+ nonmyocytes with electromechanical stimulation to generate microtissues that reproducibly mimic morphologic and functional properties of adult tissue. CMWs maintained densely aligned architectures and exhibited cell composition-specific remodeling, functional responsiveness to chemicals, and condition-specific gene expression patterns. In proof-of-principle studies, we demonstrated the utility of the platform in modeling tachycardia induced by arrhythmogenic cardiomyopathy, an aspect of cardiac electrophysiology not previously described using a cardiac microtissue model. The design criteria identified herein should accelerate the development of predictive in vitro assays of human heart tissue function.
Results
Finite-Element Modeling Predicts Stress-Mediated Assembly and Alignment of Cardiac Microtissues.
Studies have repeatedly shown the impact of a 3D ECM microenvironment on the gene expression and functionality of contained cells, independent of cues from soluble factors. We reasoned that to engineer a more accurate heart cell niche, we would need to transition from 2D substrates to a 3D cell-encapsulating ECM geometry. To achieve this, we exploited the ability of single cells to remodel through their adhesion and contraction of the ECM. We engineered a versatile microfabricated platform and seeding protocol to increase the throughput of our studies (SI Appendix, Fig. S1). Although we were successful in generating cardiac microtissues, the geometries and seeding compositions were determined without precise design criteria and, as a result, the formed microtissues were variable and lacked robustness (SI Appendix, Fig. S2). Dissociated heart cells encapsulated in a gel will go through several phases: recovery of actin filaments and extension of filopodia, accumulation and assembly of cell-adhesion molecules that help with remodeling, increased expression of gap-junctional and contractile proteins, and finally excitation–contraction coupling, which permits the cardiac tissue to propagate action potentials and contract in unison (28). We hypothesized that by simulating the early remodeling process of gel compaction due to cell-traction forces, we would gain insight into rational design criteria for generating cardiac microtissues.
To provide insight into the stress-mediated formation and contractility of sarcomere filaments in cardiac microtissues, we developed finite-element (FE) models of microtissue and substrate geometries in our platform using a constitutive framework that accounts for the dynamic reorganization and contractility of the cytoskeleton (29). This framework has previously been implemented for the modeling of stress fiber contractility in a range of cell phenotypes (30–33) and for simulation of the response of cells to applied shear (34) and compression (35, 36) loading. Here it is adapted for the simulation of sarcomeric filaments in cardiomyocytes on the basis that both stress fibers and sarcomeric filaments are composed of and operate via actin–myosin interactions. Details of the constitutive model are provided in SI Appendix. Briefly, stabilized sarcomeres are predicted when the tension that is actively generated by sarcomeres is structurally supported in the microtissue. A reduction in tension in a given orientation results in a dissociation of actin–myosin contractile filaments in that direction, as illustrated in Fig. 1. As a first step, we explored in silico strategies to spatially predict stress distributions and sarcomere formation within complementary 3D tissue geometries, elucidating the relationship between the local microtissue stress state and sarcomere formation. Two microtissue geometries (Fig. 1) were simulated using our FE-based microtissue contractility model (29): (i) a square-shaped microtissue geometry designed to promote the generation of predominantly biaxial intratissue tension forces (BITFs), and (ii) a wire-shaped microtissue geometry designed to promote the generation of predominantly uniaxial intratissue tension forces (UNITFs).
Fig. 1.

Overview of experimental and computational strategies for investigating the evolution and contractility of sarcomeric filaments in cardiac microtissues. Two microtissue geometries were simulated using a finite element-based computational model: The first modeled biaxial intratissue tension forces, and the other modeled uniaxial intratissue tension forces, which we termed cardiac microwire. Simulations allowed sarcomeric α-actinin formation in all directions in the finite-element mesh. A cartoon of a representative volume element (RVE) within the finite-element mesh is provided for illustration. The nondimensional sarcomere activation level, η(ϕ), is computed in all directions (ϕ). A first-order kinetic equation governs the evolution of sarcomeric filaments, whereby filament formation is driven by a signal that decays exponentially with time. The dimensionless constants kf and kb govern the rates of formation and dissociation, respectively, of the sarcomere filaments. For additional simulation details, please see SI Appendix.
Computational results are presented in terms of a nondimensional effective uniaxial stress invariant ( ) and in terms of the level of aligned sarcomere formation (
 ) (see SI Appendix for model output details). The predicted distribution and alignment of both quantities throughout the BITF and UNITF microtissues are shown in Fig. 2. Peripheral regions of the BITF microtissue experience a uniaxial stress state parallel to the microtissue boundaries (Fig. 2A, Left). In contrast, a biaxial stress state is predicted in the center of the BITF microtissues. As shown in Fig. 2B, the distribution and alignment of sarcomeres (
 ) corresponds closely to that of
  . In the UNITF microtissue, a highly uniaxial stress state is generated throughout the longitudinal length, producing a uniform regime of uniaxial intratissue tension (Fig. 2B, Upper). A corresponding uniform distribution of highly aligned sarcomeres is also predicted in this region (Fig. 2B, Lower). In summary, aligned sarcomere formation is predicted in regions where the local stress state is uniaxial in nature (as
  → 1). In contrast, sarcomere structures are not computed in regions of the microtissue where the local stress state is biaxial in nature (as
  → 0). The computed evolution of the stress and sarcomere distributions throughout the microtissue geometries is presented in SI Appendix, Figs. S3–S7.
Fig. 2.

Self-assembling microtissues composed of heart cells in the ECM induce stress-mediated alignment and patterned expression of sarcomeric filaments. (A) Simulation predicts stress (represented by nondimensional effective stress;  ) and sarcomeric expression (represented by
  ) in BITF microtissue geometry colocalizing in border regions. (B) The simulation predicts stress and sarcomeric α-actinin expression in CMW geometry along the longitudinal axis. (C) Immunostaining for sarcomeric α-actinin (green) confirms expression in border regions of BITF microtissue. (D) Immunostaining for sarcomeric α-actinin (green; Upper) and cardiac troponin T (green; Lower) in CMWs confirms sarcomere protein expression in all regions along the longitudinal axis. DAPI-stained nuclei are shown in blue.
To empirically validate these predictions, we generated substrates as before, but now using the geometries specified in the computational models (SI Appendix, Fig. S8 A and B). We designed disk inserts containing the recessed arrayed poly(dimethylsiloxane) microwells and affixed them inside the bottom wells of a universal 24-well tissue-culture plate (SI Appendix, Fig. S8 C and D). We termed the UNITF microtissue the cardiac microwire. Rat neonatal heart cells were next used to test the system. We observed cells begin to extend filopodia and remodel the surrounding collagen matrix, and within 3 d the microtissues had formed and hit a plateau in morphology. Along with time in culture, we observed that higher concentrations of collagen prolonged the time and extent of microtissue remodeling, as did lowering the input-cell density. As predicted by our model, overall sarcomere expression in the BITF microtissue was observed to be spatially heterogeneous as revealed by immunostaining for cardiac sarcomeric proteins (Fig. 2C) in comparison with CMW (Fig. 2D). Also predicted by the model, regions exhibiting highly aligned sarcomeres correlated with areas of high stress. Morphologies of CMs in the BITF and CMW microtissues mirrored that of CMs on unaligned and aligned collagen substrates (SI Appendix, Fig. S9). In areas where our model predicted alignment due to high uniaxial stress, we observed elongated and oriented cell alignment parallel to modeled localized stress (Fig. 3 C and D). To test whether the induced alignment in the microtissues was similarly due to topographical cues (via the remodeled and aligned collagen fibrils), we probed the CMW after 3 d of remodeling using the LC-PolScope [Cambridge Research and Instrumentation (CRi)] quantitative birefringence imaging system. The color of the pixel in PolScope micrographs determines the orientation angle of the fibrillar collagen. We confirmed that the fibrillar collagen within the CMW was indeed remodeled and aligned in parallel to the longitudinal axis of the CMW (Fig. 2 D and E).
Fig. 3.

Aligned tissue architecture can be induced by controlling ECM topography and intratissue mechanical stress. (A) Cell elongation of heart cells on pseudo-3D–aligned and unaligned collagen substrates (Left) and cell elongation of heart cells in CMWs (Right). Measurement of cell elongation is the ratio of the major axis to the minor axis of a cell. (B) Cell orientation of heart cells on pseudo-3D–aligned and unaligned collagen substrates (Left) and cell orientation of heart cells in CMWs (Right). Measurement of cell orientation on pseudo-3D substrates is relative to the direction of alignment of patterned collagen. Measurement of cell orientation in CMWs is relative to the direction of the longitudinal axis. (C and D) Fibrillar collagen content of CMWs measured with the quantitative birefringence imaging system. Pixel color corresponds to the angle of birefringent fibrillar collagen in CMWs. (Insets) Higher-magnification images. (C) CMW held taut shows unidirectionally aligned collagen. (D) Compacted CMW maintains fibrillar collagen alignment in the direction of the curl. Data are reported as the mean ± SEM. *P < 0.05 (Mann–Whitney U test).
These results show that cardiac microtissues under uniaxial tension forces give rise to highly aligned tissues expressing spatially homogeneous contractile proteins that may better mimic cardiac muscle fibers in vitro. However, we were unable to explain the varying degrees of tissue organization (due to remodeling) observed with different input-cardiac cell numbers. To formally investigate this variability of assembly and phenotype in our tissues, we hypothesized that controlling cell composition may mitigate this effect.
Input-Population Composition Impacts Tissue Morphogenesis and Cardiac Gene Expression.
To test the hypothesis that cell composition would affect tissue physiology, and to extend our analysis to the formulation of more translationally relevant human cardiac microtissues, we sorted hPSC-derived heart cells to generate tissues with specific input populations consisting of NKX2-5+ cardiomyocytes and CD90+ nonmyocytes (putatively fibroblasts; FBs). We applied our cardiac differentiation protocol to an NKX2-5-GFP reporter human embryonic stem cell (hESC) line that contained the EGFP cDNA inserted into the NKX2-5-GFP locus of HES3 hESC (1, 9). On day 20, we dissociated the hESC–CM aggregates and sorted for both of these populations to high purity (Fig. 4A). We generated CMWs of specific CM-to-FB ratios and controlled spherical reaggregates of the same ratios to exclude effects due to dissociation, flow sorting, and reaggregation. Conditions of the ratios 100:0, 75:25, 50:50, and 25:75 correspond, respectively, to 100%, 75%, 50%, and 25% of NKX2-5-GFP+ cells, with the remainder consisting of CD90+ cells (Fig. 4B). Both the CMW and reaggregate microtissues were cultured for 7 d. We observed familiar remodeling kinetics compared with our previous experiments; however, there were clear differences in tissue morphology and physiology between the tissue composition conditions (SI Appendix, Table S1). ECM remodeling was observed in all conditions; however, limited gel compaction was observed in 100:0 CMWs, likely due to the lack of FB-associated tissue remodeling (37). As the ratio of CD90+ cells increased, we observed tighter, and more integrated, tissue morphologies under higher apparent tension. CMWs formulated with ratios of 50:50 and 25:75 did not maintain tissue integrity to day 7 and failed due to tension induced by fibrosis. Spontaneous contractions were documented on day 7 for 100:0 and 75:25 CMWs, with limited contractions observed in 50:50 CMWs. Synchronous contractions were only observed in 75:25 and 50:50 CMWs; 100:0 CMWs formed unstable tissue (in both the distal and medial locations) with minimal cell–cell and cell–ECM integration and were undergoing asynchronous contractions (Fig. 4C, Upper Left). These CMWs contained nonintegrating globular aggregates of cells separated by patches of collagen (SI Appendix, Movies S1 and S2). Live-cell imaging of NKX2-5-GFP+ cells in the tissues confirmed that the globular areas were 3D clusters of CMs that had either proliferated into colonies or had conglomerated into clusters over time (Fig. 4C, Lower Left). As the percentage of CD90+ cells reached 25%, however, the CMWs took on a more robust architecture, with synchronous contractions resembling in vivo-like tissue morphology (Fig. 4C, Right and SI Appendix, Movies S3 and S4). As a result, further electrophysiological measurements on day 7, including conduction velocity, were amenable only in the 75:25 condition.
Fig. 4.
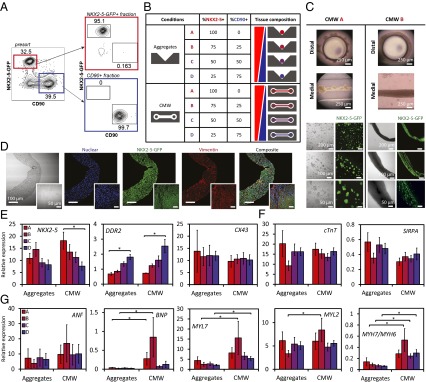
Controlling input-population compositions of hPSC-derived heart cells guides tissue morphogenesis and levels of maturation in CMWs. (A) Flow cytometric cell-sorting plots of NKX2-5-GFP+ (cardiomyocytes) and CD90+ (fibroblasts) mixing experiments. Fluorescence-activated cell sorting of day 20 embryonic stem cell-derived embryoid bodies. EBs were dissociated and sorted for NKX2-5-GFP+ (red gate) and CD90+ (blue gate) fractions (Left). Purity control of NKX2-5-GFP+– and CD90+-sorted fractions (Right). (B) NKX2-5-GFP+ cells and CD90+ cells were sorted from hPSC–CMs and mixed at specific ratios in CMWs and aggregates. (C) CMWs composed of pure NKX2-5-GFP+ cells (CMW A) formed tissues consisting of nonintegrating globular colonies of cells (Left). Live-cell imaging of the tissues indicated that the globular areas were 3D colonies of CMs. CMWs composed of 75% NKX2-5-GFP+ cells and 25% CD90+ cells (CMW B) produced well-integrated tissue with robust architecture (Right). Bright-field live (Upper) and fluorescence images are shown (Lower). NKX2-5-GFP+ cells are shown in green. (D) Immunofluorescence micrographs of CMWs of condition CMW B are shown. (Insets) Immunofluorescence micrographs of nondissociated hESC–CM aggregates. DAPI-stained nuclei are shown in blue, NKX2-5-GFP+ cells are shown in green, and vimentin expression is shown in red. (E) Gene expression of cardiomyocyte and nonmyocyte control markers shows input-cell composition of CMWs relative to aggregates. (F) Gene expression of cardiomyocyte control markers, normalized to NKX2-5 expression, in CMWs relative to aggregates. (G) Gene expression of cardiomyocyte maturation markers, normalized to NKX2-5 expression. Conditions A, B, C, and D correspond, respectively, to 100%, 75%, 50%, and 25% NKX2-5-GFP+ cells, with the remainder consisting of CD90+ cells. Data are reported as the mean ± SEM. *P < 0.05 (Mann–Whitney U test).
To determine the spatial localization of the FB population within the tissues before and after tissue formation, we stained and imaged for vimentin (intermediate filaments), a common FB marker. FBs in nondissociated hESC–CM aggregates (Fig. 4D, Insets and SI Appendix, Fig. S10A) displayed spatial heterogeneity and fibrotic-like areas within the tissue. In 75:25 CMWs, however, FBs and CMs displayed spatial homogeneity, with evenly dispersed marker expression (Fig. 4D and SI Appendix, Fig. S10).
Aligned tissue and ultrastructure in the 75:25 CMWs, in comparison with aggregates of the same formulation (SI Appendix, Fig. S11), demonstrate the benefits of uniaxial stress with respect to cell spatial organization, apparent cell density, and cell alignment. It is noteworthy that tissue density is higher in CMWs compared with aggregates. Additionally, despite seeding in collagen, there is very little collagen present after the remodeling phase in our CMWs, as evident by lack of collagen (blue) present in our trichrome staining (SI Appendix, Fig. S11B). Ultrastructure analysis using Transmission Electron Microscopy (TEM) demonstrated increased length and alignment of the myofibrils and sarcomeres, as well as the presence of Z disks and H zones in the CMWs, relative to aggregate controls (SI Appendix, Fig. S12).
To study further effects of tissue formulation on tissue development, we examined gene expression of key cardiac maturation markers in our CMWs with respect to aggregates of identical formulation after 7 d in culture. We first looked at control cardiomyocyte markers for determining dilution consistency of input-cell composition. The NKX2-5 gene was the basis of initial CM sorting, and so we used it as both a control and a normalizing factor for measured cardiac-specific genes. As expected, NKX2-5 expression showed a decreasing trend with increasing dilution of CMs in the engineered tissue (Fig. 4E), save for the 75:25 aggregate condition. This may perhaps be due to an optimal balance of CM-supportive factors or cell–cell contact (via CD90+ cells) in the matrix-free aggregates compared with the encapsulated CMWs. DDR2, a marker for FBs, showed a significantly increasing trend with decreasing dilution of CD90+ cells. Cx43, expressed in both CMs and FBs, showed consistently level trends. CM marker expression [Signal-regulatory protein α (SIRPA) and cTnT] in both aggregates and CMWs also remained consistently level after being normalized to NKX2-5 (Fig. 4F). By effectively controlling for CM number by normalizing all CM-specific genes to NKX2-5, we diminished the differences in CM control marker expression within the four conditions. These results indicate that CMWs maintain their initial dilution consistency, and that there are no significant variations of control CM genes among conditions once tissue-fraction CM number is controlled for.
We next examined the impact of tissue formulation and composition on a panel of CM-specific genes indicative of CM maturation. Markers of CM maturation (ANF, BNP, MYL2, MYL7, MYH6, and MYH7) were also normalized to NKX2-5 expression levels to account for varying CM numbers in the mixed population of tissue. Atrial natriuretic factor (ANF), secreted by the atria, and brain natriuretic peptide (BNP), secreted by the ventricle, are cardiac hormones that are involved in normal and diseased heart physiology. Although we did not see an increase of ANF expression in CMWs relative to the control aggregates, significantly increased BNP expression was observed in CMWs in both the 100:0 and 75:25 conditions relative to aggregates. Expression levels of MYL2 (MLC2v) and MYL7 (MLC2a), genes specific to sarcomere structure, were both also observed to be higher in the 75:25 CMWs. Although there were no significant differences in MYH6 (α-MHC) expression between conditions, MYH7 (β-MHC) expression was significantly higher for both the 75:25 and 50:50 conditions. The ratio of MYH7:MYH6, an indicative ratio of maturation, was found to be increased in CMWs for all conditions except the 100:0 condition (Fig. 4G). The up-regulation of these genes correlates with the conduction velocity of cardiac muscle, and may be due to the well-integrated and synchronously contracting tissues in the mixed-FB conditions.
It is evident from these gene expression data that there is an interactive effect between the biophysical microenvironment (aggregate versus CMW) and cell composition of tissue (ratio of CM to putative FB). The 75:25 CMW condition was optimal in terms of tissue morphology, and the CMW tissues (relative to the control aggregates) promoted more mature cardiac-specific gene expression. These findings suggest that the combination of a 3D matrix-based microenvironment under uniaxial mechanical stresses with a supporting cell-type fraction (25% CD90+ cells in this case) is a strategic focus in the design criteria of in vitro engineered tissues.
Electrophysiological Assessment of CMWs Indicates Functional Maturation and Disposition to Modulation Using Electrical Stimulation.
Our results thus far indicate that tissue phenotype is shaped in part by mechanical forces, input-cell composition, and the composition of the extracellular matrix microenvironment. More specifically, we determined that 75:25 microtissues gave rise to more architecturally robust phenotypes compared with other cell compositions, and our CMWs provided a microenvironment that promoted the increased expression of CM-specific maturation genes. We next wanted to determine whether our 75:25 ratio could be used to study other cardiac tissue properties. Differentiated input populations of CMWs were selected to fall within an acceptable range of 75:25 CMWs (75 ± 10% cTnT+) and were cultured for at least 7 d before being functionally assayed. We focused on studying the excitability, resiliency to high-frequency pacing, and conductivity of our 75:25 CMWs because these have been previously shown to be indicative of electrophysiological improvement in CMs. Excitation threshold and maximum capture rate of CMWs improved significantly compared with hESC–CM aggregates (Fig. 5 A and B). Maximum capture rate improved even further when CMWs were electrically point-stimulated with a biphasic square wave pulse for 3 d. This was achieved by integrating the two flanking posts within the CMW microwell with platinum wire electrodes to provide electrical point-stimulation capability (SI Appendix, Fig. S8C). Point stimulation allows for sequential activation of cells and promotes alignment of gap junctions (which also occurs in normal heart maturation) as opposed to field stimulation, which simultaneously stimulates all cells in a tissue. We perturbed CMWs using drugs of known effects and optically mapped their response [transmembrane action potential (AP) and intracellular calcium transient] using voltage- and calcium-sensitive dyes, respectively. Addition of epinephrine (0.1 µg/mL), an adrenergic neurotransmitter, to CMWs increased the activation rate relative to the baseline, whereas adding increasing concentrations of lidocaine (2 μg/mL), an antiarrhythmic drug, reduced and nearly abolished activation (Fig. 5C). Adding verapamil (0.25 μg/mL), an L-type Ca2+-channel blocker, reduced the amplitude of calcium waves in CMWs relative to the baseline, and supplementing with epinephrine increased the rate of calcium transients (Fig. 5D). We also recorded conduction velocities of CMWs and compared them with healthy (38) and diseased (39) conduction velocities of the human heart (Table 1). Remarkably, CMW conduction velocity (47.4 ± 12.4 cm/s) was found to be comparable to that of a healthy human heart (46.4 ± 2.7 cm/s).
Fig. 5.

Functional assessment of CMWs indicates that electrical stimulation improves electrophysiological properties. (A) Excitation threshold and (B) maximum capture rate of nondissociated hESC–CM aggregates, nonstimulated CMWs, and stimulated CMWs. (C and D) Optical mapping was used to record transmembrane action potentials and intracellular calcium transients in CMWs. (C) Mapping of transmembrane action potentials revealed that epinephrine (0.1 µg/mL), an adrenergic neurotransmitter, increased the activation rate (ii), and lidocaine (2.0 µg/mL), an antiarrhythmic drug, decreased the activation rate (iii and iv) relative to the baseline control (i). (D) Mapping of intracellular calcium transients revealed verapamil (0.25 µg/mL), an L-type Ca2+-channel blocker, reduced the amplitude of calcium waves in CMWs (ii) relative to the baseline control (i). Further supplementing with epinephrine increased the rate of calcium transients (iii). Df/f, change in fluorescence intensity relative to fluorescence intensity at baseline. Data are reported as the mean ± SEM. *P < 0.05 (Mann–Whitney U test).
Table 1.
Comparison of conduction velocities of native human heart tissue and the CMW system
| Subject | Conduction velocity, cm/s | Ref. |
| Human CMWs | 47.4 ± 12.4 | — |
| Healthy human heart | 46.4 ± 2.7 | (38) |
| Healthy human heart, Purkinje fibers | ∼2,000 | (38) |
| Cardiomyopathic human heart during pacing | 41 (min)–87 (max) | (39) |
| Cardiomyopathic human heart during ventricular fibrillation | 25 ± 4.0 | (39) |
Values of normal and pathophysiological conduction velocities of the human heart obtained from the literature are shown. Values for CMWs were measured from three separate experiments via optical-mapping techniques. Microengineered CMWs were found to exhibit conduction velocities on par with the epicardium of a healthy human heart. Data are reported as the mean ± SEM.
As an extension, we studied and manipulated the dynamics of activation propagation in CMWs. Typically, in the linear CMW geometry, we observe a normal activation propagation initiate in one of the distal ends, converge, traverse down the longitudinal axis, diverge at the fork at the neck, and terminate at the distal end of the opposite tissue loop (Fig. 6A and SI Appendix, Movie S5). We next showed the ability to manipulate activation propagation directionality in CMWs using electrical point stimulation. Starting with CMWs with spontaneous activation propagation traversing from left to right (or right to left) (Fig. 6B, Upper and SI Appendix, Movie S6), we reversed the activation propagation direction by electrically pacing from the opposite end (Fig. 6B, Lower and SI Appendix, Movie S7) in all test cases. When the point stimulus was removed, however, the propagation direction reverted to the original direction of spontaneous propagation (SI Appendix, Table S2). In some cases of CMWs presenting spontaneous electrical activity, however, we noticed a perturbation that led to unidirectional conduction block at the junction of the medial and distal site (Fig. 6C and SI Appendix, Movie S8). These unidirectional conduction blocks gave rise to incomplete looped activation propagation trajectories similar to reentrant waves in arrhythmias caused by scar formation; however, they did not reenter the circuit and did not lead to arrhythmia. We then extended our design to better model a reentrant wave in a tachycardic heart by manipulating the geometry of our linear CMWs. CMWs were generated using a circular template substrate to create a ring of tissue mimicking a reentrant wave during tachycardia around functionally unexcitable scar tissue. Circular CMWs (CMWcirc) were seeded as previously described and cultured for 14 d before assaying (SI Appendix, Movie S9). Reproducibility of CMWcirc remodeling was high both within replicates (SI Appendix, Movie S10) and between separate experiments. Interestingly, the majority of CMWcirc were observed to be in a reentrant state of arrhythmia after 14 d of culture (82% ± 8%) (SI Appendix, Table S3 and Movie S11) and the rest were in normal rhythms (SI Appendix, Movie S12). Electrophysiological assessment revealed spontaneous infinite loop-like cycles of activation propagation traversing the ring as expected (Fig. 6D). Trace recordings indicate a high-frequency activation rate with no rest period. Please see SI Appendix, Movie S13 for a video of multiple cycles of activation propagation. We next aimed to “defibrillate” the CMWcirc from a reentrant state of arrhythmia to a normal rhythm state. Using carbon electrodes spaced 1 cm apart, CMWcirc were field-stimulated at 10 V for 3 s. After a 2- to 3-s period of inactivity, the CMWcirc recovered to a normal rhythm (∼1 Hz) in all test cases (Fig. 6E and SI Appendix, Movie S14). Following culture of an additional 7 d, the majority of CMWcirc remained in normal rhythm (95% ± 4%), while a small percentage degenerated back to an arrhythmic state (5% ± 4%). We have shown here that by simply modulating the geometry of our tissue, we can recapitulate basic elements of a disease model—in this case, tachycardia in a model of arrhythmogenic cardiomyopathy.
Fig. 6.

CMW activation propagation is disposed to directional modulation using electrical stimulation. (A) Activation propagation of normal CMWs. Each panel depicts a time lapse of the activation propagation along the longitudinal axis of the CMW. Phase-contrast image of CMWs, isochronal map, and timescale are indicated. (B) Direction of spontaneous activation propagation of normal CMWs (Upper) can be reversed using electrical point stimulation (Lower). (C) Activation propagation of CMWs observed to be obstructed by a conduction block, resulting in an incomplete reentrant wave-like system. (D) CMWs generated using a circular substrate (CMWcirc) designed to create a ring of tissue mimicking a reentrant wave during arrhythmia. Assessment revealed spontaneous infinite loop-like cycles of activation propagation traversing the ring; one cycle is shown. Signal tracings show multiple cycles. (E) Normal rhythm was observed in CMWcirc after defibrillation. An electrical field stimulation of 10 V was used to defibrillate arrhythmias in CMWcirc geometries to a normal rhythm. Signal tracings show multiple cycles. The initiation site in blue (I*) indicates the starting location of impulse propagation, and the termination site in blue (T*) indicates the final location of impulse propagation.
Discussion
Cardiac tissue engineering, whether for transplantation or in vitro modeling, requires key design criteria and processes for robust and reproducible results. The design methods and results presented here are, to our knowledge, a unique method of combining computational approaches with tissue design and “bottom-up” construction of hPSC-derived heart tissue using transcription- and surface marker-delineated heart cell populations. We demonstrate the importance of understanding and modulating (i) the biomechanical microenvironment and associated effects on spatial organization of structural and functional proteins during tissue growth in three dimensions, (ii) the cell composition of tissue and subsequent cell–cell and cell–ECM interactions, and, finally, (iii) the effect of geometry on tissue physiology. Previous studies proposing hPSC–CM–based in vitro models have not accounted for effects of intratissue stresses in the design phase with the aid of computational models simulating actin polymerization and myosin phosphorylation. Additionally, in previous studies, cell composition is usually not precisely engineered and, in the cases where input population was determined, none have studied the effects of ratio-based formulations of cocultured functional and stromal cell types.
In this study, we have adapted an FE model of tissue contractility via the active remodeling of stress fibers to describe the evolution and contractility of sarcomeric filaments in in vitro cardiac microtissues. With this unique approach in determining design criteria for engineered tissue, we have demonstrated the importance of uniaxial stress-mediated sarcomere filament formation for building tissue expressing spatially homogeneous sarcomeric protein. Certainly insight from such in silico models, with the capability to recapitulate the organization and remodeling of the cytoskeleton, can have significant impact in the understanding and modulation of tissue morphogenesis in tissue-engineering applications.
Importantly, results from our sorting studies highlight the importance of tissue composition due to improved functional assembly in CMWs composed of 75% NKX2-5+ and 25% CD90+ cells and improved mature cardiac gene expression in CMWs (relative to aggregates in select compositions). We report increased gene expression levels in CMWs of key cardiac maturation markers, including genes implicated in sarcomere structure, as well BNP, which increases during the fetal heart gene program when organogenesis commences (40). We speculate that there may be high expression of integrins and adhesion proteins in the CD90+ cells that promotes ECM remodeling and, as a direct result, bring cells together during tissue contraction to promote cell–cell contact, which has been shown to facilitate maturation signaling (41–43). Putatively fibroblasts, these CD90+ cells may also secrete growth factors such as bFGF and VEGF. Additionally, the remodeling may provide mechanotransductive cues such as tension forces, and in turn induce CM elongation and alignment.
In our optimal CMW system, we report conduction velocities on par with that of a healthy adult heart. We also show the capability of modulating activation propagation direction using electrical stimulation. Our ability to generate arrhythmic models, and then to defibrillate the arrhythmia to a normal rhythm, demonstrates the CMWcirc system’s versatility and potential as a disease model and may serve as a platform to test the impact of antiarrhythmic drugs. Previous in vitro models of arrhythmogenesis do not exhibit the reproducibility and robustness of the CMWcirc system, and additionally are not derived from hPSCs constructed in 3D tissue. Conversely, we plan to use the normal rhythm model as a tool to screen for proarrhythmic compounds.
The complete set of microenvironmental parameters of the myocardial niche was not recapitulated in our system, and so may likely explain our shortcoming of reaching some outputs from our CMWs that parallel that of native heart tissue. Indeed, there are other cell types and tissues not accounted for, including endothelial and immune cells in our system, along with their associated paracrine signaling. Nonetheless, our current model contains a basic subset of the elements needed to carry forward a sophisticated high-content screen of small molecules.
The versatility and customizability of the CMW platform allows for a variety of cell types and geometries to be generated en masse. For example, using the CMWcirc geometry, noncardiac 3D tissue cocultures can be spatially engineered whereby an initial stromal cell type, endothelial cells for instance, can be seeded and permitted to remodel. Next, a second functional cell can be seeded circumferentially around the endothelium to create concentrically adjacent tissue types. Intertissue interactions between the adjacent tissue types can then be studied in a 3D tissue-like environment.
In conclusion, we demonstrate a bottom-up approach for the engineering of cardiac microtissues with the consideration of key design criteria. The robustness, flexibility, and increased throughput of our CMW platform highlight its potential as a powerful tool as an in vitro model for the screening of small molecules toward heart-regeneration therapies. Next-generation tissue-engineering approaches, to be effective, need to integrate these self-organization–based design criteria to build functional and reproducible tissue.
Materials and Methods
Isolation of Rat Neonatal Cardiomyocytes.
Rat neonatal cardiomyocytes were isolated as previously reported (10). Briefly, hearts were isolated from 1- to 2-d-old neonatal Sprague–Dawley rats using protocol approved by the University of Toronto Committee on Animal Care. Rat hearts of one or two litters of ∼13 pups per litter were aseptically excised and placed in cold HBSS (Sigma), washed several times with HBSS, and quartered. Quartered hearts were then incubated overnight at 4 °C in a 0.06% (wt/vol) solution of trypsin (Gibco) in HBSS on an orbital shaker at 0.5 × g (Labent Orbit LS; Mandel). After 14–16 h, hearts were washed with CM culture medium [high-glucose (4.5 g/L) DMEM with l-glutamine (Gibco) supplemented with 10% (vol/vol) FBS (Gibco), 1% (vol/vol) penicillin/streptomycin (Gibco), and 1% (vol/vol) Hepes (Gibco)] and subjected to a series of five digests (8 min, 37 °C, 1 × g) in a 0.1% (wt/vol) solution of collagenase type II (Worthington) in HBSS. The supernatant of each digest was collected, centrifuged (5 min, 150 × g), and resuspended in CM medium. Cells were preplated for 60 min on tissue-culture polystyrene T75 flasks (BD Falcon) to enrich for cardiomyocytes (nonadherent cells). The supernatant was collected, and cell number was determined via trypan blue (Gibco) exclusion.
Cardiac Differentiation of Human Embryonic Stem Cells.
Cardiac differentiation of human embryonic stem cells was carried out as reported previously (44). In this study, the HES2 (ES Cell International) hESC line was used. The hESCs were maintained and expanded as described previously. Briefly, HES2 cells were passaged (up to five times) on mouse embryonic feeders (MEFs) for 6 d in HES2 maintenance media (80% DMEM/F12, 20% KOSR, 20 ng/mL bFGF, 0.5% P/S, 1% NEAA, 1% BME); media were changed daily. Cells were maintained in normoxia at 37 °C in a 5.0% CO2 atmosphere. The cells were then trypsinized along with MEFs and plated onto Matrigel (diluted 1:30)-coated plates at a split ratio of 1:3 for MEF depletion. After 2 d of MEF depletion, HES2 cells were again trypsinized and seeded into AggreWells (Stemcell Technologies) manufactured in-house to form human embryoid bodies (hEBs). The hEBs were generated using 400-µm microwell poly(dimethylsiloxane) (PDMS) inserts cast from a silicon master mold. The inserts were cut and glued into 24-well tissue-culture plates and then sterilized using ethanol. The microwells were then coated with 5% pluronic acid for at least an hour and washed with PBS before cell seeding. A single-cell suspension of aggregation media containing base media and T0 (day 0 of differentiation) cytokines supplemented with ROCK inhibitor Y-27632 was then seeded into the wells and allowed to aggregate overnight after centrifuging at 200 × g. Cells were maintained in hypoxia at 37 °C in a 5.0% CO2 and 5.0% O2 atmosphere. After 24 h, hEBs were formed and aggregation media were exchanged for T1 media. On day 4, hEBs were removed from the AggreWells and placed in low-cluster six-well plates (Nunc). Corresponding media for T4, T8, and T12 were freshly made and exchanged. On T12, cells were returned to normoxia at 37 °C in a 5.0% CO2 atmosphere. Media were replaced every 8 d onward.
Microfabrication.
Masks for master patterning were designed using AutoCAD (Autodesk) and printed at a resolution of 20,000 dots per inch (CAD/Art Services). Microfluidic cell-culture devices were fabricated at the Emerging Communications Technology Institute cleanroom at the University of Toronto. Briefly, piranha-washed 3 × 5-inch clean glass slides (Corning) were given a brief wash in acetone and blow-dried under a clean stream of nitrogen gas. A seed layer of SU-8-5 (MicroChem; 7 μm high) was spin-coated onto the surface to allow for feature-layer bonding. Following a dehydration bake for 20 min on a 100-°C hot plate, the slides were then cooled to 65 °C and removed from the hot plate to return to room temperature. The seed layer was exposed to UV and postbake was intiated as before. The slides with the seed layers had two spin-coated layers of SU-8-50 (MicroChem) applied sequentially (including pre- and postbakes) to reach a feature-layer height of 300 μm. The designed mask was UV-exposed onto the master with a 300-μm–high feature layer. Postbake, sufficient time was allowed for cooling. Immersion in developer (MicroChem) on a sonicator or orbital shaker was done until un–cross-linked SU-8 was washed away thoroughly. Masters were oven-baked for 3 d at 75 °C to allow proper bonding of the feature layer to the glass slide. Masters were silanized in a desiccator overnight. Primary replicates were manufactured by molding PDMS (Dow Corning) on SU-8 masters at 65 °C overnight. Replicates were modified under a stereomicroscope, and a negative master was molded using polyurethane (SmoothCast). Final substrates were then PDMS-molded from these negative masters and outfitted onto a 24-well tissue-culture plate.
Generation, Cultivation, and Imaging of Cardiac Microtissues.
Either rat neonatal CMs or hESC-derived CMs were suspended in a collagen master mix and seeded into cardiac microtissue wells at a density of 0.5 × 10⁶ cells per mL. Microwell substrates were prepared by sterilizing with ethanol and washing and coating with 5% (wt/vol) pluronic acid for at least an hour each. During the coating, rat neonatal CMs and/or hESC-derived CMs were prepared. Aggregates from hESC–CM differentiation were put in collagenase type II (1 mg/mL; Sigma) for 1 h with DNase in an incubator. Aggregates were then immersed in 0.25% trypsin for 5–10 min with DNase. Aggregates were then immersed in STOP solution (50% FBS and 50% DMEM/F12) and triturated with a 20-gauge syringe 10 times. Once aggregates were single cells, they were immersed in STAIN solution (10% FBS and 90% DMEM/F12) and counted. The collagen master mix was prepared by combining the following: 10× M199 (Gibco), Glutamax (Gibco), Collagen 1 (3.66 mg/mL) (BD Biosciences), glucose (0.3 g/mL) (Gibco), NaOH (Sigma), NaHCO3 (0.075 g/mL) (Sigma), Hepes (Gibco), GFR Matrigel (BD Biosciences), and ddH20 at appropriate ratios for the desired collagen concentrations. The collagen master mix was constantly kept on ice under 4 °C to prevent premature cross-linking. Finally, 500 μL of master mix was pipetted into each well (of a 24-well plate) and centrifuged at high speed (300 × g) to eliminate bubbles. The centrifuge was maintained at an ice-cold temperature. The cell-laden collagen (an additional 250 μL per well) was prepared and pipetted/mixed into each well to a final cell density of 500,000 cells per well (the final volume in each well was 750 μL). The entire plate was centrifuged (200 × g) to force the cells into microwell recessions. Excess cell-laden collagen in each well was carefully and slowly aspirated to leave pockets of cell-laden collagen in each microwell. The entire plate was placed in a normoxic incubator for 15 min. After 15 min, 1 mL of cell-culture media was added slowly so as not to disrupt the polymerized collagen microtissues. Media were exchanged every 4 d. Microtissues remodel between 1 and 3 d depending on input-cell composition. Imaging of microtissues was done in situ. Samples were fixed, permeabilized, and stained inside the microwells and imaged using a fluorescence microscope.
Electrical Stimulation and Functional Analysis.
For electrical point stimulation, microwells were embedded with 0.005-inch–diameter platinum wires (99.99% purity; A-M Systems) and hooked up to a commercial stimulator (Grass S88X; Astro-Med). After 72 h of cultivation without electrical stimulation, the microtissues to be stimulated were stimulated with biphasic, square pulses 1 ms in duration, with a threshold amplitude of 6 V (field strength of 6 V/cm) and a frequency of 1 Hz for the remainder of cultivation (4 d). The stimulation voltage was selected to induce synchronous construct contractions. Constructs were held in place within the PDMS substrate.
Tissue function was established by measuring excitation threshold (ET), the minimum voltage required to pace the tissue simultaneously, and maximum capture rate (MCR), the maximum stimulation rate at which the construct can be induced to beat simultaneously, at 7 d after cell seeding. Tissue constructs or CM aggregates were individually placed between a pair of carbon electrodes in stimulation chambers (autoclaved before use). ET (V/cm) was measured by stimulating the tissue with square pulses of 2-ms pulse width at a frequency of 1 or 2 Hz and gradually increasing the output voltage of the stimulator until >80% of the tissue was beating synchronously with the stimulator output. MCR was measured by setting the output voltage at 12 V and increasing frequency until >80% of the tissue was no longer synchronously beating with the driving signal. All measurements were taken using an Olympus 1X2-UCB inverted fluorescence microscope housed in an environmental chamber (Solent Scientific) maintained at a temperature of 37 °C and equipped with a Retiga camera (QImaging).
Flow Cytometry and Cell Sorting.
For flow cytometric analysis, aggregates were dissociated using collagenase treatment and trypsin and immediately fixed with 4% paraformaldehyde (PFA) overnight at 4 °C. They were then permeabilized at room temperature with 100% methanol for 2 min. Primary antibody was added after a 2% HF wash. It was then incubated at room temperature for 20 min. Next, the sample was washed with HF and the secondary antibody was added for another 20 min at room temperature. Last, the sample was washed again to be ready for flow cytometric analysis. The samples were always kept on ice before measurement by flow cytometer.
For flow cytometric cell sorting, EBs were dissociated as previously described (45). Cells were stained with anti-CD90 allophycocyanin (BD Pharmingen; 1:500). Stainings were carried out in PBS with 10% FCS on ice. The cells were sorted using a FACSAria TMII (BD Biosciences) cell sorter (SickKids-University Health Network Flow Cytometry Facility). Data were analyzed using FlowJo software (Tree Star).
Immunostaining and Image Analysis.
Microtissues were washed with PBS and fixed for 24 h with 4% PFA at 4 °C. They were then permeabilized in 0.1% Triton X in blocking solution (normal donkey serum). Primary antibody was then added for 3 d at 4 °C. Last, the microtissues were washed three times and stained with the appropriate secondary antibody (Alexa Fluor series) and with DAPI for nuclear staining overnight at 4 °C. Each incubation step was preferably performed on a rocker table. Before imaging, the sample was washed three times and resuspended in 2% HF. Samples were imaged using confocal microscopy (FV1000 laser scanning confocal microscope; Olympus). All image analysis was done using custom macros built in ImageJ (National Institutes of Health) (cell alignment and elongation analysis, and total cell-marker expression enumeration).
Quantitative Real-Time PCR.
Total RNA was prepared with the RNAqueous-Micro Kit (Ambion) and treated with RNase-free DNase (Ambion). RNA (500 ng–1 pg) was reverse-transcribed into cDNA using random hexamers and Oligo(dT)s with SuperScript III Reverse Transcriptase (Invitrogen). Quantitative PCR was performed on a MasterCycler EP RealPlex (Eppendorf) using the QuantiFast SYBR Green PCR Kit (Qiagen). Expression levels were normalized to the housekeeping gene TATA box binding protein (TBP). The oligonucleotide sequences can be found in SI Appendix.
Optical Mapping.
For optical measurements, microtissues were stained with 5 mM voltage sensitive dye di-4-ANEPPS (Invitrogen) voltage-sensitive dye for 20 min, followed by three washouts with fresh warm Tyrode’s solution (Sigma-Aldrich) adjusted to pH 7.4. The temperature was kept constant at 37 °C using a block incubator. Dye fluorescence was recorded using a microscope mapping system (Ultima; SciMedia). The system included a CMOS camera with a 1-cm sensor (100 × 100 pixels) attached to a custom-built microscope using a Plan Apo objective and condensing lenses (Leica Microsystems), giving a magnification of 1.5×. The spatial resolution was 63 μm per pixel. The fluorescence was excited using a xenon light source (Moritek) and a 530-nm green filter (Semrock), and the emission signal was long pass-filtered using a 610-nm red filter. Tissue constructs were point-stimulated at a 1,000-ms cycle length using a bipolar electrode made with two fine silver wires ((American Wire Gauge 32; A-M Systems Inc.) 32) inserted into a large stainless steel needle mounted on a micromanipulator. Spontaneous tissue beating was also recorded, in addition to responses to frequency sweep from 1 to 5 Hz. Local activation times were measured at the peak of dF/dT (first derivative of fluorescence) for each pixel. Activation maps were constructed for a selected beat. Conduction velocity was calculated at each location using activation times of nine neighboring sites. Conduction velocity values from all sites were used to calculate the average conduction velocity across the construct surface; minimum and maximum values were also noted. Phase-contrast images of microtissue surfaces were taken before optical mapping to correlate tissue architecture geometry with conduction velocity.
Statistical Analysis and Data Representation.
Statistical significance was computed using the Mann–Whitney U test. All error bars represent the SEM of three or more biological replicates. Asterisks indicate statistical significance between conditions of P < 0.05. All data analyses, including graphical representations, were performed using Excel (Microsoft); statistical analysis was performed using custom macros written in R programming language (R Development).
Supplementary Material
Acknowledgments
We thank Ting Yin, Patrick Lai, Marjan Kusha, Joshua Lopes, Samuel McEwen, and Christopher Yip for technical assistance, and Geoff Clarke for critical reading of this manuscript. We acknowledge the following funding sources: Ontario Research Fund - Great Lakes 2 Grant (to M.R. and P.W.Z.), Heart & Stroke Foundation of Ontario Grant (to P.W.Z.), and Silver Creek Pharmaceuticals. P.W.Z. is the Canada Research Chair in Stem Cell Bioengineering. M.R. is the Canada Research Chair in Functional Cardiovascular Tissue Engineering. J.P.M. acknowledges support from Science Foundation Ireland and the Science Foundation Ireland/Higher Education Authority Irish Centre for High-End Computing. N.T. receives funding from a Heart and Stroke Foundation of Canada/Canadian Institutes of Health Research Doctoral Research Award and from a Natural Sciences and Engineering Research Council Microfluidic Applications and Training in Cardiovascular Health Scholarship.
Footnotes
The authors declare no conflict of interest.
This article contains supporting information online at www.pnas.org/lookup/suppl/doi:10.1073/pnas.1311120110/-/DCSupplemental.
References
- 1.Elliott DA, et al. NKX2-5(eGFP/w) hESCs for isolation of human cardiac progenitors and cardiomyocytes. Nat Methods. 2011;8(12):1037–1040. doi: 10.1038/nmeth.1740. [DOI] [PubMed] [Google Scholar]
- 2.Burridge PW, Keller G, Gold JD, Wu JC. Production of de novo cardiomyocytes: Human pluripotent stem cell differentiation and direct reprogramming. Cell Stem Cell. 2012;10(1):16–28. doi: 10.1016/j.stem.2011.12.013. [DOI] [PMC free article] [PubMed] [Google Scholar]
- 3.Zhang J, et al. Extracellular matrix promotes highly efficient cardiac differentiation of human pluripotent stem cells: The matrix sandwich method. Circ Res. 2012;111(9):1125–1136. doi: 10.1161/CIRCRESAHA.112.273144. [DOI] [PMC free article] [PubMed] [Google Scholar]
- 4.Xu C, et al. Efficient generation and cryopreservation of cardiomyocytes derived from human embryonic stem cells. Regen Med. 2011;6(1):53–66. doi: 10.2217/rme.10.91. [DOI] [PMC free article] [PubMed] [Google Scholar]
- 5.Zhu W-Z, Van Biber B, Laflamme MA. Methods for the derivation and use of cardiomyocytes from human pluripotent stem cells. Methods Mol Biol. 2011;767:419–431. doi: 10.1007/978-1-61779-201-4_31. [DOI] [PMC free article] [PubMed] [Google Scholar]
- 6.Lian X, et al. Robust cardiomyocyte differentiation from human pluripotent stem cells via temporal modulation of canonical Wnt signaling. Proc Natl Acad Sci USA. 2012;109(27):E1848–E1857. doi: 10.1073/pnas.1200250109. [DOI] [PMC free article] [PubMed] [Google Scholar]
- 7.Kattman SJ, et al. Stage-specific optimization of activin/nodal and BMP signaling promotes cardiac differentiation of mouse and human pluripotent stem cell lines. Cell Stem Cell. 2011;8(2):228–240. doi: 10.1016/j.stem.2010.12.008. [DOI] [PubMed] [Google Scholar]
- 8.Uosaki H, et al. Efficient and scalable purification of cardiomyocytes from human embryonic and induced pluripotent stem cells by VCAM1 surface expression. PLoS One. 2011;6(8):e23657. doi: 10.1371/journal.pone.0023657. [DOI] [PMC free article] [PubMed] [Google Scholar]
- 9.Dubois NC, et al. SIRPA is a specific cell-surface marker for isolating cardiomyocytes derived from human pluripotent stem cells. Nat Biotechnol. 2011;29(11):1011–1018. doi: 10.1038/nbt.2005. [DOI] [PMC free article] [PubMed] [Google Scholar]
- 10.Dengler J, et al. Engineered heart tissue enables study of residual undifferentiated embryonic stem cell activity in a cardiac environment. Biotechnol Bioeng. 2011;108(3):704–719. doi: 10.1002/bit.22987. [DOI] [PubMed] [Google Scholar]
- 11.Boudou T, et al. A microfabricated platform to measure and manipulate the mechanics of engineered cardiac microtissues. Tissue Eng Part A. 2012;18(9-10):910–919. doi: 10.1089/ten.tea.2011.0341. [DOI] [PMC free article] [PubMed] [Google Scholar]
- 12.Schaaf S, et al. Human engineered heart tissue as a versatile tool in basic research and preclinical toxicology. PLoS One. 2011;6(10):e26397. doi: 10.1371/journal.pone.0026397. [DOI] [PMC free article] [PubMed] [Google Scholar]
- 13.Kean TJ, et al. Development of a peptide-targeted, myocardial ischemia-homing, mesenchymal stem cell. J Drug Target. 2012;20(1):23–32. doi: 10.3109/1061186X.2011.622398. [DOI] [PMC free article] [PubMed] [Google Scholar]
- 14.Iyer RK, Odedra D, Chiu LL, Vunjak-Novakovic G, Radisic M. Vascular endothelial growth factor secretion by nonmyocytes modulates Connexin-43 levels in cardiac organoids. Tissue Eng Part A. 2012;18(17-18):1771–1783. doi: 10.1089/ten.tea.2011.0468. [DOI] [PMC free article] [PubMed] [Google Scholar]
- 15.Panáková D, Werdich AA, Macrae CA. Wnt11 patterns a myocardial electrical gradient through regulation of the L-type Ca(2+) channel. Nature. 2010;466(7308):874–878. doi: 10.1038/nature09249. [DOI] [PMC free article] [PubMed] [Google Scholar]
- 16.Kurazumi H, et al. The effects of mechanical stress on the growth, differentiation, and paracrine factor production of cardiac stem cells. PLoS One. 2011;6(12):e28890. doi: 10.1371/journal.pone.0028890. [DOI] [PMC free article] [PubMed] [Google Scholar]
- 17.Thavandiran N, Nunes SS, Xiao Y, Radisic M. Topological and electrical control of cardiac differentiation and assembly. Stem Cell Res Ther. 2013;4(1):14. doi: 10.1186/scrt162. [DOI] [PMC free article] [PubMed] [Google Scholar]
- 18.Kim D-H, et al. Nanoscale cues regulate the structure and function of macroscopic cardiac tissue constructs. Proc Natl Acad Sci USA. 2010;107(2):565–570. doi: 10.1073/pnas.0906504107. [DOI] [PMC free article] [PubMed] [Google Scholar]
- 19.Feng Y, Yu X-Y, Wang Y. Recent concepts for the roles of progenitor/stem cell niche in heart repair. Am J Cardiovasc Dis. 2012;2(1):75–83. [PMC free article] [PubMed] [Google Scholar]
- 20.Gupta MK, et al. Combinatorial polymer electrospun matrices promote physiologically-relevant cardiomyogenic stem cell differentiation. PLoS One. 2011;6(12):e28935. doi: 10.1371/journal.pone.0028935. [DOI] [PMC free article] [PubMed] [Google Scholar]
- 21.Sassoli C, et al. Mesenchymal stromal cells affect cardiomyocyte growth through juxtacrine Notch-1/Jagged-1 signaling and paracrine mechanisms: Clues for cardiac regeneration. J Mol Cell Cardiol. 2011;51(3):399–408. doi: 10.1016/j.yjmcc.2011.06.004. [DOI] [PubMed] [Google Scholar]
- 22.Hansen A, et al. Development of a drug screening platform based on engineered heart tissue. Circ Res. 2010;107(1):35–44. doi: 10.1161/CIRCRESAHA.109.211458. [DOI] [PubMed] [Google Scholar]
- 23.Vandenburgh H, et al. Automated drug screening with contractile muscle tissue engineered from dystrophic myoblasts. FASEB J. 2009;23(10):3325–3334. doi: 10.1096/fj.09-134411. [DOI] [PMC free article] [PubMed] [Google Scholar]
- 24.Grosberg A, Alford PW, McCain ML, Parker KK. Ensembles of engineered cardiac tissues for physiological and pharmacological study: Heart on a chip. Lab Chip. 2011;11(24):4165–4173. doi: 10.1039/c1lc20557a. [DOI] [PMC free article] [PubMed] [Google Scholar]
- 25.Song H, et al. Interrogating functional integration between injected pluripotent stem cell-derived cells and surrogate cardiac tissue. Proc Natl Acad Sci USA. 2010;107(8):3329–3334. doi: 10.1073/pnas.0905729106. [DOI] [PMC free article] [PubMed] [Google Scholar]
- 26.Kraushaar U, et al. Cardiac safety pharmacology: From human ether-a-gogo related gene channel block towards induced pluripotent stem cell based disease models. Expert Opin Drug Saf. 2012;11(2):285–298. doi: 10.1517/14740338.2012.639358. [DOI] [PubMed] [Google Scholar]
- 27.Braam SR, et al. Prediction of drug-induced cardiotoxicity using human embryonic stem cell-derived cardiomyocytes. Stem Cell Res (Amst) 2010;4(2):107–116. doi: 10.1016/j.scr.2009.11.004. [DOI] [PubMed] [Google Scholar]
- 28.Radisic M, et al. Functional assembly of engineered myocardium by electrical stimulation of cardiac myocytes cultured on scaffolds. Proc Natl Acad Sci USA. 2004;101(52):18129–18134. doi: 10.1073/pnas.0407817101. [DOI] [PMC free article] [PubMed] [Google Scholar]
- 29.Deshpande VS, McMeeking RM, Evans AG. A bio-chemo-mechanical model for cell contractility. Proc Natl Acad Sci USA. 2006;103(38):14015–14020. doi: 10.1073/pnas.0605837103. [DOI] [PMC free article] [PubMed] [Google Scholar]
- 30.Pathak A, Deshpande VS, McMeeking RM, Evans AG. The simulation of stress fibre and focal adhesion development in cells on patterned substrates. J R Soc Interface. 2008;5(22):507–524. doi: 10.1098/rsif.2007.1182. [DOI] [PMC free article] [PubMed] [Google Scholar]
- 31.McGarry JP, et al. Simulation of the contractile response of cells on an array of micro-posts. Philos Trans A Math Phys Eng Sci. 2009;367(1902):3477–3497. doi: 10.1098/rsta.2009.0097. [DOI] [PMC free article] [PubMed] [Google Scholar]
- 32.Deshpande VS, McMeeking RM, Evans AG. A model for the contractility of the cytoskeleton including the effects of stress-fibre formation and dissociation. Proc R Soc A. 2007;463(2079):787–815. [Google Scholar]
- 33.Legant WR, et al. Microfabricated tissue gauges to measure and manipulate forces from 3D microtissues. Proc Natl Acad Sci USA. 2009;106(25):10097–10102. doi: 10.1073/pnas.0900174106. [DOI] [PMC free article] [PubMed] [Google Scholar]
- 34.Dowling EP, et al. The effect of remodelling and contractility of the actin cytoskeleton on the shear resistance of single cells: A computational and experimental investigation. J R Soc Interface. 2012;9(77):3469–3479. doi: 10.1098/rsif.2012.0428. [DOI] [PMC free article] [PubMed] [Google Scholar]
- 35.Dowling EP, Ronan W, McGarry JP. Computational investigation of in situ chondrocyte deformation and actin cytoskeleton remodelling under physiological loading. Acta Biomater. 2013;9(4):5943–5955. doi: 10.1016/j.actbio.2012.12.021. [DOI] [PubMed] [Google Scholar]
- 36.Ronan W, Deshpande VS, McMeeking RM, McGarry JP. Numerical investigation of the active role of the actin cytoskeleton in the compression resistance of cells. J Mech Behav Biomed Mater. 2012;14:143–157. doi: 10.1016/j.jmbbm.2012.05.016. [DOI] [PubMed] [Google Scholar]
- 37.Porter KE, Turner NA. Cardiac fibroblasts: At the heart of myocardial remodeling. Pharmacol Ther. 2009;123(2):255–278. doi: 10.1016/j.pharmthera.2009.05.002. [DOI] [PubMed] [Google Scholar]
- 38.Durrer D, et al. Total excitation of the isolated human heart. Circulation. 1970;41(6):899–912. doi: 10.1161/01.cir.41.6.899. [DOI] [PubMed] [Google Scholar]
- 39.Nanthakumar K, et al. Optical mapping of Langendorff-perfused human hearts: Establishing a model for the study of ventricular fibrillation in humans. Am J Physiol Heart Circ Physiol. 2007;293(1):H875–H880. doi: 10.1152/ajpheart.01415.2006. [DOI] [PubMed] [Google Scholar]
- 40.Cameron VA, Ellmers LJ. Minireview: Natriuretic peptides during development of the fetal heart and circulation. Endocrinology. 2003;144(6):2191–2194. doi: 10.1210/en.2003-0127. [DOI] [PubMed] [Google Scholar]
- 41.Uosaki H, et al. Direct contact with endoderm-like cells efficiently induces cardiac progenitors from mouse and human pluripotent stem cells. PLoS One. 2012;7(10):e46413. doi: 10.1371/journal.pone.0046413. [DOI] [PMC free article] [PubMed] [Google Scholar]
- 42.Ma Z, et al. Mesenchymal stem cell-cardiomyocyte interactions under defined contact modes on laser-patterned biochips. PLoS One. 2013;8(2):e56554. doi: 10.1371/journal.pone.0056554. [DOI] [PMC free article] [PubMed] [Google Scholar]
- 43.McSpadden LC, Nguyen H, Bursac N. Size and ionic currents of unexcitable cells coupled to cardiomyocytes distinctly modulate cardiac action potential shape and pacemaking activity in micropatterned cell pairs. Circ Arrhythm Electrophysiol. 2012;5(4):821–830. doi: 10.1161/CIRCEP.111.969329. [DOI] [PMC free article] [PubMed] [Google Scholar]
- 44.Bauwens CL, et al. Geometric control of cardiomyogenic induction in human pluripotent stem cells. Tissue Eng Part A. 2011;17(15-16):1901–1909. doi: 10.1089/ten.TEA.2010.0563. [DOI] [PubMed] [Google Scholar]
- 45.Sharma P, Shathasivam T, Ignatchenko V, Kislinger T, Gramolini AO. Identification of an FHL1 protein complex containing ACTN1, ACTN4, and PDLIM1 using affinity purifications and MS-based protein-protein interaction analysis. Mol Biosyst. 2011;7(4):1185–1196. doi: 10.1039/c0mb00235f. [DOI] [PMC free article] [PubMed] [Google Scholar]
Associated Data
This section collects any data citations, data availability statements, or supplementary materials included in this article.