

Abstract
Background
Reflux following intravitreal injection is a common phenomenon, but it is unknown how much, if any, medication is lost as a result. Reflux is known to be a combination of vitreous and the injected agent, but the relative composition is unknown. This paper describes a novel method for the measurement of the volume and composition of reflux and presents data from porcine eyes.
Methods
Twenty porcine eyes were injected with 0.05 ml of dye at intraocular pressures (IOPs) of 15, 20, 25 and 30 mmHg (5 eyes per subgroup). Reflux was captured on filter paper and the area of saturation and color intensity of the dye were digitally analyzed. Total refluxed volume and proportion of dye vs. vitreous fluid were calculated from linear regression lines created from known standards.
Results
Average (median) total volume of reflux from all eyes was 1.19 μL (0.93 μL), volume of injected dye refluxed was 0.47 μL (0.11 μL), and composition of reflux was 20.8% dye (15.5%). Less than 1% of the injected dye was lost to reflux. There were no differences between IOP groups in the total volume refluxed, the total amount of dye refluxed, the average composition of the reflux, or the amount of injected dye refluxed (df=3 for all comparisons; p=0.58, p=0.51, p=0.55, p=0.51, respectively).
Conclusions
This novel method allows for measurement of quantity and composition of reflux following intravitreal injection in vitro. While reflux occurs frequently, it is predominantly composed of vitreous, not the injected agent. In fact, less than one percent of the original injection was lost to reflux.
Keywords: reflux, intravitreal injection
INTRODUCTION
Since the advent of anti-vascular endothelial growth factor (VEGF) agents, intravitreal injections have become standard of care in the treatment of a variety of retinal diseases. Reflux and conjunctival bleb formation is frequently noted at the injection site.1 Physicians are concerned with the amount of drug lost via reflux and the possible effects this drug loss has on therapeutic efficacy.
Previous studies have evaluated what factors influence the amount of reflux from intravitreal injection in animal models2 and humans.3–5 Other authors have attempted to quantify the amount and composition of reflux using dye as well as radiolabeling techniques.6–8 These studies indicated that there is some degree of reflux of the injected material. However, none of the studies were able to quantify how much of the injected material was lost to reflux or how much of the reflux was vitreous. In our study, we present a novel method using digital image analysis for quantifying the volume and composition of refluxed fluid after intravitreal injection in an in vitro model using porcine eyes.
MATERIALS AND METHODS
Creation of Standard Lines for Determining Volume and Composition of Reflux
We quantified the volume of reflux by determining how much area the fluid subtended when absorbed by a Schirmer’s test strip (test strip; Tianjin Jingming New Technological Development Company, China). In order to do this for unknown volumes of reflux, we first created a standard line using known quantities of volume on test strips to determine if a relationship existed between volume of fluid and area of fluid saturation on the test strip.
Dye (1 part hematoxylin stain mixed, 5 parts balanced salt solution (BSS)) was used in order to make it easier to identify the area that was saturated on the test strip. The following volumes of dye were applied to a test strips: 1, 2.5, 5, 10, 15, 20 μL. Each volume was tested three times. Three undyed strips were also used as “0” points for a total of 21 test strips. The test strips were then immediately scanned using a Canon LIDE 210 desktop scanner (Canon USA, Melville, NY) with 1,200-dot per inch resolution to create digital image files.
Digital image analysis was performed using ImageJ software, a free image analysis software package produced by the National Institute of Health (http://imagej.nih.gov/ij). The saturated area of the test strip was selected as the region of interest (ROI). The area of the ROI was measured in pixels. These areas subtended were plotted against their respective volumes (Figure 2). A linear regression line was calculated to determine the relationship between volume of fluid on the test strip and the corresponding area of saturation.
Figure 2.
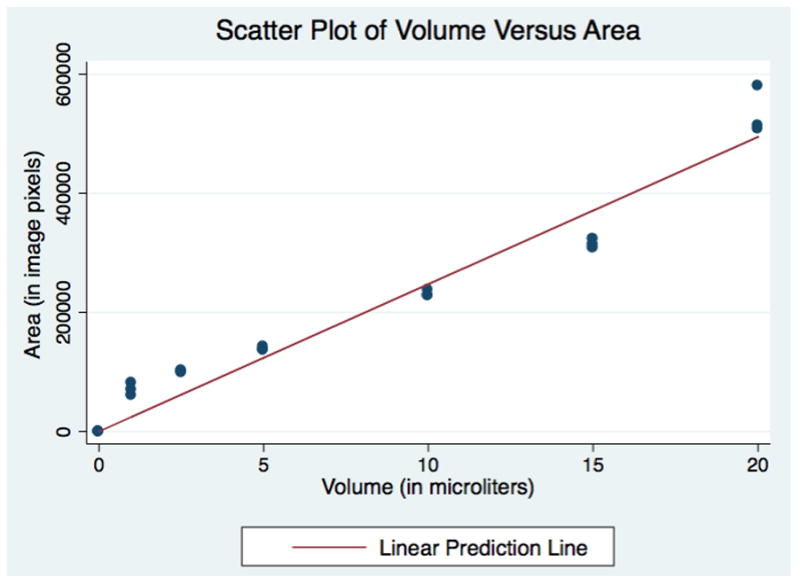
Pipetted Volumes of Dye on Schirmer Strips versus Total Area of Saturation
Next, we determined if the amount of dye within a solution could be reliably measured. We pipetted out the dye in volumes 5, 10 and 15 μL onto test strips. Each volume was repeated three times. This process was then repeated with serial dilutions in 10% increments. We then calculated the actual amount of dye on each test strip by multiplying the concentration by volume (eg. 10 μL of 50% dilute dye was 5 μL of dye volume). Strips were scanned in the same fashion as previously described. Using ImageJ, the images were converted to 32-bit gray scale images. Next, the image was processed by inverting the color scheme thereby making previously dark (dyed) portions brighter (higher values of pixel intensity), while light (undyed) portions were darker (lower values of pixel intensity). The total pixel intensity was measured in the ROI (Figure 1). In this first measurement however, the test strip itself also contributed to the measured pixel intensity. To account for this, the average intensity of undyed portion of the strip was multiplied by the area of the dyed portion and then subtracted from the original gross intensity measurement of the ROI. The result was a background-adjusted intensity value that corresponded to the contribution of the dye only. This technique is similar to previous studies that corrected for background fluorescence when quantifying microscopy images.9–11
Figure 1.

Example of Schirmer test strip showing dyed versus undyed areas.
We then plotted the pixel intensity against the calculated volume of dye in each solution (Figure 3). A linear regression line was calculated to determine the relationship between amount of dye in solution and the corresponding background-adjusted pixel intensity.
Figure 3.
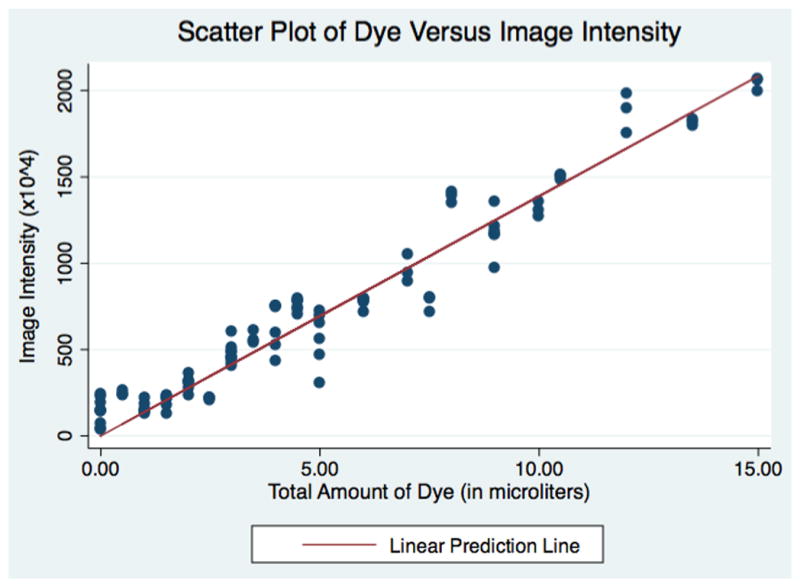
Pipetted Volumes of Dye on Schirmer Strips versus Adjusted Image Intensity
STATA® 12 (College Station, Texas) software was used for all statistical analyses.
Porcine Eye Preparation
Injection reflux and vitreous leakage were measured after intravitreal injection of twenty porcine eyes. The eyes were kept in moist media and refrigerated promptly after the animal was sacrificed but were allowed to equilibrate to room temperature for 4 – 6 hours prior to injection (12 to 84 hours after death). Two quadrants, 180 degrees apart, were identified for dissection. Conjunctiva and Tenon’s capsule were removed to reveal bare sclera in each quadrant.
A 23-gauge trocar-mounted microcannula (Alcon Surgical, Fort Worth, TX) was inserted 4mm posterior to the limbus was placed with a single-step technique. The cannula was attached to a hanging bottle of BSS and adjusting the height of the bottle controlled the intraocular pressure.
Eyes were randomly assigned to four subgroups (5 eyes each) of intraocular pressures of 15, 20, 25 and 30 mmHg corresponding to bottle heights of 20.5 cm, 27.2 cm, 34 cm and 40.8 cm above the eye, respectively (conversion factor 1mmHg = 1.36 cm H20). The intraocular pressure of the eye was allowed to equilibrate over 2 minutes, after which the infusion line was clamped near the insertion of the microcannula.
Injection technique
All eyes were injected with 100% concentration of the prepared dye (1:5 mixture of hematoxylin and BSS) at varying intraocular pressures (IOP). The intravitreal injection was prepared by withdrawing 0.3 mL of the dye into a 1 mL tuberculin syringe. A 30-gauge needle, marked 5 mm from the tip with adhesive tape to standardize injection depth, was attached to the tuberculin syringe. All needles used were 12.7mm in length. The needle and syringe were primed with the dye mixture, leaving a volume of greater than 0.05 ml for intravitreal injection. No dye was left on the exterior of the needle at the time of injection.
The sclera was dried in the quadrant prepared for injection (180 degrees from the infusion cannula) using a Weck-Cel sponge. A caliper was used to mark the sclera 4mm posterior to the limbus. Pars plana intravitreal injection was performed using standard injection technique with a non-beveled trajectory. The needle was inserted through the sclera at a 90° angle to a depth of 5mm corresponding to the adhesive tape on the needle. The plunger was depressed to a volume reduction of 0.05 ml, causing 0.05 ml of dye to be injected into the eye (differential reduction method of injection). The injection took two seconds and the needle was withdrawn one second after the syringe plunger was fully depressed.
Reflux measurement and Calculation
Upon removal of the needle, a test strip was immediately placed on bare sclera on top of the site of the intravitreal injection. Refluxed fluid was collected on the test strip, which was held in place for 30 seconds without applying pressure to the globe. The test strip was then scanned and total area of liquid saturation on the test strip (not simply how far the dye traveled) was measured. Also, background-adjusted color intensity was measured as described above. The total volume of reflux was calculated using the linear regression line based on the digital pixel area. Similarly, the amount of dye in the refluxed fluid was calculated using the background-adjusted linear regression line described above. The Kruskal-Wallis rank test was used to compare the total volume of refluxed fluid and the amount of dye in the refluxed fluid between different IOP groups (p<0.05 was considered significant).
RESULTS
The saturated area (in pixels) on test strips corresponding to various known volumes of dye is shown in Figure 2. A linear regression line was found by the equation: Area (in pixels) = 24736*Volume (in μL). The linear regression model had a R2= 0.98 and the coefficient for volume had a p-value of <0.001.
The background-adjusted image intensity corresponding to various known amounts of dye at varying concentrations is shown in Figure 3. A linear regression line was found by the equation: Image Intensity = 1389113*Amount of Dye (in μL). The linear regression had a R2=0.98 and the coefficient for amount of dye had a p-value of <0.001.
Twenty porcine eyes were injected with 50 μL of mixed dye in order to test the feasibility of using our method for measuring reflux from intravitreal injection (Table 1). The average calculated total volume of refluxed fluid was 1.19 μL (SD: 1.25 μL; median: 0.93 μL), with a range of 0 μL to 5.57 μL. The average calculated volume of refluxed dye was 0. μL (SD: 1.05 μl; median: 0.11 μL), with a range of 0 μL to 4.71 μL. The average composition of the reflux was 20.8% dye (SD: 20.3%; median 15.5%), with a range of 0% to 84.6%. The average dye lost to reflux from the 50 μL injection was 0.95% (SD: 2.11%; median: 0.23%), with a range from 0% to 9.42%.
Table 1.
Results from 20 porcine eyes injected with 50 μL of dye at various intraocular pressures (IOP).
| Eye # | IOP (mmHg) | Total Volume of Reflux (μL) | Volume of Refluxed Dye (μL) | Proportion of Dye from Total Refluxed Fluid (%) | Proportion of Refluxed Dye from Total Dye Injected (%) |
|---|---|---|---|---|---|
| 1 | 15 | 0.35 | 0.06 | 16.01% | 0.11% |
| 2 | 15 | 0.00 | 0.00 | 0.00% | 0.00% |
| 3 | 15 | 2.38 | 1.05 | 44.21% | 2.10% |
| 4 | 15 | 1.76 | 0.44 | 24.77% | 0.87% |
| 5 | 15 | 0.00 | 0.00 | 0.00% | 0.00% |
| 6 | 20 | 0.00 | 0.00 | 0.00% | 0.00% |
| 7 | 20 | 5.57 | 4.71 | 84.55% | 9.42% |
| 8 | 20 | 0.72 | 0.09 | 11.93% | 0.17% |
| 9 | 20 | 1.07 | 0.19 | 17.80% | 0.38% |
| 10 | 20 | 0.41 | 0.07 | 17.98% | 0.15% |
| 11 | 25 | 1.12 | 0.19 | 17.19% | 0.39% |
| 12 | 25 | 2.49 | 1.30 | 52.04% | 2.59% |
| 13 | 25 | 0.78 | 0.11 | 14.45% | 0.23% |
| 14 | 25 | 1.48 | 0.28 | 18.68% | 0.55% |
| 15 | 25 | 0.76 | 0.12 | 15.08% | 0.23% |
| 16 | 30 | 1.08 | 0.11 | 10.48% | 0.23% |
| 17 | 30 | 1.30 | 0.51 | 38.98% | 1.02% |
| 18 | 30 | 1.37 | 0.15 | 11.19% | 0.31% |
| 19 | 30 | 0.59 | 0.06 | 10.06% | 0.12% |
| 20 | 30 | 0.58 | 0.06 | 10.81% | 0.13% |
To determine the effects of IOP on the amount and composition four subgroups of eyes at varying IOPs were tested. The mean (and median) volume of reflux was 0.90 μL (0.35 μL), 1.55 μL (0.72 μL), 1.33 μL (1.12 μL) and 0.98 μL (1.08 μL) in IOP groups of 15, 20, 25 and 30mmHg, respectively (Table 1). The mean (and median) total volume of dye lost was 0.31 μL (0.06 μL), 1.01 μL (0.09 μL), 0.40 μL (0.19 μL) and 0.18 μL (0.11 μL) in the IOP groups of 15, 20, 25 and 30mmHg, respectively. The mean (median) proportion of dye in the total refluxed fluid was 17.0% (16.0%), 26.45% (17.80%), 23.49% (17.19%) and 16.30% (10.81%) in the IOP groups. The mean (median) proportion or refluxed dye compared to original injected volume of dye was 0.62% (0.11%), 2.02% (0.17%), 0.80% (0.39%) and 036% (0.23%) for the IOP groups 15, 20, 25 and 30 mmHg, respectively.
Using the Kruskal-Wallis rank test for all comparisons, there were no differences between IOP groups in the total volume of refluxed fluid, the volume of refluxed dye, the average proportion of dye in the reflux fluid, or the volume of refluxed dye compared to original injected volume (df=3 for all comparisons; p=0.58, p=0.51, p=0.55, p=0.51, respectively).
DISCUSSION
Intravitreal injection of therapeutic agents has become a common office procedure in ophthalmology. These agents are typically delivered in very small volumes, often only 50 to 100 μL. Given these small injected volumes, there is some concern that even minimal visible reflux from the injection site after withdrawal of the needle may represent significant loss of the active pharmacologic agent.
Previous studies have examined a variety of techniques to evaluate and minimize the subconjunctival bleb that often results from refluxed fluid, but have been unable to quantify how much actual medication is lost.1–8 Hubschman et al. (2010) were the first investigators to attempt to quantify the volume of the reflux using a standard comparison.7 In their study, 150 porcine eyes were injected with 50 μL of dye and the diameter of the resultant refluxed dye on the sclera was measured (the conjunctiva was taken down). These measurements were compared to the diameter of known volumes of dye pipetted onto porcine eyes. The authors found that needle gauge and injection depth both affect the amount of refluxed fluid. However, they were not able to quantify the composition of the reflux – whether it was refluxed from the injection or vitreous fluid.
In an attempt to answer this question, Christoforidis et al. (2013) injected 29 rabbit eyes with radiolabeled anti-VEGF agents.8 The rabbits subsequently underwent PET-CT to visualize the composition of the bleb. The authors concluded that bleb contained drug based on its appearance in the PET-CT images. However, similar to the study by Hubschman et al. (2010), they were unable to quantify the composition of the bleb, and thereby were unable to measure to proportion of injected medication versus vitreous fluid that had refluxed out of the eye.
Our study presents a novel method for measuring the volume and composition of reflux following intravitreal injection using digital imaging analysis. Consistent with prior studies on this topic7, our data shows that refluxed volumes range between 0 to 5.7 μL. However, the amount of injected dye that refluxed ranged from 0 to 4.71 μL. In our study, up to 9.42% (4.7 μL) of the initially injected 50 microliters of dye was lost through reflux, with an average loss of less than 1% (0.47 μL).
The overall composition of this reflux was, on average, 20.81% dye and 79.19% vitreous fluid. Intraocular pressure was not found to have an effect on either total volume refluxed or amount of dye refluxed, which was consistent with previous reports.12
There are potential limitations to our study. Identification of the boundaries of saturation on the test strip was done by visual inspection. The process of cleaning the needle tip prior to injection could have wicked a small amount of fluid out of the needle, thereby altering the volume of injection. Similarly, placing the test strip on the injection site could have wicked up additional dye from the needle tract that would not have otherwise been refluxed. Had this occurred, our data would be expected to overestimate the total volume and dye refluxed.
Background adjusted color intensity was used to calculate the amount of dye refluxed because it is not affected by the movement of dye across the filter paper or the relative dilution of the dye in solution – rather, it effectively measures the absolute amount of dye present as shown by the goodness of fit (R2 =0.98) between across many dilutions (Figure 3). However, in order to calculate the total volume of reflux, the area of saturation was measured. The movement of refluxed vitreous along the test strip could have been influenced proteins present in the vitreous and not accounted for in the creation of the standard line. Therefore, the presence of intravitreal proteins within the reflux may have reduced the distance fluid was able to travel on the test strip resulting in an underestimation of the total volume of reflux.
Previous studies have shown that the preparation and injection of small volumes is imprecise and delivered volumes vary from the target.15,16 Experimental injections on porcine eyes in this study were performed by clinicians using their normal clinical technique. The differential injection method used in our experiment has previously been found to be the most precise method for delivering the desired volume with a mean variation of less than 2%.15
This experimental model used porcine eyes because the thickness of sclera and the location of the pars plana are similar to that of humans.13,14 Porcine eyes have also been used in previous studies.7 However, we did not account for other anatomic variations between porcine and human eyes. For example, many patients receiving intravitreal injections are older and may have more syneretic vitreous than a younger population. We were unable to quantify how formed the vitreous was in these younger porcine eyes, and how this might affect the quantity or composition of the reflux from the intravitreal injection. Additionally, a limitation of the experimental data is the delay in time of death to experimental use. It is unknown how this affects factors such as scleral rigidity and permeability. Eyes were kept cool and moist until use in an effort to minimize these effects.
There have been many studies on how a variety of factors influence the amount reflux after intravitreal injection. However, these studies predominantly rely on diameter of the resultant bleb and are unable to quantify how much actual drug is lost to reflux. This study demonstrates a new method for quantifying the volume and composition of reflux following intravitreal injection. This method can be used by others in evaluating techniques (for example, altering the speed of an injection) to minimize reflux thereby allowing researchers to assess not only the volume, but also the composition of the refluxed material.
Data from our study suggests that although reflux following intravitreal injection occurs frequently, the reflux contains some of the injected material but is predominantly composed of vitreous. Further, the amount of the injected pharmacologic agent lost to reflux is limited and represents only a small fraction of the original injection volume. Future work will evaluate this model in cadaveric human eyes.
Summary Statement.
Measurement and analysis of reflux following intravitreal injection in 20 porcine eyes.
Acknowledgments
Supported by grants from: Hope for Vision and The Richard H. Chartrand Eye Research Foundation; National Institutes of Health K12 Award, K12-EY015398; Additional funding was provided by Research to Prevent Blindness and the Paul and Evanina Mackall Foundation, HHMI-NIBIB Biomedical Interface Program Training Grant.
The authors wish to acknowledge John Dempsey for his administrative and logistical help with this study.
Footnotes
Declaration of Interest: The authors report no conflicts of interest
References
- 1.Benz MS, Albini TA, Holz ER, Lakhanpal RR, Westfall AC, Iyer MN, et al. Short-term Course of Intraocular Pressure after Intravitreal Injection of Triamcinolone Acetonide. Ophthalmology. 2006;113(7):1174–8. doi: 10.1016/j.ophtha.2005.10.061. [DOI] [PubMed] [Google Scholar]
- 2.Cortez RT. Intravitreous Bevacizumab Injection: An Experimental Study in New Zealand White Rabbit. Arch Ophthalmol. 2010;128(7):884. doi: 10.1001/archophthalmol.2010.139. [DOI] [PubMed] [Google Scholar]
- 3.Rodrigues EB, Grumann A, Jr, Penha FM, Shiroma H, Rossi E, Meyer CH, et al. Effect of needle type and injection technique on pain level and vitreal reflux in intravitreal injection. J Ocul Pharmacol Ther Off J Assoc Ocul Pharmacol Ther. 2011;27(2):197–203. doi: 10.1089/jop.2010.0082. [DOI] [PubMed] [Google Scholar]
- 4.Turgut B. The Effects of Injection Site on the Reflux Following Intravitreal Injections. J Clin Med Res [Internet] 2009;1(5):280–284. doi: 10.4021/jocmr2009.12.1280. [DOI] [PMC free article] [PubMed] [Google Scholar]
- 5.Rodrigues EB, Meyer CH, Grumann A, Shiroma H, Aguni JS, Farah ME. Tunneled Scleral Incision to Prevent Vitreal Reflux After Intravitreal Injection. Am J Ophthalmol. 2007;143(6):1035–7. doi: 10.1016/j.ajo.2007.01.035. [DOI] [PubMed] [Google Scholar]
- 6.Boon CJF, Crama N, Klevering BJ, van Kuijk FJ, Hoyng CB. Reflux after Intravitreal Injection of Bevacizumab. Ophthalmology. 2008;115(7):1270. doi: 10.1016/j.ophtha.2008.02.021. [DOI] [PubMed] [Google Scholar]
- 7.Hubschman J-P, Coffee RE, Bourges J-L, Yu F, Schwartz SD. Experimental Model Of Intravitreal Injection Techniques. Retina. 2010;30(1):167–73. doi: 10.1097/IAE.0b013e3181b094cf. [DOI] [PubMed] [Google Scholar]
- 8.Christoforidis JB, Williams MM, Epitropoulos FM, Knopp MV. Subconjunctival bleb that forms at the injection site after intravitreal injection is drug, not vitreous: Letters to the Editor. Clin Experiment Ophthalmol. 2013;41(6):614–5. doi: 10.1111/ceo.12074. [DOI] [PubMed] [Google Scholar]
- 9.Burgess A, Vigneron S, Brioudes E, Labbe J-C, Lorca T, Castro A. From the Cover: Loss of human Greatwall results in G2 arrest and multiple mitotic defects due to deregulation of the cyclin B-Cdc2/PP2A balance. Proc Natl Acad Sci. 2010;107(28):12564–9. doi: 10.1073/pnas.0914191107. [DOI] [PMC free article] [PubMed] [Google Scholar]
- 10.Gavet O, Pines J. Progressive Activation of CyclinB1-Cdk1 Coordinates Entry to Mitosis. Dev Cell. 2010;18(4):533–43. doi: 10.1016/j.devcel.2010.02.013. [DOI] [PMC free article] [PubMed] [Google Scholar]
- 11.Potapova TA, Sivakumar S, Flynn JN, Li R, Gorbsky GJ. Mitotic progression becomes irreversible in prometaphase and collapses when Wee1 and Cdc25 are inhibited. Mol Biol Cell. 2011;22(8):1191–206. doi: 10.1091/mbc.E10-07-0599. [DOI] [PMC free article] [PubMed] [Google Scholar]
- 12.Kim K, Jee D. Effect of the Honan intraocular pressure reducer on intraocular pressure increase following intravitreal injection using the tunneled scleral technique. Jpn J Ophthalmol. 2011;55(6):632–7. doi: 10.1007/s10384-011-0088-1. [DOI] [PubMed] [Google Scholar]
- 13.Schubert HD. Noncontact and contact pars plana transscleral neodymium: YAG laser cyclophotocoagulation in postmortem eyes. Ophthalmology. 1989;96(10):1471–5. doi: 10.1016/s0161-6420(89)32702-3. [DOI] [PubMed] [Google Scholar]
- 14.Olsen TW, Sanderson S, Feng X, Hubbard WC. Porcine Sclera: Thickness and Surface Area. Invest Ophthalmol Vis Sci. 2002;43(8):2529–32. [PubMed] [Google Scholar]
- 15.Gerding H, Timmermann M. Accuracy and Precision of Intravitreally Injected Ranibizumab Doses: An Experimental Study. Klin Monatsblätter Für Augenheilkd. 2010;227(04):269–272. doi: 10.1055/s-0029-1245183. [DOI] [PubMed] [Google Scholar]
- 16.Raju JR, Weinberg DV. Accuracy and precision of intraocular injection volume. Am J Ophthalmol. 2002;133(4):564–566. doi: 10.1016/s0002-9394(01)01408-8. [DOI] [PubMed] [Google Scholar]