

Abstract
Background
Evidence-based literature has confirmed the effectiveness of radiation therapy (RT) after breast-conserving surgery (BCS), especially for young women. However, women with young children may be less likely to be compliant. This study explores factors associated with noncompliance of RT among insured young patients.
Method
Using the MarketScan Database, we identified the study cohort as women aged 20 to 64 years who had a BCS between January 1, 2004, and December 31, 2009, and had continuous enrollment 12 months before and after the date of BCS. Patients who had any radiation claims within a year of BCS were considered compliant. Adjusted odds of compliance were estimated from logistic regressions for the full sample and age-stratified subgroups. Sensitivity analyses were performed to evaluate the robustness of study findings. All statistical tests were two-sided.
Results
Eighteen thousand one hundred twenty of 21 008 (86.25%) nonmetastatic BCS patients received RT. Among patients aged 20 to 64 years, those with children aged 7 to 12 years, those with children aged 13 to 17 years, and those with no children or children aged 18 years or older were more likely to receive RT than patients with at least one child aged less than 7 years (7–12 years: odds ratio (OR) = 1.32, 95% confidence interval (CI) = 1.05 to 1.66, P = .02; 13–17 years: OR = 1.41, 95% CI = 1.13 to 1.75, P = .002; no children or ≥18 years: OR = 1.38, 95% CI = 1.13 to 1.68, P = .001). Stratified analyses showed that the above association was primarily driven by women in the youngest age group (aged 20–50). Other important factors included breast cancer quality of care measures, enrollment in health maintenance organizations or capitated preferred provider organizations, travelled to a Census division outside their residence for BCS, and whether patients were primary holders of the insurance policy.
Conclusions
Competing demands from child care can constitute a barrier to complete guideline-concordant breast cancer therapy. Younger patients may be confronted by unique challenges that warrant more attention in future research.
Clinical benefits of radiation therapy (RT) after breast-conserving surgery (BCS) for women with early-stage breast cancer are well documented in the literature (1,2). Many professional associations now consider RT after BCS to be an important quality of care indicator for breast cancer (3). Several population-based studies have investigated the compliance rates of RT and the associated factors. The majority of these studies focused on an elderly population and used either Medicare claims or the Surveillance, Epidemiology and End Results (SEER)–Medicare data (4–14). However, recent estimates reported that approximately 60% of breast cancer patients diagnosed between 2005 and 2009 were aged less than 65 years (15), yet the pattern of RT after BCS among young women remained underexplored.
Understanding the pattern of RT after BCS among young patients and factors associated with noncompliance has important clinical and economic implications. Today it is well accepted that breast cancers diagnosed at younger ages differ from those diagnosed at older ages; younger women tend to have more aggressive tumors that are associated with higher risks of local and distant recurrence (16). A meta-analysis reported that RT after BCS increased survival and reduced local recurrence, especially among young patients (1,2). Thus, young breast cancer patients who underwent BCS are expected to benefit more from RT. From an economic perspective, many women aged less than 65 years are active participants in the workforce; therefore, their absence from the labor market because of morbidity associated with cancer symptoms and treatment or premature death from cancer will lead to substantial productivity loss. Indeed, the estimated costs of productivity loss because of breast cancer were $10.9 billion in 2010 (17).
The few studies that included young breast cancer patients used cancer registry data, such as SEER or the National Cancer Database (18–21), to determine the pattern of RT after BCS. Although the rate of RT may be underestimated in these studies because validation studies have raised the concern of underascertainment for RT identified from registry data (22,23), an interesting pattern was observed in the two studies that focused exclusively on young breast cancer patients (19,21). Both reported a lower rate of RT after BCS among patients at a younger age. One study found that the rate of RT was 81% for women aged 50 to 55 years and was 75% for those aged 35 years or younger (19); the other reported the rate to be 69%, 73%, and 80% for women in the age ranges of 35 years or younger, 36 to 40 years, and 61 to 64, respectively (21).
The purpose of our study was twofold. First, we used claims and enrollment data from employer-sponsored insurance plans to explore factors associated with the use of RT after BCS among young patients with breast cancer. Second, we tested a hypothesis that the lower rate of RT observed among younger women may be associated with competing demand of their time in providing child care. Specifically, we investigated whether younger women with young children were less likely to undergo RT after BCS compared to women at similar ages without young children.
Methods
Data Sources
We used a large, nationwide, employment-based MarketScan database (24) that contains information on medical and outpatient prescription drug claims for employees and their spouses and dependents; the data represent claims from approximately 45 large employers and capture claims records from more than 100 payers. The University of Chicago’s Institutional Review Board exempted this study for approval because all observations were deidentified.
Ascertainment of Study Cohort
We applied a previously published algorithm for claims data to identify incident cases of breast cancer (14). We first identified our study cohort as women aged 20 to 64 years who had at least one International Classification of Diseases, 9th Edition (ICD-9) diagnosis code indicating invasive breast cancer (ICD 9 CM 174.XX) and a procedure code of breast cancer surgery between January 1, 2004, and December 31, 2009. BCS was identified by common procedural terminology 4 and ICD-9 procedure codes (6). The earliest claims date indicating BCS was chosen as the index date. Patients who had mastectomy or both BCS and mastectomy claims concurrently were excluded. We then limited the study cohort to those who had continuous enrollment in health insurance 12 months before and after the index date to ensure that information obtained from claims in this 24-month window was complete. We excluded patients who had a breast cancer diagnosis more than 12 months before the index date, a prior history of breast cancer, RT before BCS, and mastectomy within 12 months of BCS. Lastly, we excluded patients with missing information on geographic region of residence or comorbidities and those with claims indicating distant metastasis. The final sample was 21 008 young women (Figure 1).
Figure 1.
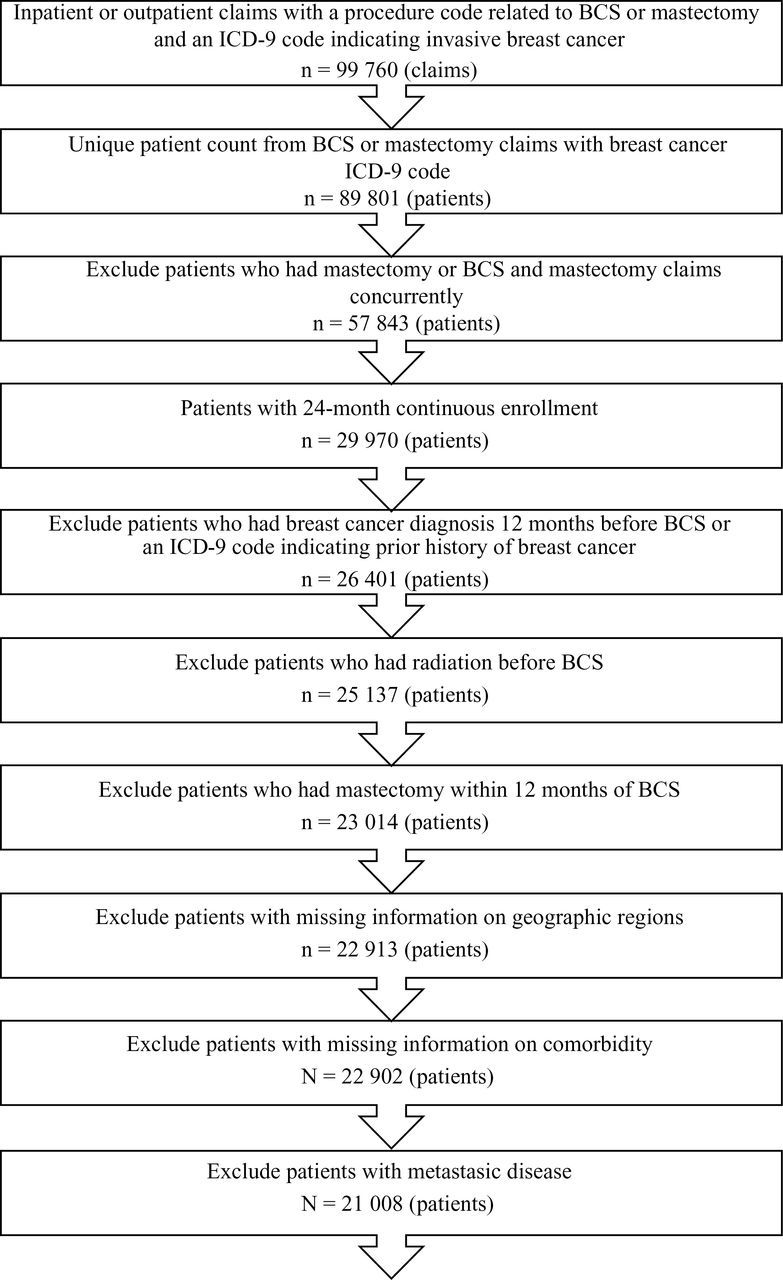
Flow chart for data selection step. BCS = breast conserving surgery; ICD-9 = International Classification of Diseases, 9th Edition.
Identification of Radiation Therapy and Other Clinical Variables
We identified RT using ICD-9 procedure, common procedural terminology, and revenue center codes based on published algorithms (14,25–27). We defined patients who were compliant as those who had any RT claims within 12 months of BCS. Other treatment-related variables included chemotherapy, use of staging imaging, axillary surgery, pre-BCS mammography screening, and inpatient vs outpatient BCS. Codes used to identify these variables are provided in Supplementary Table 1 (available online).
Other clinical variables included axillary lymph node involvement and whether the patient had a ductal-carcinoma-in-situ (DCIS) diagnosis within 12 months of the index date (25–28). Comorbidity was constructed using Klabunde’s modified algorithm of Charlson comorbidity score (29).
Patients and Area Characteristics
We obtained patient age, geographic regions of residence, and whether the patient was the primary holder of insurance directly from the MarketScan database. We derived several patient characteristics variables using information provided in the data. First, we took advantage of the age information for the patients’ dependents in the enrollment file to infer patients’ family structure based on whether the family had a child of young age. Specifically, we classified families into four categories: families with at least one child aged less than 7 years, with no children aged less than 7 years but at least one child aged 7 to 12 years, with no children aged less than 13 years but at least one child aged 13 to 17 years, and those with no children or only children aged greater than 17 years. Our choice of cutpoints corresponds to the typical age ranges in nursery, elementary, middle/high school, and postsecondary education in the US education system (30). These categories reflect the child-care need, with the greatest need in families with at least one child aged less than 7 years. Second, we regrouped the insurance plan type variable into two categories based on whether patients were more likely to be tightly managed under the payment policy of their insurance: Health maintenance organization (HMO) or preferred provider organization (PPO) with capitation vs all other plan types. Third, we constructed a proxy variable to indicate whether patients may need to travel a long distance to receive RT by evaluating whether the geographic area (in terms of Census division) of the patient differed from that of her BCS provider.
We obtained variables of area characteristics by linking patients’ county of residence to the 2004 to 2009 Area Resource File (31) and measured the socioeconomic status (in quartiles) as the percentage of families with median household income below poverty level and percentage of adults with college degree. For health-care resources related to radiation therapy, we reorganized counties into health services area based on the modified health service area definition by the National Cancer Institute (32). Using health service area as the geographic unit that formed the patient’s local market for RT, we included two supply-side variables in quartiles: density of hospitals with radiation therapy and density of radiation oncologists.
Statistical Analysis
We used SAS version 9.2 (SAS Institute Inc. Cary, NC) for data management and STATA version 11.0 (StataCorp LP, College Station, TX) for statistical analyses. We used Pearson χ2 test to compare each covariable for women with RT within 12 months of BCS and those without and ran logistic regressions to examine factors associated with the receipt of RT. We applied three methods for model diagnosis, including ‘linktest’ in STATA, the Hosmer–Lemeshow goodness-of-fit test, and the Bayesian information criterion. The model specification that passed all three tests was chosen as the final model. In addition, we used perturbation analyses to assess potential impact of collinearity and misclassification (33,34). Next, we conducted stratified analyses by patients’ age (aged 20–50, 51–55, 56–60, and 61–64 years) to determine whether certain covariables (eg, age of children) were only relevant to a specific age group. We also performed sensitivity analyses to evaluate the robustness of study findings across various subgroups. All statistical tests were two-sided.
Results
Eighteen thousand one hundred twenty (86.25%) of the 21 008 patients received RT within a year of BCS. Table 1 shows that the majority of the patients (89.86%) had no comorbidity. More than half of the patients (59.51%) were the primary holders of the insurance policy. Among the study cohort, 4.25% had at least one child aged less than 7 years, and the rate of RT was 80.61% for this group. Geographic variations in RT compliance were also observed, ranging from less than 80% in the Pacific Census division to close to 90% in the West-North-Central Census division.
Table 1.
Analysis of univariate χ2 test and multivariable logistic regression (full study sample)*
| Univariate analysis | Logistic regression | |||||
|---|---|---|---|---|---|---|
| Variables | No. of case patients | % | Percentage who received RT | P | Odds ratio (95%CI) | P |
| Total No. of case patients | 21008 | 86.25 | ||||
| Age, y | <.001 | <.001† | ||||
| 20 – 50 | 7270 | 34.61 | 84.26 | 1.00 (referent) | ||
| 51 – 55 | 4756 | 22.64 | 86.75 | 1.22 (1.08 to 1.37) | .001 | |
| 56 – 60 | 5604 | 26.68 | 87.90 | 1.38 (1.22 to 1.55) | <.001 | |
| 61 – 64 | 3378 | 16.08 | 87.09 | 1.28 (1.11 to 1.47) | <.001 | |
| Comorbidities | .10 | .02† | ||||
| 0 | 18878 | 89.86 | 86.23 | 1.00 (referent) | ||
| 1 | 1813 | 8.63 | 87.09 | 0.95 (0.82 to 1.10) | .51 | |
| ≥2 | 317 | 1.51 | 82.65 | 0.64 (0.47 to 0.87) | .005 | |
| Employee status | <.001 | |||||
| Primary holder of insurance policy | 12501 | 59.51 | 87.11 | 1.00 (referent) | ||
| others | 8507 | 40.49 | 85.00 | 1.20 (1.10 to 1.31) | <.001 | |
| Family status | <.001 | .01† | ||||
| With at least one child < age 7 years† | 892 | 4.25 | 80.61 | 1.00 (referent) | ||
| With all children > age 6 and at least one child between ages 7 and 12 years | 1584 | 7.54 | 84.34 | 1.32 (1.05 to 1.66) | .02 | |
| With all children > age 12 and at least one child between ages 13 and 17 years | 2016 | 9.60 | 85.07 | 1.41 (1.13 to 1.75) | .002 | |
| With no children or all children > age 18 years | 16516 | 78.62 | 86.89 | 1.38 (1.13 to 1.68) | .001 | |
| HMO or PPO with capitation | <.001 | |||||
| No | 17447 | 83.19 | 87.29 | 1.00 (referent) | ||
| Yes | 3531 | 16.81 | 81.14 | 0.70 (0.63 to 0.77) | <.001 | |
| Census divisions | <.001 | <.001† | ||||
| Pacific (AK, CA, HI, OR, WA) | 2895 | 13.78 | 79.52 | 1.00 (referent) | ||
| New England (CT, MA, NH, ME, RI, VT) | 691 | 3.29 | 88.57 | 1.89 (1.45 to 2.48) | <.001 | |
| Middle Atlantic (NJ, NY, PA) | 1168 | 5.56 | 86.99 | 1.75 (1.42 to 2.14) | <.001 | |
| East North Central (IL, IN, MI, OH, WI) | 4647 | 22.12 | 87.76 | 1.65 (1.41 to 1.93) | <.001 | |
| West North Central (IA, KS, MN, MO, NE, ND, SD) | 1122 | 5.34 | 89.57 | 1.89 (1.51 to 2.38) | <.001 | |
| South Atlantic (DE, DC, FL, GA, MD, NC, SC, VA) | 4791 | 22.81 | 87.27 | 1.60 (1.39 to 1.83) | <.001 | |
| East South Central (AL, KY, MS, TN) | 1726 | 8.22 | 84.99 | 1.30 (1.09 to 1.56) | .003 | |
| West South Central (AR, LA, OK, TX) | 2890 | 13.76 | 88.03 | 1.49 (1.27 to 1.74) | <.001 | |
| Mountain (AZ, CO,ID, MT, NV, NM, UT, WY) | 1078 | 5.13 | 84.88 | 1.26 (1.03 to 1.54) | .02 | |
| Metropolitan area | .52 | |||||
| No | 3514 | 16.73 | 85.91 | 1.00 (referent) | ||
| Yes | 17494 | 83.27 | 86.32 | 1.13 (0.99 to 1.29) | .06 | |
| Axillary LN Dissection | <.001 | |||||
| No | 5633 | 26.81 | 76.97 | 1.00 (referent) | ||
| Yes | 15375 | 73.19 | 89.65 | 2.30 (2.11 to 2.51) | <.001 | |
| Axillary LN involvement | <.001 | |||||
| No | 17813 | 84.79 | 85.41 | 1.00 (referent) | ||
| Yes | 3195 | 15.21 | 90.95 | 1.14 (0.99 to 1.31) | .08 | |
| DCIS diagnosis within 1 year of surgery | <.001 | |||||
| No | 13056 | 62.15 | 88.36 | 1.00 (referent) | ||
| Yes | 7952 | 37.85 | 82.80 | 0.80 (0.73 to 0.87) | <.001 | |
| Surgery type | ||||||
| Inpatient BCS | 743 | 3.54 | 89.64 | .006 | 1.00 (referent) | |
| Outpatient BCS | 20265 | 96.46 | 86.13 | 0.73 (0.57 to 0.94) | .02 | |
| Chemotherapy | <.001 | |||||
| No | 11810 | 56.22 | 82.35 | 1.00 (referent) | ||
| Yes | 9198 | 43.78 | 91.26 | 1.83 (1.65 to 2.03) | <.001 | |
| Imaging | <.001 | |||||
| No | 10705 | 50.96 | 83.36 | 1.00 (referent) | ||
| Yes | 10303 | 49.04 | 89.26 | 1.33 (1.22 to 1.45) | <.001 | |
| Mammogram screening | <.001 | |||||
| No | 3463 | 16.48 | 81.72 | 1.00 (referent) | ||
| Yes | 17545 | 83.52 | 87.15 | 1.57 (1.42 to 1.74) | <.001 | |
| Density of hospitals with radiation therapy within a health services area | <.001 | .76† | ||||
| Q4 | 5295 | 25.20 | 86.82 | 1.00 (referent) | ||
| Q3 | 5146 | 24.50 | 87.68 | 1.03 (0.91 to 1.17) | .63 | |
| Q2 | 5453 | 25.96 | 85.00 | 0.97 (0.86 to 1.10) | .64 | |
| Q1 | 5114 | 24.34 | 85.57 | 1.02 (0.90 to 1.17) | .71 | |
| Density of radiation oncologist within a health services area | .001 | .54† | ||||
| Q4 | 5581 | 26.57 | 87.67 | 1.00 (referent) | ||
| Q3 | 4926 | 23.45 | 85.28 | 0.92 (0.81 to 1.04) | .16 | |
| Q2 | 5264 | 25.06 | 85.43 | 0.97 (0.85 to 1.11) | .67 | |
| Q1 | 5237 | 24.93 | 86.48 | 0.96 (0.84 to 1.10) | .53 | |
| Percentage of Families income under poverty level | .005 | .012† | ||||
| Q4 | 5770 | 27.47 | 86.26 | 1.00 (referent) | ||
| Q3 | 4950 | 23.56 | 84.83 | 0.88 (0.78 to 0.98) | .03 | |
| Q2 | 5243 | 24.96 | 87.09 | 1.05 (0.93 to 1.19) | .42 | |
| Q1 | 5045 | 24.01 | 86.78 | 0.92 (0.80 to 1.06) | .26 | |
| Percentage of neighborhood with college education | .50 | .047† | ||||
| Q4 | 5366 | 25.54 | 86.81 | 1.00 (referent) | ||
| Q3 | 5251 | 25.00 | 86.31 | 0.93 (0.82 to 1.06) | .29 | |
| Q2 | 5257 | 25.02 | 86.06 | 0.84 (0.74 to 0.95) | .008 | |
| Q1 | 5134 | 24.44 | 85.82 | 0.84 (0.72 to 0.98) | .03 | |
| Surgery year | .49 | .07† | ||||
| 2004 | 2588 | 12.32 | 85.16 | 1.00 (referent) | ||
| 2005 | 3000 | 14.28 | 86.27 | 1.01 (0.86 to 1.18) | .93 | |
| 2006 | 3020 | 14.38 | 86.69 | 1.07 (0.91 to 1.26) | .39 | |
| 2007 | 4271 | 20.33 | 86.02 | 1.13 (0.98 to 1.32) | .095 | |
| 2008 | 4124 | 19.63 | 86.28 | 1.15 (1.00 to 1.34) | .06 | |
| 2009 | 4005 | 19.06 | 86.84 | 1.21 (1.04 to 1.41) | .01 | |
| Travel across Census division to receive BCS | .001 | |||||
| No | 20045 | 95.42 | 86.43 | 1.00 (referent) | ||
| Yes | 963 | 4.58 | 82.55 | 0.72 (0.60 to 0.86) | <.001 | |
* All statistical tests were two-sided. BCS = breast conserving surgery; CI = confidence interval; DCIS = ductal carcinoma in situ. HMO = health maintenance organization; LN= lymph node; PPO = preferred provider organization; RT = radiation therapy.
† P value from likelihood ratio test.
Results from the logistic regression (Table 1) showed that compared with patients aged 50 years of age or younger, the odds ratio (OR) of receiving radiation therapy was 1.22 (95% confidence interval (CI) = 1.08 to 1.37), 1.38 (95% CI = 1.22 to 1.55), and 1.28 (95% CI = 1.11 to 1.47) for those in the age ranges 51 to 55 years, 56 to 60 years, and 61 to 64 years, respectively. Having at least one child aged less than 7 years resulted in statistically significantly lower odds of radiation therapy than having no children or older children. Among young patients (aged 20–64 years), compared with those with at least one young child (aged <7 years), patients with children aged 7 to 12 years, patients with children aged 13 to 17 years, and patient with no children or children aged 18 years or older were more likely to receive RT (children 7–12 years: OR = 1.32, 95% CI = 1.05 to 1.66, P = .02; children 13–17 years: OR = 1.41, 95% CI = 1.13 to 1.75, P = .002; no children or children ≥18 years: OR = 1.38, 95% CI = 1.13 to 1.68, P = .001). Perturbation analyses (Supplementary Table 2, available online) showed that although women’s age group and the family structure variable were correlated, the correlation was not high enough to cause incorrect inferences. Statistically significantly lower odds of RT were observed among patients who were enrolled in a HMO or a capitation PPO (OR = 0.70; 95% CI = 0.63 to 0.77), patients who travelled across Census division to receive BCS (OR = 0.72; 95% CI = 0.60 to 0.86), or patients who received BCS in an outpatient setting (OR = 0.73; 95% CI = 0.57 to 0.94). In addition, patients who were the primary holder of insurance policy were more likely to have RT (OR = 1.20; 95% CI = 1.10 to 1.31). Those living in areas with lower percentages of the population with college education were statistically significantly less likely to receive RT. In addition, DCIS was found to be statistically significantly negatively associated with the receipt of RT. Patients with chemotherapy, imaging, and mammogram screening were more likely to receive RT after BCS.
Analyses stratified by age group (Table 2) showed that the association between young children and lower likelihood of RT was statistically significant only in the youngest age group of women (aged 20–50 years). This suggested that the association observed in the full sample was primarily driven by women in the youngest age group. Other associations observed above largely persisted across all age groups. In addition, sensitivity analyses (Figure 2) for women in the youngest age group showed that our hypothesized relationship was supported regardless of patients’ DCIS status or whether they were primary holders of an insurance policy.
Table 2.
Comparison of multivariable logistic regression models among four age groups*
| Variables | Aged 20-50 y | Aged 51-55 y | Aged 56-60 y | Aged 61-64 y |
|---|---|---|---|---|
| Odds ratio (95%CI) | Odds ratio (95%CI) | Odds ratio (95%CI) | Odds ratio (95%CI) | |
| Comorbidities | .87† | .64† | .04† | .06† |
| 0 | 1.00 (referent) | 1.00 (referent) | 1.00 (referent) | 1.00 (referent) |
| 1 | 0.97 (0.71 to 1.32) | 1.06 (0.76 to 1.48) | 0.84 (0.65 to 1.09) | 1.01 (0.73 to 1.41) |
| ≥2 | 1.24 (0.47 to 3.24) | 0.71 (0.32 to 1.54) | 0.55 (0.35 to 0.88) | 0.48 (0.28 to 0.82) |
| Employee status | ||||
| Primary holder of insurance policy | 1.00 (referent) | 1.00 (referent) | 1.00 (referent) | 1.00 (referent) |
| Others | 1.10 (0.96 to 1.27) | 1.34 (1.12 to 1.60) | 1.22 (1.03 to 1.45) | 1.29 (1.04 to 1.61) |
| Family status | .003† | .10† | .61† | .26† |
| With at least one child < age 7 years | 1.00 (referent) | 1.00 (referent) | 1.00 (referent) | 1.00 (referent) |
| With all children > age 6 years and at least one child between ages 7 and 12 years | 1.40 (1.10 to 1.78) | 1.08 (0.45 to 2.55) | 2.00 (0.44 to 9.14) | 0.84 (0.72 to 9.79) |
| With all children > age 12 years and at least one child between ages 13 and 17 years | 1.57 (1.23 to 2.01) | 1.11 (0.51 to 2.40) | 2.54 (0.68 to 9.50) | 5.44 (0.47 to 63.06) |
| With no children or all children > age 18 years | 1.40 (1.14 to 1.74) | 1.47 (0.70 to 3.09) | 1.99 (0.60 to 6.58) | 2.30 (0.30 to 17.83) |
| HMO or PPO with capitation | ||||
| No | 1.00 (referent) | 1.00 (referent) | 1.00 (referent) | 1.00 (referent) |
| Yes | 0.72 (0.61 to 0.85) | 0.73 (0.59 to 0.91) | 0.67 (0.54 to 0.83) | 0.56 (0.42 to 0.74) |
| Census Divisions | <.001† | <.001† | .04† | .005† |
| Pacific (AK, CA, HI, OR, WA) | 1.00 (referent) | 1.00 (referent) | 1.00 (referent) | 1.00 (referent) |
| New England (CT, MA, NH, ME, RI, VT) | 1.55 (1.02 to 2.35) | 2.44 (1.37 to 4.34) | 2.01 (1.11 to 3.61) | 2.23 (1.07 to 4.64) |
| Middle Atlantic (NJ, NY, PA) | 1.49 (1.09 to 2.04) | 2.44 (1.53 to 3.89) | 1.49 (0.95 to 2.33) | 2.16 (1.26 to 3.71) |
| East North Central (IL, IN, MI, OH, WI) | 1.42 (1.09 to 1.85) | 1.93 (1.39 to 2.68) | 1.68 (1.21 to 2.33) | 1.83 (1.25 to 2.68) |
| West North Central (IA, KS, MN, MO, NE, ND, SD) | 1.62 (1.14 to 2.32) | 2.67 (1.59 to 4.47) | 2.04 (1.25 to 3.34) | 1.62 (0.92 to 2.86) |
| South Atlantic (DE, DC, FL, GA, MD, NC, SC, VA) | 1.64 (1.30 to 2.06) | 1.93 (1.44 to 2.58) | 1.39 (1.05 to 1.84) | 1.48 (1.06 to 2.06) |
| East South Central (AL, KY, MS, TN) | 1.01 (0.76 to 1.35) | 1.39 (0.96 to 2.02) | 1.39 (0.96 to 2.01) | 2.06 (1.25-3.39) |
| West South Central (AR, LA, OK, TX) | 1.09 (0.84 to 1.42) | 1.69 (1.19 to 2.38) | 1.66 (1.19 to 2.31) | 2.44 (1.58 to 3.77) |
| Mountain (AZ, CO,ID, MT, NV, NM, UT, WY) | 1.09 (0.77 to 1.53) | 1.33 (0.87 to 2.03) | 1.37 (0.90 to 2.10) | 1.40 (0.87 to 2.25) |
| Metropolitan area | ||||
| No | 1.00 (referent) | 1.00 (referent) | 1.00 (referent) | 1.00 (referent) |
| Yes | 1.28 (1.03 to 1.59) | 1.20 (0.90 to 1.58) | 1.05 (0.81 to 1.37) | 0.93 (0.66 to 1.30) |
| Axillary LN dissection | ||||
| No | 1.00 (referent) | 1.00 (referent) | 1.00 (referent) | 1.00 (referent) |
| Yes | 2.17 (1.88 to 2.50) | 2.77 (2.30 to 3.34) | 2.12 (1.76 to 2.55) | 2.34 (1.87 to 2.94) |
| Axillary LN involvement | ||||
| No | 1.00 (referent) | 1.00 (referent) | 1.00 (referent) | 1.00 (referent) |
| Yes | 1.26 (1.01 to 1.59) | 1.28 (0.94 to 1.75) | 1.02 (0.77 to 1.36) | 0.92 (0.63 to 1.36) |
| DCIS diagnosis within 1 year of surgery | ||||
| No | 1.00 (referent) | 1.00 (referent) | 1.00 (referent) | 1.00 (referent) |
| Yes | 0.80 (0.69 to 0.92) | 0.85 (0.70 to 1.03) | 0.73 (0.61 to 0.87) | 0.82 (0.65 to 1.03) |
| Surgery type | ||||
| Inpatient BCS | 1.00 (referent) | 1.00 (referent) | 1.00 (referent) | 1.00 (referent) |
| Outpatient BCS | 0.81 (0.53 to 1.24) | 0.58 (0.33 to 1.03) | 0.77 (0.47 to 1.27) | 0.61 (0.33 to 1.11) |
| Chemotherapy | ||||
| No | 1.00 (referent) | 1.00 (referent) | 1.00 (referent) | 1.00 (referent) |
| Yes | 2.18 (1.86 to 2.55) | 1.62 (1.31 to 2.02) | 1.63 (1.31-2.02) | 1.62 (1.22 to 2.15) |
| Imaging | ||||
| No | 1.00 (referent) | 1.00 (referent) | 1.00 (referent) | 1.00 (referent) |
| Yes | 1.26 (1.09 to 1.45) | 1.33 (1.11 to 1.61) | 1.43 (1.20 to 1.71) | 1.37 (1.09 to 1.71) |
| Mammogram Screening | ||||
| No | 1.00 (referent) | 1.00 (referent) | 1.00 (referent) | 1.00 (referent) |
| Yes | 1.41 (1.20 to 1.65) | 1.80 (1.44 to 2.25) | 1.71 (1.37 to 2.14) | 1.56 (1.18 to 2.05) |
| Density of hospitals with radiation therapy within a health services area | .01† | .18† | .44† | .56† |
| Q4 | 1.00 (referent) | 1.00 (referent) | 1.00 (referent) | 1.00 (referent) |
| Q3 | 1.18 (0.96 to 1.46) | 0.86 (0.66 to 1.12) | 1.08 (0.83 to 1.40) | 0.87 (0.64 to 1.19) |
| Q2 | 0.85 (0.70 to 1.05) | 1.06 (0.81 to 1.39) | 1.04 (0.80 to 1.34) | 1.10 (0.79 to 1.52) |
| Q1 | 1.09 (0.88 to 1.35) | 1.18 (0.89 to 1.57) | 0.87 (0.67 to 1.13) | 0.96 (0.69 to 1.33) |
| Density of radiation oncologist within a health services area | .82† | .12† | .24† | .08† |
| Q4 | 1.00 (referent) | 1.00 (referent) | 1.00 (referent) | 1.00 (referent) |
| Q3 | 0.98 (0.80 to 1.20) | 0.93 (0.72 to 1.22) | 0.95 (0.73 to 1.22) | 0.68 (0.50 to 0.94) |
| Q2 | 0.95 (0.77 to 1.18) | 0.93 (0.71 to 1.23) | 1.21 (0.92 to 1.58) | 0.77 (0.55 to 1.07) |
| Q1 | 0.90 (0.72 to 1.13) | 1.26 (0.94 to 1.70) | 1.03 (0.79 to 1.34) | 0.69 (0.49 to 0.97) |
| Percentage of families income under poverty level | .01† | .56† | .33† | .81† |
| Q4 | 1.00 (referent) | 1.00 (referent) | 1.00 (referent) | 1.00 (referent) |
| Q3 | 0.75 (0.62 to 0.90) | 0.88 (0.68 to 1.13) | 1.04 (0.82 to 1.32) | 0.96 (0.71 to 1.29) |
| Q2 | 0.96 (0.79 to 1.17) | 1.02 (0.78 to 1.33) | 1.22 (0.95 to 1.57) | 1.09 (0.80 to 1.49) |
| Q1 | 0.84 (0.67 to 1.05) | 0.88 (0.64 to 1.19) | 1.00 (0.76 to 1.32) | 1.11 (0.78 to 1.58) |
| Percentage of neighborhood with college education | .09† | .32† | .21† | .28† |
| Q4 | 1.00 (referent) | 1.00 (referent) | 1.00 (referent) | 1.00 (referent) |
| Q3 | 0.93 (0.76 to 1.13) | 1.14 (0.86 to 1.49) | 0.77 (0.60 to 0.99) | 1.04 (0.75 to 1.45) |
| Q2 | 0.78 (0.63 to 0.97) | 0.90 (0.68 to 1.19) | 0.91 (0.70 to 1.19) | 0.80 (0.57 to 1.10) |
| Q1 | 0.77 (0.60 to 0.99) | 0.91 (0.65 to 1.27) | 0.83 (0.61 to 1.12) | 0.98 (0.66 to 1.46) |
| Surgery year | .31† | .12† | .24† | .41† |
| 2004 | 1.00 (referent) | 1.00 | 1.00 (referent) | 1.00 (referent) |
| 2005 | 1.02 (0.79 to 1.31) | 1.26 (0.89 to 1.77) | 0.75 (0.54 to 1.04) | 1.17 (0.78 to 1.76) |
| 2006 | 1.05 (0.81 to 1.34) | 1.27 (0.90 to 1.78) | 0.90 (0.64 to 1.27) | 1.25 (0.83 to 1.88) |
| 2007 | 1.22 (0.96 to 1.55) | 1.34 (0.98 to 1.84) | 0.94 (0.68 to 1.28) | 1.07 (0.74 to 1.55) |
| 2008 | 1.18 (0.93 to 1.51) | 1.19 (0.87 to 1.63) | 0.98 (0.71 to 1.34) | 1.45 (0.99 to 2.11) |
| 2009 | 1.23 (0.97 to 1.57) | 1.59 (1.15 to 2.19) | 1.08 (0.7 to 1.49) | 1.11 (0.77 to 1.59) |
| Travel across Census division to receive BCS | ||||
| No | 1.00 (referent) | 1.00 (referent) | 1.00 (referent) | 1.00 (referent) |
| Yes | 0.63 (0.47 to 0.83) | 0.63 (0.44 to 0.92) | 0.85 (0.58 to 1.25) | 1.04 (0.60 to 1.79) |
* All statistical tests were two-sided. BCS = breast conserving surgery; CI = confidence interval; DCIS = ductal carcinoma in situ. HMO = health maintenance organization; LN = lymph node; PPO = preferred provider organization; RT = radiation therapy;
† P value from likelihood ratio test.
Figure 2.

Adjusted odds ratios in sensitivity analyses for family structure variables, by subgroups. Error bars represent 95% confidence intervals. All statistical tests were two-sided. DCIS = ductal carcinoma in situ.
Discussion
Our study of women aged less than 65 years who underwent BCS estimated that the compliance rate of RT was 86%, which was higher than the rate reported among Medicare beneficiaries (14). Although the overall compliance rate among our study cohort was high, it is puzzling why nearly 15% of these BCS patients did not receive RT given that all patients in our sample had employer-sponsored health insurance. What is even more puzzling is that women in the youngest age group (aged 20–50 years) were statistically significantly less likely to receive RT than their older counterparts, although these younger women had the most to gain from the reduction in the risk of recurrence associated with RT. This study provides important insights to understanding these counterintuitive patterns.
Anecdotal stories from patients indicated that the need to arrange for childcare can be challenging for women undergoing RT because the entire course of treatment typically involves spending 30 to 60 minutes at a radiation facility 5 days a week for 3 to 7 weeks. Our study concluded that for women aged 20 to 50 years, those in families with at least one child aged less than 7 years were less likely to receive RT after BCS than patients in families with no children aged less than 7 years. Although this finding is not surprising because children aged less than 7 years are highly dependent on their parents, to our knowledge this is the first study in the medical literature to formally explore the association between family structure and receipt of guideline-concordant cancer therapy. Findings from our study suggest that child-care supplements provided by employers may have additional health benefits: it reduces the disincentive for employees or their spouses to seek care because of the concern of child-care need. To what extent this fringe benefit influences a young breast cancer patient’s decision to undergo RT is a topic worth exploring in future research.
The receipt of RT after BCS represents one aspect of quality cancer care; therefore, a higher compliance rate is likely to be observed among patients whose other aspects of care are of high quality. We included several clinical variables to examine the association between RT and other breast cancer quality measures endorsed by the National Quality Forum (35). Indeed, positive associations were observed between RT and the other three quality measures (chemotherapy, staging imaging, and axillary surgery) in the full sample and for each age group. This finding suggests that devoting efforts to improving overall quality of breast cancer care could also improve RT compliance in addition to interventions targeting RT as an isolated event.
We found that patients whose BCS was performed by a provider not within the same Census division as their residence were less likely to receive RT. Using patients’ travelling to a different Census division for BCS as a proxy for having to travel a longer distance to receive RT, our study concluded that distance may create an access barrier for the receipt of RT. This observation was consistent with findings in the literature (36–38). We also found wide variation in RT compliance across Census divisions, with the lowest rate observed in the Pacific region. Consistent with this finding, prior studies indicate that among patients with DCIS, RT compliance is lower in Los Angeles than in other SEER registries (39,40). Similarly, a national Medicare study of older women with invasive breast cancer found low RT compliance and substantial racial disparity among women residing in California (14). Potential causative factors underlying geographic variation remain unclear, although it should be noted that some of the leading academic physicians advocating for decreased use of RT in treatment of DCIS practice in the Los Angeles area (41), suggesting that this academic work reflects and/or influences regional practice patterns.
Institutional and patient-specific factors also matter. Patients enrolled in HMOs or capitated PPOs were less likely to receive RT than those in other plan types. Although this finding is alarming, our data do not contain sufficient information to allow further assessment of whether specific features in insurance benefit designs, such as less generous coverage or more limited choices of providers, have created access barrier for RT. With the exception of the youngest age group, women who were the primary holders of an insurance policy were more likely to receive RT. Policy implications of this finding were less clear because we were not able to determine to what extent the finding may reflect the completeness of claims for those who were primary holders vs those who were not. Lastly, patient comorbidities were not associated with RT among the younger age groups. This was probably because 94.7% and 90.3% of women in the groups aged 20 to 50 years and 51 to 55 years, respectively, had zero comorbidity.
Our study has several limitations. First, we were not able to determine whether there may be racial/ethnic disparities in the receipt of RT because race and ethnicity was not collected in the MarketScan database. The observed association between young children and RT would likely be attenuated if minorities tended to be diagnosed at younger age (and thus were more likely to have young children) and also were either more likely to be diagnosed at late stage or less likely to receive guideline-concordant care. Second, the MarketScan database is not linked to cancer registries; therefore, we did not have pathologic information, such as cancer stage, grade, and hormone receptor status that may affect the receipt of RT. Also, we had to apply a claims-based algorithm to identify the incident cases of breast cancer. Our algorithm (14) was modified from a previously validated algorithm (25) by using only breast cancer surgery and diagnosis as the initial step to ascertain our study cohort without including all other “qualifiers” (including RT) in the Nattinger et al. algorithm (25). However, because our study focused on RT compliance, false positives of incident cases should be less problematic once a BCS was identified. Despite our efforts to exclude potential prevalent cases, a proportion of our cohort could still be prevalent cases (ie, BCS performed to either rule out or treat an in-breast tumor recurrence), which can lead to underestimation of the rate of RT. Third, relying on the enrollment data as the sole criterion to identify children would miss information on children who were not covered under the health insurance plans in the MarketScan database, causing misclassification of the family structure variable. However, results from perturbation analyses suggested that such misclassification should not have a large impact on our estimates. Lastly, we relied on a proxy measure to determine whether patients may need to travel a longer distance for their RT because we did not have information on the location of all radiation facilities accessible to patients in our study cohort.
A wealth of literature has characterized population-based treatment patterns and outcomes among older women with breast cancer, yet, to date, little work has evaluated younger women. Our finding that a young child in the home is a barrier to completion of appropriate breast cancer therapy underscores the unique challenges confronted by younger (aged 20–50 years) cancer patients. Additional work is needed to understand the impact of family structure on other aspects of cancer care and to develop robust interventions tailored to the unique needs of younger cancer patients.
Funding
This work was support by the Agency for Healthcare Research and Quality (R01 HS018535 to YCTS); the University of Chicago Cancer Research Foundation Women’s Board; and the Cancer Prevention & Research Institute of Texas (RP101207 to BDS).
The authors would like to thank Nicole Babuskow for editing the paper. The work was completed while I.W. Pan was an employee at the University of Chicago.
References
- 1. Clarke M, Collins R, Darby S, et al. Effects of radiotherapy and of differences in the extent of surgery for early breast cancer on local recurrence and 15-year survival: an overview of the randomised trials. Lancet. 2005;366(9503):2087–2106 [DOI] [PubMed] [Google Scholar]
- 2. Clarke M, Collins R, Darby S, et al. Effect of radiotherapy after breast-conserving surgery on 10-year recurrence and 15-year breast cancer death: meta-analysis of individual patient data for 10801 women in 17 randomised trials. Lancet. 2011;378(9804):1707–1716 [DOI] [PMC free article] [PubMed] [Google Scholar]
- 3. Desch CE, McNiff KK, Schneider EC, et al. American Society of Clinical Oncology/National Comprehensive Cancer Network Quality Measures. J Clin Oncol. 2008;26(21):3631–3637 [DOI] [PubMed] [Google Scholar]
- 4. Haggstrom DA, Quale C, Smith-Bindman R. Differences in the quality of breast cancer care among vulnerable populations. Cancer. 2005;104(11):2347–2358 [DOI] [PubMed] [Google Scholar]
- 5. Smith BD, Gross CP, Smith GL, Galusha DH, Bekelman JE, Haffty BG. Effectiveness of radiation therapy for older women with early breast cancer. J Natl Cancer Inst. 2006;98(10):681–690 [DOI] [PubMed] [Google Scholar]
- 6. Hershman DL, Buono D, McBride RB, et al. Surgeon characteristics and receipt of adjuvant radiotherapy in women with breast cancer. J Natl Cancer Inst. 2008;100(3):199–206 [DOI] [PubMed] [Google Scholar]
- 7. Srokowski TP, Fang S, Duan Z, et al. Completion of adjuvant radiation therapy among women with breast cancer. Cancer. 2008;113(1):22–29 [DOI] [PMC free article] [PubMed] [Google Scholar]
- 8. Smith BD, Smith GL, Roberts KB, Buchholz TA. Baseline utilization of breast radiotherapy before institution of the Medicare practice quality reporting initiative. Int J Radiat Oncol Biol Phys. 2009;74(5):1506–1512 [DOI] [PubMed] [Google Scholar]
- 9. Keating NL, Kouri E, He Y, Weeks JC, Winer EP. Racial differences in definitive breast cancer therapy in older women: are they explained by the hospitals where patients undergo surgery? Med Care. 2009;47(7):765–773 [DOI] [PubMed] [Google Scholar]
- 10. Smith GL, Xu Y, Shih YCT, et al. Breast-conserving surgery in older patients with invasive breast cancer: current patterns of treatment across the United States. J AM Coll Surg. 2009;209(4):425–433 [DOI] [PubMed] [Google Scholar]
- 11. Keating NL, Landrum MB, Brooks JM, et al. Outcomes following local therapy for early-stage breast cancer in non-trial populations. Breast Cancer Res Treat. 2011;125(3):803–813 [DOI] [PMC free article] [PubMed] [Google Scholar]
- 12. Schonberg MA, Marcantonio ER, Li D, Silliman RA, Ngo L, McCarthy EP. Breast cancer among the oldest old: tumor characteristics, treatment choices, and survival. J Clin Oncol. 2010;28(12):2038–2045 [DOI] [PMC free article] [PubMed] [Google Scholar]
- 13. Dragun AE, Huang B, Tucker TC, Spanos WJ. Disparity in the application of adjuvant radiotherapy after breast-conserving surgery for early stage breast cancer. Cancer. 2011;117(12):2590–2598 [DOI] [PubMed] [Google Scholar]
- 14. Smith GL, Shih YC, Xu Y, et al. , GWoodward WA, Buchholz TA. Racial disparities in the use of radiotherapy after breast-conserving surgery: a national Medicare study. Cancer. 2010;116(3):734–741 [DOI] [PMC free article] [PubMed] [Google Scholar]
- 15. Howlader N, Noone AM, Krapcho M, et al. SEER Cancer Statistics Review, 1975–2009 (Vintage 2009 Populations). http://seer.cancer.gov/csr/1975_2009_pops09/ Accessed October 28, 2013 [Google Scholar]
- 16. Beadle BM, Woodward WA, Buchholz TA. The impact of age on outcome in early-stage breast cancer. Semin Radiat Oncol. 2011;21(1):26–34 [DOI] [PMC free article] [PubMed] [Google Scholar]
- 17. Bradley CJ, Yabroff KR, Dahman B, Feuer EJ, Mariotto A, Brown ML. Productivity costs of cancer mortality in the United States: 2000–2020. J Natl Cancer Inst. 2008;100(24):1763–1770 [DOI] [PMC free article] [PubMed] [Google Scholar]
- 18. Freedman RA, He Y, Winer EP, Keating NL. Trends in racial and age disparities in definitive local therapy of early-stage breast cancer. J Clin Oncol. 2009;27(5):713–719 [DOI] [PubMed] [Google Scholar]
- 19. Maggard MA, O’Connell JB, Lane KE, Liu HJ, Etzioni DA, Ko YC. Do young breast cancer patients have worse outcomes? J Surg Res. 2003;113(1):109–113 [DOI] [PubMed] [Google Scholar]
- 20. Nattinger AB, Hoffmann RG, Kneusel RT, Schapira MM. Relation between appropriateness of primary therapy for early-stage breast carcinoma and increased use of breast-conserving surgery. Lancet. 2000;356(9236):1148–1153 [DOI] [PubMed] [Google Scholar]
- 21. Freedman RA, Virgo KS, He Y, Partridge AH, Keating NL. Receipt of locoregional therapy among young women with breast cancer. Breast Cancer Res Treat. 2012;135(3):893–906 [DOI] [PubMed] [Google Scholar]
- 22. Malin JL, Kahn KL, Adams J, Kwan L, Laouri M, Ganz PA. Validity of cancer registry data for measuring the quality of breast cancer care. J Natl Cancer Inst. 2002;94:835–844 [DOI] [PubMed] [Google Scholar]
- 23. Jagi R, Abrahamse P, Hawley ST, Graff JJ, Hamilton AS, Katz SJ. Underascertainment of radiotherapy receipt in Surveillance, Epidemiology, and End Results Registry data. Cancer. 2012;118(2):333–341 [DOI] [PMC free article] [PubMed] [Google Scholar]
- 24. Thomson Reuters Marketscan Publication and Trademark guidelines 2011. Ann Arbor, MI: Thomson Reuters (Healthcare) Inc.; 2011.
- 25. Nattinger AB, Laud PW, Bajorunaite R, et al. An algorithm for the use of Medicare claims data to identify women with incident breast cancer. Health Serv Res. 2004;39(6):1733–1750 [DOI] [PMC free article] [PubMed] [Google Scholar]
- 26. Smith BD, Pan IW, Shih YCT, et al. Adoption of intensity-modulated radiation therapy for breast cancer in the United States. J Natl Cancer Inst. 2011;103(10):798–809 [DOI] [PubMed] [Google Scholar]
- 27. Smith GL, Xu Y, Buchholz TA, et al. Brachytherapy for accelerated partial-breast irradiation: a rapidly emerging technology in breast cancer care. J Clin Oncol. 2011;29(2):157–165 [DOI] [PubMed] [Google Scholar]
- 28. Rao VM, Levin DC, Parker L, Cavanaugh B, Frangos AJ, Sunshine JH. How widely is computer-aided detection used in screening and diagnostic mammography? J Am Coll Radiol. 2010;7(10):802–805 [DOI] [PubMed] [Google Scholar]
- 29. Klabunde CN, Potosky AL, Legler JM, Warren JL. Development of a comorbidity index using physician claims data. J Clin Epidemiol. 2000;53(12):1258–1267 [DOI] [PubMed] [Google Scholar]
- 30. Centers for Disease Control and Prevention National Survey of Family Growth. http://www.cdc.gov/nchs/nsfg/abc_list_c.htm#workingmothers Accessed January 25, 2013 [Google Scholar]
- 31. US Department of Health and Human Services HRSA Health Resources and Services Administration Health Professions. Area Resource File (ARF) National County-level Health Resource Information Database. http://arf.hrsa.gov/ Accessed May 18, 2012 [Google Scholar]
- 32. National Cancer Institute Surveillance Epidemiology and End Results Health Service Area. http://seer.cancer.gov/seerstat/variables/countyattribs/hsa.html Accessed May 18, 2012 [Google Scholar]
- 33. Belsley DA. Conditioning diagnostics, collinearity and weak data in regression. New York: John Wiley & Sons; 1991. [Google Scholar]
- 34. Hendrickx J, Belzer B, te Grotenhuis M, Lammers J. Collinearity Involving Ordered and Unordered Cateogrical Variables. http://www.belgeler.com/blg/2a5r/collinearity-with-categorical-variables Accessed July 15, 2013 [Google Scholar]
- 35. National Quality Forum National Voluntary Consensus Standards for Quality of Cancer Care: A Consensus Report. Washington DC: National Quality Forum; 2009 [Google Scholar]
- 36. Athas WF, Ada-Cameron M, Hunt WC, Amir-Fazli A, Key CR. Travel distance to radiation therapy and receipt of radiotherapy following breast-conserving surgery. J Natl Cancer Inst. 2000;92(3):269–271 [DOI] [PubMed] [Google Scholar]
- 37. Boscoe FP, Johnson CJ, Henry KA, et al. Geographic proximity to treatment for early stage breast cancer and likelihood of mastectomy. Breast. 2011;20(4):324–328 [DOI] [PubMed] [Google Scholar]
- 38. Schroen AT, Brenin DR, Kelly MD, Knaus WA, Slingluff CL., Jr Impact of patient distance to radiation therapy on mastectomy use in early-stage breast cancer patients. J Clin Oncol. 2005;23(28):7074–7080. [DOI] [PubMed] [Google Scholar]
- 39. Smith GL, Smith BD, Haffty BG. Rationalization and regionalization of treatment for ductal carcinoma in situ of the breast. Int J Radiat Oncol Biol Phys. 2006;65(5):1397–1403 [DOI] [PubMed] [Google Scholar]
- 40. Baxter NN, Virnig BA, Durham SB, Tuttle TM. Trend in the treatment of ducal carcinoma in situ of the breast. J Natl Cancer Inst. 2004;96(6):443–448 [DOI] [PubMed] [Google Scholar]
- 41. Silverstein MJ, Lagios MD. Choosing treatment for patients with ductal carcinoma in situ: fine tuning the University of Southern California/Van Nuys Prognostic Index. J Natl Cancer Inst Monogr. 2010;2010 (41):193–196. [DOI] [PMC free article] [PubMed] [Google Scholar]