

Abstract
Prostate-specific antigen (PSA) screening for prostate cancer may reduce mortality, but it incurs considerable risk of overdiagnosis and potential harm to quality of life. Our objective was to evaluate the cost-effectiveness of PSA screening, with and without adjustment for quality of life, for the British Columbia (BC) population. We adapted an existing natural history model using BC incidence, treatment, cost and mortality patterns. The modeled mortality benefit of screening derives from a stage-shift mechanism, assuming mortality reduction consistent with the European Study of Randomized Screening for Prostate Cancer. The model projected outcomes for 40 year-old men under 14 combinations of screening ages and frequencies. Cost and utility estimates were explored with deterministic sensitivity analysis. The incremental cost-effectiveness of regular screening ranged from $36,300/LYG, for screening every four years from ages 55-69, to $588,300/LYG, for screening every two years from ages 40-74. The marginal benefits of increasing screening frequency to two years or starting screening at age 40 were small and came at significant cost. After utility adjustment, all screening strategies resulted in a loss of QALYs; however, this result was very sensitive to utility estimates. Plausible outcomes under a range of screening strategies inform discussion of prostate cancer screening policy in BC and similar jurisdictions. Screening may be cost-effective but the sensitivity of results to utility values suggests individual preferences for quality versus quantity of life should be a key consideration.
Keywords: prostate cancer, PSA testing, screening, cost-effectiveness
Introduction
Screening for prostate cancer with prostate specific antigen (PSA) testing has divided the medical community. The objective of screening is to reduce prostate cancer mortality by identifying and treating early disease before progression occurs, but the PSA test alone has low predictive value, giving rise to many false positive tests1-3. A further challenge is that prostate cancer is highly prevalent among older men and many cancers are low risk and will not cause death even if left untreated4. Both the UK National Screening Committee (UK NSC) and the US Preventive Services Task Force (USPSTF) recommend against routine prostate cancer screening, concluding that the harms associated with false positive tests, unnecessary biopsies, overdiagnosis, and overtreatment outweigh the potential mortality benefit from early detection5-7.
Two large clinical trials have produced conflicting results with respect to the effect of PSA screening on prostate cancer mortality8, 9. The Prostate, Lung, Colorectal and Ovarian (PLCO) cancer screening trial, which offered annual screening for six years to men 55-74 years old, found no reduction in mortality after 13 years of follow-up8; however, the trial has been criticized for high PSA testing rates in the control arm and inconsistent follow-up of men with abnormal PSA tests10-12. The European Randomized Study of Screening for Prostate Cancer (ERSPC) found a 21% reduction in prostate cancer mortality in the screened group (RR 0.79, 95% CI: 0.68-0.91) after 11 years of follow-up9.
Studies evaluating the cost-effectiveness of PSA screening have produced a wide range of results. A recent study estimated that screening cost US$262,758 per life-year gained (LYG), or over $5 million per death avoided13. A systematic review reported cost-effectiveness in the range of US$12,000/LYG to US$65,000/LYG, with screening being more cost-effective in men aged 50-69 years than in men over 70 years14. Krahn et al reported a range of $113,000/LYG to $729,000/LYG, but after utility adjustment all screening strategies showed a net loss in quality-adjusted life years (QALYs)15.
Given these varied and conflicting results, our objective was to evaluate the cost-effectiveness of PSA screening strategies in British Columbia (BC), Canada. Cost-effectiveness, expressed as cost per LYG, and cost-utility, expressed as cost per QALY, were the outcomes of interest.
Methods
We developed 14 screening strategies for analysis, with varying age ranges and frequency. Four minimal screening strategies were included, with single screens at age 50 years, 60 years, or 70 years, or a screen at age 60 years followed by a second screen at age 65 years for men with PSA levels above the median. Most strategies had screening every 2 or 4 years, including one strategy with an adaptive screening frequency, where men with PSA levels above the median for their age are screened again in two years and the rest return in four years. Two strategies used an age-based PSA threshold, where men 70 years and older are subject to a positive PSA test threshold of 4.0 ng/ml, rather than base case of 3.0 ng/ml. A screening strategy representing the core group of the ERSPC trial – screening every 4 years, from ages 55 to 69 years – was also included. We evaluated these strategies using a microsimulation model of prostate cancer, developed at the Fred Hutchinson Cancer Research Centre (FHCRC) and adapted to the BC setting.
FHCRC model
The foundation of the FHCRC model is a natural history model of prostate cancer, with PSA growth (on the logarithmic scale) proportional to age and cancer growth proportional to PSA1, 16. To reproduce the effect of PSA testing on prostate cancer incidence, simulated PSA screening histories17 and observed biopsy compliance rates18 were applied to the model to identify men with screen-detected cancers. Prostate cancer incidence from the model was calibrated to data from US Surveillance, Epidemiology, and End Results (SEER) by age, stage and grade for ages 50-84 years in 1975-200019.
Prostate cancer survival was modeled by applying treatment effects for the six treatment options in the model: radical prostatectomy, radiotherapy, and conservative management, each with or without androgen deprivation therapy (ADT). The effect of PSA screening on prostate cancer mortality was incorporated using a stage shift mechanism, where a number of cancers that would have been diagnosed at a distant stage in the absence of screening are screen-detected and diagnosed at the locoregional stage, and consequently experience improved survival. This mechanism for the prostate cancer mortality reduction associated with screening is consistent with ERSPC results9, 20, 21. The model has been extensively validated with population incidence data and other natural history models 19, 22, 23. Analysis of BC incidence data demonstrated that the FHCRC natural history model, when combined with plausible assumptions about pre-PSA detection patterns and screening dissemination in BC, could successfully reproduce historical prostate cancer incidence and mortality. However, natural history parameters estimated for the US setting were used in this analysis (see supplementary material for further information). Parameters for treatment distribution and cost were based on observed BC data.
Costs
Costs used in the model are outlined in Table 1. The cost of a PSA test was provided by a local laboratory services provider. The cost of a biopsy was estimated using the average prostate biopsy case cost for Ontario24 combined with professional costs for BC25.
Table 1.
Model cost and utility parameters
| MODEL PARAMETER | ESTIMATE |
|---|---|
| Screening costs | Unit cost |
| PSA test | $30 |
| Biopsy | $880 |
| Prostate cancer costs | Mean cost |
|---|---|
| Local-regional disease: | |
| Conservative management | $1,200 |
| Radical prostatectomy | $11,600 |
| Radiotherapy | $12,500 |
| Androgen deprivation therapy | $3,600 |
| Distant disease | $7,400 |
| End-of-life care | $9,600 |
| Health State | Utility | Range* |
|---|---|---|
| Healthy/Screening | 1.0 | Not varied |
| Short-term treatment effects | 0.88 | 0.861-0.919 |
| Long-term treatment effects | 0.90 | 0.879-0.926 |
| Untreated symptomatic disease | 0.90 | 0.879-0.926 |
| Distant disease | 0.85 | 0.845-0.855 |
| End of life | 0.50 | 0.42-0.58 |
With the exception of the End of Life health state, ranges for sensitivity analysis were 95% confidence limits calculated by sampling from beta distributions generated from published mean and standard deviation values.
For all men diagnosed with prostate cancer at any stage, we applied a fixed cost to account for urologist consults and other diagnostic tests, excluding biopsy25, 26. We calculated the mean cost of radical prostatectomy, radiotherapy, and ADT, by age and stage, for the first year following diagnosis using BC Cancer Agency treatment records for 2004-2008 combined with unit cost estimates24, 25 and actual cost, where available. For end-of-life costs, we calculated the cost of all systemic therapy and radiotherapy received in the last year of life for men who died of prostate cancer and added an estimate of other end-of-life prostate cancer costs, including hospitalization, physician services, and long-term care27.
Utilities
Utility is a broad measure of health and is expressed as a weight (on a scale of 0 to 1) representing the preferences individuals have for a particular health state or set of symptoms. Time spent in a given health state can be adjusted for quality of life by multiplying by the appropriate utility value, giving quality-adjusted life-years (QALY)28.
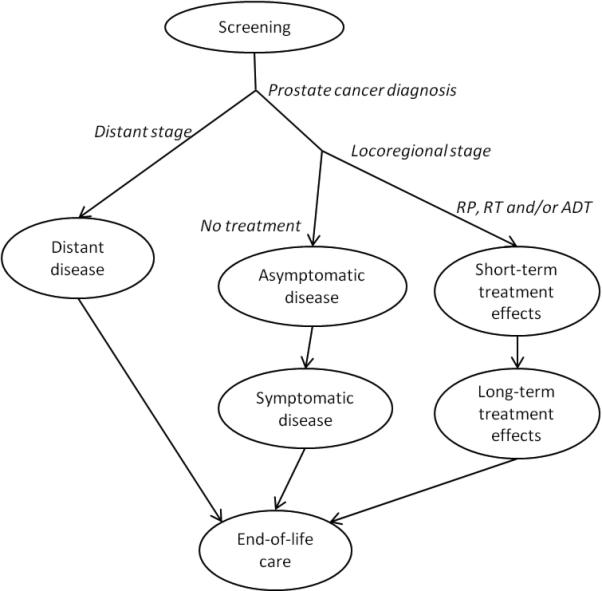
In the model, time in each health state shown in Figure 1 is counted until transition out or death from any cause other than prostate cancer. The negative effects of prostate cancer treatment, specifically bowel, urinary, and sexual dysfunction, have been found to persist over the long term29, 30. The health state utilities are shown in Table 131-33. Standard gamble utility values for short- and long-term treatment effects31 were weighted for the treatment distribution in the model. The value for untreated symptomatic locoregional disease was estimated to be the same as for long-term treatment effects. With the exception of the end-of-life state, where we used the range reported by Earle et al for late metastatic disease33, we calculated the 95% confidence limits for use in sensitivity analysis by sampling from beta distributions generated using the published mean and standard deviation34.
Figure 1.
Analysis
We simulated a cohort of men aged 40 years in the year 2000, projecting forward 50 years to age 90. Our outcomes of interest were incremental cost-effectiveness, expressed as cost per LYG, and cost-utility, expressed as cost per QALY gained. Incremental cost-effectiveness ratios (ICERs) were calculated to compare screening strategies28. The ICER describes the marginal cost of one strategy over another, relative to the marginal change in effectiveness:
The sequence of strategies, from lowest cost to highest, that gives the lowest ICER values forms the cost-effectiveness frontier. All other strategies are said to be dominated by the strategies on the frontier, because the strategies on the frontier have relatively lower cost and/or higher effectiveness28.
Our analysis is from the perspective of the BC health system, and costs are expressed in 2010 Canadian dollars. Costs and benefits were discounted at 3.5% per year, with sensitivity analysis at 6% and 0%35. We conducted sensitivity analysis for cost by varying screening and biopsy costs by 25% and by varying treatment costs by 25%. To explore sensitivity to utilities we created best- and worst-case scenarios: in the best case, we used the upper 95% confidence limit of the mean for locoregional disease states and the lower 95% confidence limit for distant disease and end-of-life states to maximize the potential effect. The opposite was done for the worst-case scenario.
Results
Simulated per capita costs ranged from $438 with no screening to $1,445 with biennial screening beginning at age 40 years (Table 2). Cost-effectiveness values, relative to no screening, were between $27,000 and $54,000/LYG. Biennial screening from age 40-74 years was the most effective strategy but was also the least cost-effective strategy on the cost-effectiveness frontier, with an ICER of $588,300/LYG. Other strategies on the cost-effectiveness frontier were a single screen at age 60 years, screening every 4 years from 55-69 years, screening every 4 years from 50-74 years with an elevated PSA threshold for men over 70 years, and adaptive screening from 50-74 years (Figure 2). Isolating the effect of starting age, ending age (including the age-based threshold), and screening frequency (Table 3) indicates that moving from adaptive screening to biennial screening, and from screening starting at age 50 to starting at age 40 are relatively cost-ineffective.
Table 2.
Cost-utility and cost-effectiveness of PSA screening strategies, and sensitivity analysis for best and worst case utility values
| With utility adjustment |
|||||||||||||
|---|---|---|---|---|---|---|---|---|---|---|---|---|---|
| Screening strategy name |
Age range (years) |
Interval | PSA threshold (ng/mL) |
Mortality reduction4 (%) |
Over- diagnosis5 (%) |
Cost | Life- years gained (LYG)6 |
Cost- effectiveness ($/LYG)6 |
ICER ($/LYG) |
Base case | Worst case8 |
Best case8 | |
| QALY6 | QALY | QALY | ICER ($/QALY) |
||||||||||
| No screening | -- | -- | -- | -- | -- | $438 | -- | -- | -- | -- | -- | -- | -- |
| 50(1) | 50 | single test | 3.0 | 0.4 | 0.06 | $469 | 0.0009 | $35,000 | dominated7 | −0.0004 | −0.0006 | −0.0003 | dominated7 |
| 60(1) | 60 | single test | 3.0 | 4.1 | 1.9 | $559 | 0.0045 | $27,000 | $27,000 | −0.0015 | −0.0027 | 0.0000 | dominated |
| 70(1) | 70 | single test | 3.0 | 6.1 | 7.1 | $571 | 0.0034 | $39,500 | dominated | −0.0012 | −0.0023 | 0.0001 | dominated |
| 60(1),65(A) | 60,65 | adaptive, two tests1 | 3.0 | 8.3 | 5.1 | $677 | 0.0077 | $31,200 | dominated | −0.0026 | −0.0050 | 0.0007 | $340,300 |
| 55(4)69 | 55-69 | 4 years | 3.0 | 12.4 | 8.4 | $820 | 0.0117 | $32,700 | $36,300 | −0.0043 | −0.0077 | 0.0002 | dominated |
| 50(4)74,4.0 | 50-74 | 4 years | 3.0, 4.02 | 14.7 | 10.7 | $909 | 0.0134 | $35,100 | $51,000 | −0.0040 | −0.0081 | 0.0013 | $371,100 |
| 50(4)74 | 50-74 | 4 years | 3.0 | 18.2 | 17.2 | $1,013 | 0.0148 | $38,800 | dominated | −0.0060 | −0.0106 | 0.0000 | dominated |
| 60(2)74 | 60-74 | 2 years | 3.0 | 21.1 | 20.7 | $1,152 | 0.0151 | $47,200 | dominated | −0.0103 | −0.0159 | −0.0031 | dominated |
| 50(2)69 | 50-69 | 2 years | 3.0 | 18.5 | 14.9 | $1,166 | 0.0166 | $43,800 | dominated | −0.0093 | −0.0149 | −0.0021 | dominated |
| 55(2)74 | 55-74 | 2 years | 3.0 | 21.2 | 19.4 | $1,209 | 0.0170 | $45,400 | dominated | −0.0105 | −0.0165 | −0.0028 | dominated |
| 50(2)74,4.0 | 50-74 | 2 years | 3.0, 4.02 | 20.0 | 16.1 | $1,216 | 0.0172 | $45,100 | dominated | −0.0067 | −0.0125 | 0.0007 | dominated |
| 50(A)74 | 50-74 | adaptive3 | 3.0 | 22.5 | 21.0 | $1,256 | 0.0184 | $44,600 | $70,500 | −0.0104 | −0.0169 | −0.0022 | dominated |
| 50(2)74 | 50-74 | 2 years | 3.0 | 22.6 | 21.0 | $1,309 | 0.0184 | $47,300 | dominated | −0.0104 | −0.0168 | −0.0021 | dominated |
| 40(2)74 | 40-74 | 2 years | 3.0 | 23.1 | 21.9 | $1,445 | 0.0187 | $54,000 | $588,300 | −0.0096 | −0.0162 | −0.0011 | dominated |
Abbreviations: LYG, life-years gained; ICER, incremental cost-effectiveness ratio; QALY, quality-adjusted life-years
All men are tested at age 60 years; men with PSA above the median are screened again at age 65 years.
Threshold of 3.0 ng/ml up to age 69 years, and 4.0 ng/mL for men ≥70 yrs
Men with PSA above the median (by age) are screened again in 2 years, all others screened again in 4 years
Prostate cancer mortality reduction relative to no screening; absolute mortality reduction is available in the supplementary material.
Overdiagnosis expressed as percent of all diagnosed prostate cancer cases; absolute diagnosis and overdiagnosis rates are available in the supplementary material.
Expressed as gains/losses relative to no screening
Dominated strategies are less cost-effective (i.e., they are less effective or have a higher ICER) than the next screening strategy in the table
In the worst case scenario, for distant disease and end of life health states the upper limit of utility values are used, and for all local-regional disease states the lower limit is used; the best case scenario is the opposite.
Figure 2.
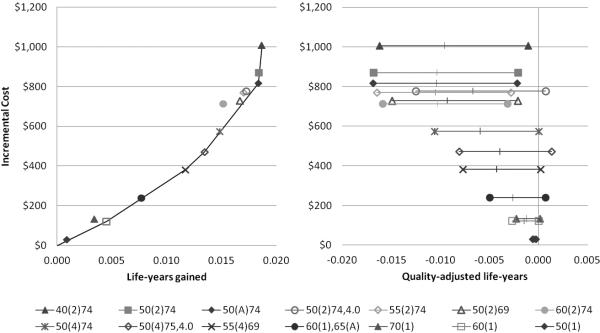
Table 3.
Effect of starting age, ending age and PSA threshold, and frequency on cost-effectiveness
| Screening strategy | ICER ($/LYG) |
|---|---|
| Decreasing starting age | |
| 60(2)74 | -- |
| 55(2)74 | $27,600 |
| 50(2)74 | $80,900 |
| 40(2)74 | $494,000 |
|
Increasing ending age & threshold | |
| 50(2)69 | -- |
| 50(2)74,4.0 | dominated* |
| 50(2)74 | $48,100 |
| Increasing frequency | |
| 50(4)74 | -- |
| 50(A)74 | $68,500 |
| 50(2)74 | $1,150,000 |
Abbreviations: LYG, life-years gained; ICER, incremental cost-effectiveness ratio; see Table 2 for full screening strategy descriptions
Dominated strategies have a higher ICER (i.e., they are less cost-effective) than the next most effective strategy
After utility adjustment, all screening strategies, regardless of age range or frequency, resulted in a loss of QALYs. Higher frequency screening strategies in older men resulted in the largest QALY losses: biennial screening from 60-, 55-, and 50-74 years, and the adaptive screening strategy all resulted in losses of over 0.01 QALYs. In sensitivity analysis for utility (Table 2 and Figure 2), the worst-case scenario resulted in a loss of over 0.015 QALYs for most screening strategies; however, in the best-case scenario, five strategies resulted in QALY gains. The most effective screening strategy was screening every 4 years from age 50-74 years with a PSA threshold of 4.0 ng/mL for men over 70 years, giving an additional 0.0013 QALYs over no screening. This strategy and a single screen at age 60 years, followed by a screen at age 65 years for men with PSA above the median, were the two most cost-effective strategies in the best-case scenario, but both ICERS were over $300,000/QALY.
In the sensitivity analysis for cost varying screening and treatment costs independently has little effect on overall costs and cost-effectiveness (Table 4). The results are sensitive to discounting, with higher discount rates giving higher ICERs.
Table 4.
Sensitivity analysis for screening cost, treatment costs, and discount rate, for screening strategies on the cost-effectiveness frontier
| Screening strategy | Screening costs (−25%, +25%) | Treatment costs (−25%, +25%) | Discount rate (0%, 6%) | ||||
|---|---|---|---|---|---|---|---|
| Cost range* | ICER range ($/LYG) | Cost range* | ICER range ($/LYG) | Cost range* | LYG range | ICER range ($/LYG) | |
| No screen | $438-$438 | - | $328-$547 | - | $1268-$221 | - | - |
| 60(1) | $550-$569 | $24,900-$29,200 | $429-$690 | $22,400-$31,700 | $1494-$300 | 0.0154-0.0020 | $14,700-$39,800 |
| 60(1),65(A) | $659-$696 | dominated†-$39,700 | $526-$828 | $30,500-dominated | $1748-$369 | 0.0274-0.0033 | $21,200-dominated |
| 55(4)69 | $783-$857 | $32,500-$40,300 | $652-$989 | $31,400-$41,500 | $2042-$458 | 0.0411-0.0051 | $21,400-$51,200 |
| 50(4)75,4.0 | $858-$960 | $43,000-$59,100 | $732-$1086 | $46,300-$55,700 | $2241-$512 | 0.0474-0.0058 | $31,800-$71,400 |
| 50(A)74 | $1161-$1350 | $61,600-$79,400 | $1036-$1475 | $61,800-$79,200 | $3076-$705 | 0.0663-0.0078 | $44,300-$96,400 |
| 40(2)74 | $1305-$1585 | $447,400-$729,100 | $1224-$1666 | $582,100-$594,500 | $3385-$855 | 0.0674-0.0080 | $275,000-$980,900 |
Abbreviations: LYG, life-years gained; ICER, incremental cost-effectiveness ratio; see Table 2 for full screening strategy descriptions
Range of total costs (including screening and treatment) resulting from sensitivity analysis
Dominated strategies have a higher ICER (i.e., they are less cost-effective) than the next most effective strategy
With regular screening every 2 to 4 years, the model projected prostate cancer mortality reductions ranging from 12.4%, for screening every 4 years from 55 to 69 years, to 23.1%, for biennial screening from 40 to 74 years (Table 2). Overdiagnosis, expressed as a percent of all prostate cancers, ranged from 8.4% to 21.9% for those same strategies. The ratio of overdiagnoses to prostate cancer deaths avoided was lowest for the 55(4)69 strategy, at 3.0 (Supplementary material). Screening beyond age 70 or with increased frequency greatly increased overdiagnosis. Of the minimal screening strategies, a single screen at age 60 years followed by a second test at age 65 years for those above the median provided the greatest mortality reduction, 8.1%, with overdiagnosis of 5.1% (Table 2). Additional outcomes, including number of cancers detected, overdiagnosed cases, prostate cancer deaths avoided, false positives, and biopsies, are provided in the supplementary material.
Discussion
If we consider results without utility adjustment, a number of PSA screening strategies may be cost-effective, depending on willingness-to-pay thresholds. At a threshold of $50,000/LYG, screening every four years from age 55 to 69 years would be considered cost-effective, and at a threshold of $80,000/LYG the adaptive screening strategy would be cost-effective. The marginal benefit from starting screening at age 40 years, or from screening biennially is small; regular screening with lower frequency confers the greatest mortality benefit relative to cost. A recent estimate of the cost-effectiveness of PSA screening, based on an extrapolation of ERSPC results, was $262,758/LYG13 – much higher than our results reported here. The reasons for this difference are twofold: the authors use unadjusted ERSPC results in their model, which likely underestimates effectiveness over the longer term20, and the authors use much higher prostate cancer treatment costs than we observe in Canadian settings27.
Relative to no screening, cost-effectiveness values were all under $54,000/LYG, but these results should be interpreted cautiously. The simulated no screening strategy acts as a counterfactual for this analysis and does not necessarily reflect current experience, where men have widespread access to screening despite the absence of organized programs. Marginal analysis using incremental cost-effectiveness ratios (ICERs) is a better tool for decision-making. ICERs take into account differences in cost and effectiveness across strategies, reflecting the fact that decision-makers in this situation must choose between many competing alternatives28.
After utility adjustment, all PSA screening strategies, regardless of intensity, resulted in a loss of QALYs. These findings support the conclusions of the USPSTF and the UK NSC5, 6, that the detriment to quality of life exceeds the benefits of reduced prostate cancer mortality, but this result was sensitive to utility estimates. Recently Heijnsdijk et al. simulated PSA testing for men 55-69 years old and reported that 0.056 QALYs were gained with annual screening36; however, the utility values for long-term treatment effects used in the model were much higher than those used here, and the values for palliative care and metastatic disease were much lower, due to differences in the data sources used. The values in our base case most closely resemble the authors’ ‘unfavourable’ sensitivity analysis scenario, which resulted in a loss of 0.021 QALYs36. The authors also did not discount future utility; we provide comparable undiscounted results in the supplementary material. It is clear from these models that the cost-effectiveness of PSA screening is highly dependent on the utility weights and health states used, due to the small mortality benefit of screening and the large impact of overtreatment and earlier treatment on quality of life.
In sensitivity analysis using results unadjusted for quality of life, we found that varying screening or treatment costs had little effect. A limitation of our analysis is that, due to the current model structure, we were unable to explore the effect of varying mortality reduction on cost-effectiveness. Reducing the effectiveness of screening would increase the ICER values, and other modeling work by the FHCRC group suggests that the position of the screening strategies relative to each other may be largely unchanged21, but the magnitude of the effect is unknown at this time.
Overdiagnosed cases, defined as prostate cancer cases detected on screening that would not have been clinically diagnosed in a patient's lifetime, made up 8.4% to 21.9% of all cancer diagnoses in our simulations of regular screening (every 2-4 years). The ERSPC reported the relative risk of cancer diagnosis in core screening group of 1.63; that is, 38.5% of cancers in the screening arm were potentially overdiagnosed cases based on the observed excess incidence9. The reasons for the lower overdiagnosis in the simulated screening strategies are due to differences in study design and population. First, following the initiation of screening, excess incidence is made up of both overdiagnosed cases and non-overdiagnosed cases detected from the collection of prevalent cancers37. With lead times for prostate cancer estimated at 5.4-6.9 years22 and only 11 years of follow-up in the ERSPC, it is likely that the reported excess incidence is an overestimate of true overdiagnosis. Second, differences between the ERSPC study population and the simulated population contribute to the differences in overdiagnosis. The MISCAN (microsimulation screening analysis) model constructed using ERSPC Rotterdam parameters and population data from the Netherlands estimated overdiagnosis as a percent of all prostate cancers at 49.9%; calibrating the model to US SEER incidence estimated overdiagnosis at only 18.6%22. This difference has largely been attributed to higher biopsy compliance at ERSPC study sites than would be expected in general practice, leading to increased screening sensitivity and increased overdiagnosis22, 37. The MISCAN model and the FHCRC model are two of three models that were developed independently using common data sources through the Cancer Intervention and Surveillance Modeling Network. Overdiagnosis among US men aged 50-84 years in 1985-2000 as predicted by the FHCRC model (11.9% of all prostate cancers diagnosed) was within the range of other two models (8.6% and 18.6%)22.
A challenge we faced in this analysis is that little information is available about current screening practices in BC. PSA tests for asymptomatic men are not covered through the provincial insurance plan and therefore data are not routinely collected. Cross-sectional data from the Canadian Community Health Survey indicate that in 2003 approximately 18% of men aged 40-49 and 50% of men aged 50-74 years in BC reported having had received a PSA test38. Of those, over 50% reported having been tested in the last year38. From this we can infer that a potentially large proportion of men are being tested at a frequency that is not cost-effective. Reducing the screening rate in this population may help to mitigate the detrimental effect of overdiagnosis on quality of life, while also improving the cost-effectiveness of health services provided.
The sharply contrasting results between the analyses with and without adjustment for quality of life suggest that the screening decision is not straightforward and is sensitive to utility weights. Published utilities vary widely due to the measurement methods used, the specific health states considered, and the target populations. There is also significant heterogeneity between individuals’ utility values. In our model, we used mean utilities that were elicited from prostate cancer patients using the standard gamble method31, 32. While the method itself is robust, using mean estimates does not reflect the heterogeneity in the population. Men may make different screening decisions depending on how they value the potential health outcomes and the relative importance they place on quality versus quantity of life. The use of decision support tools has been shown to successfully help men understand the potential consequences of PSA screening and make informed decisions that align with their values39-41.
In addition to improving the quality of individuals’ decision-making, there may also be ways to mitigate the harms that arise as a consequence of screening. Introducing age-based PSA thresholds could reduce the potential for harm to men who undergo screening. We found that with utility adjustment, the two strategies with the elevated PSA threshold of 4.0 ng/mL for men over 70 performed relatively well compared to the other screening strategies, and the strategy with screening every 4 years with the age-based threshold gave the largest QALY gain in sensitivity analysis. Another critical option is wider adoption of active surveillance (AS) for low-risk disease, where men defer radical interventions and only receive treatment if subsequent PSA tests, digital rectal exams, and biopsies show evidence of progression. AS has been found to successfully delay or prevent radical treatment without increasing prostate cancer mortality42-44 and may also be cost-saving due to treatments avoided45. With an estimated 30-50% of patients eligible for AS46, the adverse effects related to radical treatment may be markedly reduced with increased AS uptake. Work is ongoing to incorporate AS into the FHCRC prostate cancer model47.
The FHCRC model is built on high-quality data and has been extensively validated against population data and other natural history models20, 22, 23, but it may not fully represent our experience in Canada and BC. However, prostate cancer mortality in the US and Canada is very similar48, and differences in incidence are likely due to differences in PSA testing rates and non-screen diagnostic intensity, and not to differences in the natural history of disease. By using local treatment distribution, resource use, and cost data, we are confident that this analysis reflects local practice.
Our results demonstrate that screening for prostate cancer with low frequency PSA testing may be cost-effective when quality of life is not considered, but all screening has a net negative effect on QALYs. The sensitivity of these results to utility adjustment is an important finding, suggesting that men's preferences for quality or quantity of life should directly inform their decision to be screened. Further work to investigate options that mitigate the harms of overdiagnosis and overtreatment would be of significant value.
Supplementary Material
Statement of novelty and impact.
Screening for prostate cancer with prostate-specific antigen tests has divided the medical community, and presents significant challenges to policy-makers. This study is the first to evaluate the cost-effectiveness of prostate cancer screening using recent clinical effectiveness data in an extensively-validated individual-level microsimulation model. We report that prostate cancer screening is likely cost-effective, but is highly sensitive to weighting for quality of life, supporting the development of evidence-based and preference-sensitive screening guidelines.
Acknowledgements
The Canadian Centre for Applied Research in Cancer Control is funded by the Canadian Cancer Society Research Institute. RG and RE were supported by Award Numbers R01 CA131874 and U01 CA88160 from the National Cancer Institute and Award Number U01 CA157224 from the National Cancer Institute and the Centers for Disease Control and Prevention. The content is solely the responsibility of the authors and does not necessarily represent the official views of the National Cancer Institute, the National Institutes of Health, or the Centers for Disease Control and Prevention.
Abbreviations
- ADT
androgen deprivation therapy
- BC
British Columbia
- ERSPC
European Randomized Study of Screening for Prostate Cancer
- FHCRC
Fred Hutchinson Cancer Research Center
- ICER
incremental cost-effectiveness ratio
- LYG
life-year gained
- PLCO
Prostate, Lung, Colorectal and Ovarian Cancer Screening Trial
- PSA
prostate-specific antigen
- QALY
quality-adjusted life-year
- UK NSC
United Kingdom National Screening Committee
- USPSTF
United States Preventive Services Task Force
References
- 1.Thompson IM, Ankerst DP, Chi C, Goodman PJ, Tangen CM, Lucia MS, Feng Z, Parnes HL, Coltman CA. Assessing Prostate Cancer Risk: Results from the Prostate Cancer Prevention Trial. Journal of the National Cancer Institute. 2006;98:529–34. doi: 10.1093/jnci/djj131. [DOI] [PubMed] [Google Scholar]
- 2.Vickers AJ, Cronin AM, Roobol MJ, Hugosson J, Jones JS, Kattan MW, Klein E, Hamdy F, Neal D, Donovan J, Parekh DJ, Ankerst D, et al. The Relationship between Prostate-Specific Antigen and Prostate Cancer Risk: The Prostate Biopsy Collaborative Group. Clinical Cancer Research. 2010;16:4374–81. doi: 10.1158/1078-0432.CCR-10-1328. [DOI] [PMC free article] [PubMed] [Google Scholar]
- 3.Holmström B, Johansson M, Bergh A, Stenman U-H, Hallmans G, Stattin P. Prostate specific antigen for early detection of prostate cancer: longitudinal study. BMJ. 2009;339:b3537. doi: 10.1136/bmj.b3537. [DOI] [PMC free article] [PubMed] [Google Scholar]
- 4.Wilt TJ, Brawer MK, Jones KM, Barry MJ, Aronson WJ, Fox S, Gingrich JR, Wei JT, Gilhooly P, Grob BM, Nsouli I, Iyer P, et al. Radical Prostatectomy versus Observation for Localized Prostate Cancer. New England Journal of Medicine. 2012;367:203–13. doi: 10.1056/NEJMoa1113162. [DOI] [PMC free article] [PubMed] [Google Scholar]
- 5.Mackie A. Screening for Prostate Cancer: Review against programme appraisal criteria for the UK National Screening Committee. 2010 [Google Scholar]
- 6.U.S. Preventive Services Task Force Screening for Prostate Cancer: U.S. Preventive Services Task Force Recommendation Statement. Annals of Internal Medicine. 2008;149:185–91. doi: 10.7326/0003-4819-149-3-200808050-00008. [DOI] [PubMed] [Google Scholar]
- 7.Chou R, Croswell JM, Dana T, Bougatsos C, Blazina I, Fu R, Gleitsmann K, Koenig HC, Lam C, Maltz A, Rugge JB, Lin K. Screening for Prostate Cancer: A Review of the Evidence for the U.S. Preventive Services Task Force. Annals of Internal Medicine. 2011;155:762–71. doi: 10.7326/0003-4819-155-11-201112060-00375. [DOI] [PubMed] [Google Scholar]
- 8.Andriole GL, Crawford ED, Grubb RL, Buys SS, Chia D, Church TR, Fouad MN, Isaacs C, Kvale PA, Reding DJ, Weissfeld JL, Yokochi LA, et al. Prostate Cancer Screening in the Randomized Prostate, Lung, Colorectal, and Ovarian Cancer Screening Trial: Mortality Results after 13 Years of Follow-up. Journal of the National Cancer Institute. 2012;104:125–32. doi: 10.1093/jnci/djr500. [DOI] [PMC free article] [PubMed] [Google Scholar]
- 9.Schröder FH, Hugosson J, Roobol MJ, Tammela TLJ, Ciatto S, Nelen V, Kwiatkowski M, Lujan M, Lilja H, Zappa M, Denis LJ, Recker F, et al. Prostate-Cancer Mortality at 11 Years of Follow-up. New England Journal of Medicine. 2012;366:981–90. doi: 10.1056/NEJMoa1113135. [DOI] [PMC free article] [PubMed] [Google Scholar]
- 10.Barry MJ. Screening for Prostate Cancer — The Controversy That Refuses to Die. New England Journal of Medicine. 2009;360:1351–54. doi: 10.1056/NEJMe0901166. [DOI] [PubMed] [Google Scholar]
- 11.La Rochelle J, Amling C. Prostate Cancer Screening: What We Have Learned from the PLCO and ERSPC Trials. Current Urology Reports. 2010;11:198–201. doi: 10.1007/s11934-010-0109-5. [DOI] [PubMed] [Google Scholar]
- 12.Pinsky PF, Black A, Kramer BS, Miller A, Prorok PC, Berg C. Assessing contamination and compliance in the prostate component of the Prostate, Lung, Colorectal, and Ovarian (PLCO) Cancer Screening Trial. Clinical Trials. 2010;7:303–11. doi: 10.1177/1740774510374091. [DOI] [PubMed] [Google Scholar]
- 13.Shteynshlyuger A, Andriole GL. Cost-Effectiveness of Prostate Specific Antigen Screening in the United States: Extrapolating from the European Study of Screening for Prostate Cancer. The Journal of Urology. 2011;185:828–32. doi: 10.1016/j.juro.2010.10.079. [DOI] [PubMed] [Google Scholar]
- 14.Imamura T, Yasunaga H. Economic evaluation of prostate cancer screening with prostate- specific antigen. International Journal of Urology. 2008;15:285–88. doi: 10.1111/j.1442-2042.2008.02013.x. [DOI] [PubMed] [Google Scholar]
- 15.Krahn MD, Mahoney JE, Eckman MH, Trachtenberg J, Pauker SG, Detsky AS. Screening for Prostate Cancer. JAMA: The Journal of the American Medical Association. 1994;272:773–80. [PubMed] [Google Scholar]
- 16.Inoue LYT, Etzioni R, Morrell C, Müller P. Modeling Disease Progression With Longitudinal Markers. Journal of the American Statistical Association. 2008;103:259–70. doi: 10.1198/016214507000000356. [DOI] [PMC free article] [PubMed] [Google Scholar]
- 17.Mariotto AB, Etzioni R, Krapcho M, Feuer EJ. Reconstructing PSA testing patterns between black and white men in the US from Medicare claims and the National Health Interview Survey. Cancer. 2007;109:1877–86. doi: 10.1002/cncr.22607. [DOI] [PubMed] [Google Scholar]
- 18.Pinsky PF, Andriole GL, Kramer BS, Hayes RB, Prorok PC, Gohagan JK. Prostate biopsy following a positive screen in the prostate, lung, colorectal and ovarian cancer screening trial. The Journal of Urology. 2005;173:746–51. doi: 10.1097/01.ju.0000152697.25708.71. [DOI] [PubMed] [Google Scholar]
- 19.Gulati R, Inoue L, Katcher J, Hazelton W, Etzioni R. Calibrating disease progression models using population data: a critical precursor to policy development in cancer control. Biostatistics. 2010;11:707–19. doi: 10.1093/biostatistics/kxq036. [DOI] [PMC free article] [PubMed] [Google Scholar]
- 20.Gulati R, Mariotto AB, Chen S, Gore JL, Etzioni R. Long-term projections of the harm-benefit trade-off in prostate cancer screening are more favorable than previous short-term estimates. Journal of Clinical Epidemiology. 2011;64:1412–17. doi: 10.1016/j.jclinepi.2011.06.011. [DOI] [PMC free article] [PubMed] [Google Scholar]
- 21.Gulati R, Gore JL, Etzioni R. Comparative Effectiveness of Alternative Prostate-Specific Antigen–Based Prostate Cancer Screening StrategiesModel Estimates of Potential Benefits and Harms. Annals of Internal Medicine. 2013;158:145–53. doi: 10.7326/0003-4819-158-3-201302050-00003. [DOI] [PMC free article] [PubMed] [Google Scholar]
- 22.Draisma G, Etzioni R, Tsodikov A, Mariotto A, Wever E, Gulati R, Feuer E, de Koning H. Lead Time and Overdiagnosis in Prostate-Specific Antigen Screening: Importance of Methods and Context. Journal of the National Cancer Institute. 2009;101:374–83. doi: 10.1093/jnci/djp001. [DOI] [PMC free article] [PubMed] [Google Scholar]
- 23.Gulati R, Wever EM, Tsodikov A, Penson DF, Inoue LYT, Katcher J, Lee S-Y, Heijnsdijk EAM, Draisma G, de Koning HJ, Etzioni R. What If I Don't Treat My PSA-Detected Prostate Cancer? Answers from Three Natural History Models. Cancer Epidemiology Biomarkers & Prevention. 2011;20:740–50. doi: 10.1158/1055-9965.EPI-10-0718. [DOI] [PMC free article] [PubMed] [Google Scholar]
- 24.Ontario Case Costing Initiative. Costing Analysis (CAT) Tool. 2011 [Google Scholar]
- 25.BC Medical Services Commission . Payment Schedule. Vol. 2011. Ministry of Health Services; 2011. [Google Scholar]
- 26.Finelli A, Pace KT, Sharir S, Schultz S, Gunraj N, Wilton AS, Przybysz R, Simunovic M, Urbach DR. Surgery for Prostate Cancer. In: Urbach D, Simunovic M, Schultz S, editors. Cancer Surgery in Ontario: ICES Atlas. Institute for Clinical Evaluative Sciences; Toronto: 2008. [Google Scholar]
- 27.Krahn MD, Zagorski B, Laporte A, Alibhai SMH, Bremner KE, Tomlinson G, Warde P, Naglie G. Healthcare costs associated with prostate cancer: estimates from a population-based study. BJU International. 2010;105:338–46. doi: 10.1111/j.1464-410X.2009.08758.x. [DOI] [PubMed] [Google Scholar]
- 28.Drummond MF, Sculpher MJ, Torrance GW, O'Brien BJ, Stoddart GL. Methods for the economic evaluation of health care programmes. 3rd ed. Oxford University Press; Oxford: 2005. [Google Scholar]
- 29.Smith DP, King MT, Egger S, Berry MP, Stricker PD, Cozzi P, Ward J, O'Connell DL, Armstrong BK. Quality of life three years after diagnosis of localised prostate cancer: population based cohort study. BMJ. 2009;339:b4817. doi: 10.1136/bmj.b4817. [DOI] [PMC free article] [PubMed] [Google Scholar]
- 30.Johansson E, Bill-Axelson A, Holmberg L, Onelöv E, Johansson J-E, Steineck G. Time, Symptom Burden, Androgen Deprivation, and Self-Assessed Quality of Life after Radical Prostatectomy or Watchful Waiting: The Randomized Scandinavian Prostate Cancer Group Study Number 4 (SPCG-4) Clinical Trial. European Urology. 2009;55:422–32. doi: 10.1016/j.eururo.2008.08.054. [DOI] [PubMed] [Google Scholar]
- 31.Krahn MD, Bremner KE, Tomlinson G, Naglie G. Utility and health-related quality of life in prostate cancer patients 12 months after radical prostatectomy or radiation therapy. Prostate Cancer Prostatic Dis. 2009;12:361–68. doi: 10.1038/pcan.2009.32. [DOI] [PubMed] [Google Scholar]
- 32.Krahn M, Ritvo P, Irvine J, Tomlinson G, Bremner KE, Bezjak A, Trachtenberg J, Naglie G. Patient and Community Preferences for Outcomes in Prostate Cancer: Implications for Clinical Policy. Medical Care. 2003;41:153–64. doi: 10.1097/00005650-200301000-00017. [DOI] [PubMed] [Google Scholar]
- 33.Earle CC, Chapman RH, Baker CS, Bell CM, Stone PW, Sandberg EA, Neumann PJ. Systematic overview of cost-utility assessments in oncology. Journal of Clinical Oncology. 2000;18:3302–17. doi: 10.1200/JCO.2000.18.18.3302. [DOI] [PubMed] [Google Scholar]
- 34.Briggs A, Schulpher M, Claxton K. Decision modelling for health economic evaluationed. Oxford University Press; Oxford: 2006. [Google Scholar]
- 35.Guide to the methods of technology appraisal. National Institute for Health and Clinical Excellence; 2008. [PubMed] [Google Scholar]
- 36.Heijnsdijk EAM, Wever EM, Auvinen A, Hugosson J, Ciatto S, Nelen V, Kwiatkowski M, Villers A, Páez A, Moss SM, Zappa M, Tammela TLJ, et al. Quality-of-Life Effects of Prostate-Specific Antigen Screening. New England Journal of Medicine. 2012;367:595–605. doi: 10.1056/NEJMoa1201637. [DOI] [PMC free article] [PubMed] [Google Scholar]
- 37.Etzioni R, Gulati R, Mallinger L, Mandelblatt J. Influence of Study Features and Methods on Overdiagnosis Estimates in Breast and Prostate Cancer Screening. Annals of Internal Medicine. 2013;158:831–38. doi: 10.7326/0003-4819-158-11-201306040-00008. [DOI] [PMC free article] [PubMed] [Google Scholar]
- 38.Canadian Community Health Survey . User Guide for the Public Use Microdata File. Statistics Canada. Health Services Division; 2003. 2005. [Google Scholar]
- 39.Costanza ME, Luckmann RS, Rosal M, White MJ, LaPelle N, Partin M, Cranos C, Leung KG, Foley C. Helping men make an informed decision about prostate cancer screening: A pilot study of telephone counseling. Patient Education and Counseling. 2011;82:193–200. doi: 10.1016/j.pec.2010.05.011. [DOI] [PMC free article] [PubMed] [Google Scholar]
- 40.Evans R, Joseph-Williams N, Edwards A, Newcombe GR, Wright P, Kinnersley P, Griffiths J, Jones M, Williams J, Grol R, Elwyn G. Supporting Informed Decision Making for Prostate Specific Antigen (PSA) Testing on the Web: An Online Randomized Controlled Trial. J Med Internet Res. 2010;12:e27. doi: 10.2196/jmir.1305. [DOI] [PMC free article] [PubMed] [Google Scholar]
- 41.Frosch DL, Bhatnagar V, Tally S, Hamori CJ, Kaplan RM. Internet patient decision support: A randomized controlled trial comparing alternative approaches for men considering prostate cancer screening. Archives of Internal Medicine. 2008;168:363–69. doi: 10.1001/archinternmed.2007.111. [DOI] [PubMed] [Google Scholar]
- 42.Klotz L, Zhang L, Lam A, Nam R, Mamedov A, Loblaw A. Clinical Results of Long-Term Follow- Up of a Large, Active Surveillance Cohort With Localized Prostate Cancer. Journal of Clinical Oncology. 2009;28:126–31. doi: 10.1200/JCO.2009.24.2180. [DOI] [PubMed] [Google Scholar]
- 43.Tosoian JJ, Trock BJ, Landis P, Feng Z, Epstein JI, Partin AW, Walsh PC, Carter HB. Active Surveillance Program for Prostate Cancer: An Update of the Johns Hopkins Experience. Journal of Clinical Oncology. 2011;29:2185–90. doi: 10.1200/JCO.2010.32.8112. [DOI] [PubMed] [Google Scholar]
- 44.van den Bergh RCN, Roemeling S, Roobol MJ, Aus G, Hugosson J, Rannikko AS, Tammela TL, Bangma CH, Schröder FH. Outcomes of Men with Screen-Detected Prostate Cancer Eligible for Active Surveillance Who Were Managed Expectantly. European Urology. 2009;55:1–8. doi: 10.1016/j.eururo.2008.09.007. [DOI] [PubMed] [Google Scholar]
- 45.Keegan KA, Dall'Era MA, Durbin-Johnson B, Evans CP. Active surveillance for prostate cancer compared with immediate treatment. Cancer. 2011;118:3512–18. doi: 10.1002/cncr.26688. [DOI] [PMC free article] [PubMed] [Google Scholar]
- 46.Dall'Era MA, Albertsen PC, Bangma C, Carroll PR, Carter HB, Cooperberg MR, Freedland SJ, Klotz LH, Parker C, Soloway MS. Active Surveillance for Prostate Cancer: A Systematic Review of the Literature. European Urology. 2012;62:976–83. doi: 10.1016/j.eururo.2012.05.072. [DOI] [PubMed] [Google Scholar]
- 47.Xia J, Trock BJ, Cooperberg MR, Gulati R, Zeliadt SB, Gore JL, Lin DW, Carroll PR, Carter HB, Etzioni R. Prostate Cancer Mortality following Active Surveillance versus Immediate Radical Prostatectomy. Clinical Cancer Research. 2012;18:5471–78. doi: 10.1158/1078-0432.CCR-12-1502. [DOI] [PMC free article] [PubMed] [Google Scholar]
- 48.McDavid K, Lee J, Fulton JP, Tonita J, Thompson TD. Prostate cancer incidence and mortality rates and trends in the United States and Canada. Public Health Rep. 2004;119:174–86. doi: 10.1177/003335490411900211. [DOI] [PMC free article] [PubMed] [Google Scholar]
Associated Data
This section collects any data citations, data availability statements, or supplementary materials included in this article.