

Abstract
The precision of skilled forelimb movement has long been presumed to rely on rapid feedback corrections triggered by internally-directed copies of outgoing motor commands – but the functional relevance of inferred internal copy circuits has remained unclear. One class of spinal interneurons implicated in the control of mammalian forelimb movement, cervical propriospinal neurons (PNs), has the potential to convey an internal copy of pre-motor signals through dual innervation of forelimb-innervating motor neurons and pre-cerebellar neurons of the lateral reticular nucleus. We have examined whether the PN internal copy pathway functions in the control of goal-directed reaching. In mice, PNs include a genetically-accessible subpopulation of cervical V2a interneurons, and their targeted ablation perturbs reaching while leaving intact other elements of forelimb movement. Moreover, optogenetic activation of the PN internal copy branch recruits a rapid cerebellar feedback loop that modulates forelimb motor neuron activity and severely disrupts reaching kinematics. Our findings implicate V2a PNs as the focus of an internal copy pathway assigned to the rapid updating of motor output during reaching behavior.
Skilled forelimb movements constitute some of the more impressive accomplishments of the mammalian motor system1-3. Goal-directed reaching involves the activation of descending pathways that provide commands for task-appropriate motor programs4-6. Less clear is the issue of how such descending commands engage spinal circuits to achieve the modularity and precision evident in reach, grasp and object manipulation. One view holds that skilled motor performance requires continuous on-line refinement7-9, through internally-directed copies of motor commands that engage cerebellar circuits and permit rapid updating of motor output9-14. But putative internal copy pathways, by their nature, are closely interwoven with motor output circuits, a feature that has made it hard to isolate the neural substrate of such internal copies or to assess whether they do, in fact, influence motor performance.
One class of spinal interneuron, cervical propriospinal neurons (here referred to as PNs), has long been implicated in the control of forelimb behavior15,16. In cat and primate, PNs comprise excitatory and inhibitory neuronal subtypes that serve as intermediary relays for descending motor commands16,17. PNs are characterized by an ipsilateral bifurcated output: one axonal branch projects caudally to the cervical motor neurons that control forelimb muscles18,19, and the other projects rostrally to the lateral reticular nucleus (LRN)20, a pre-cerebellar relay21-24(Fig. 1a). In principle, the intriguing duality of PN axonal projections offers a simple anatomical substrate for the internal copying of pre-motor signals. In cat, severing the pre-motor axonal branch of PNs by lesioning the ventrolateral funiculus perturbs reaching but not grasping25, whereas silencing PN output in monkey perturbs both reaching and grasping26. Neither of these manipulations, however, has addressed the relevance of an internal copy branch for on-line refinement of motor output.
Figure 1. Identification of mouse PNs.
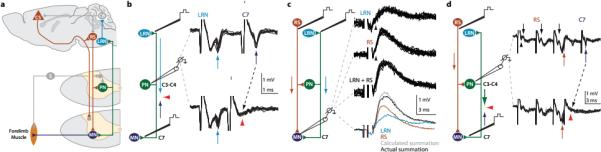
a, PNs receive direct and indirect supraspinal (corticospinal–CS; reticulospinal–RS) and sensory (S) input. PNs innervate cervical motor neurons (MN) and LRN neurons that project to cerebellum (CB). b, In vivo extracellular recordings (C3/C4) while stimulating LRN (20-100 μA) and C7 ventral horn (40 μA) revealed antidromic spikes (arrows) and collision (red arrowheads; n = 12). c, Intracellular MN recordings during LRN stimulation revealed monosynaptic EPSPs (100 μA; n = 29). LRN-induced EPSPs summate with monosynaptic EPSPs elicited by RS stimulation (100 μA; n = 34; arrowheads, EPSP onset). d, Extracellular PN recordings, identified via C7 (17 μA; blue arrows) and LRN stimulation (not shown), revealed monosynaptic spikes following RS stimulation (3 × 50 μA; red arrows; n = 14) and collision (red arrowheads; n = 17). See Supplementary Note 1.
In this study, we sought to define the contribution of excitatory PNs to skilled reach behavior in mice. We reasoned that their molecular delineation could provide a genetic means of eliminating PNs as well as manipulating their internal copy projections. We show that one major population of excitatory PNs belongs to the Chx10+ V2a interneuron (IN) class27-29 – one of the cardinal subtypes of ventral interneurons implicated in motor control30. Genetic elimination of cervical V2a INs elicits a reach-specific defect in forelimb movement, revealed by quantitative kinematics. Selective activation of the PN internal copy branch triggers a rapid cerebellar feedback loop that excites motor neurons and degrades forelimb movement. Our findings show that excitatory PNs establish an internal feedback circuit assigned to the control of mammalian skilled reaching.
Organization of PNs in mouse
To explore the existence and organization of excitatory PNs in mice we focused on two defining features: a bifurcating output to the LRN and forelimb-innervating motor neurons, and receipt of a direct input from reticulospinal (RS) neurons (Fig. 1a, Supplementary Note 1)16,17,19,20.
Extracellular recording from cervical spinal segments (C3, C4, C6) in adult anesthetized mice identified neurons that could be activated antidromically by microstimulation of the ipsilateral LRN as well as C7 segment ventral horn (Fig. 1b). Spike collision tests confirmed that individual neurons send axons to both targets (Fig. 1b; red arrowheads). To investigate the pre-motor output of PNs we recorded intracellularly from forelimb-innervating motor neurons. Stimulation of the LRN with the intent of antidromically activating PNs produced short-latency monosynaptic excitatory postsynaptic potentials (EPSPs) in motor neurons (Fig. 1c; mean latency from stimulation 1.24 [from volley 0.54] +/− 0.13 ms s.d.; mean within cell variance of EPSP onset 0.008 +/− 0.006 ms2 s.d.). LRN simulation elicited pure EPSPs in 76%, pure IPSPs in 16% and mixed responses in 8% of forelimb-innervating motor neurons (n = 38 neurons), indicating the predominance of excitatory PNs. Stimulation of the RS tract elicited short-latency monosynaptic motor neuron EPSPs31 that summed with EPSPs induced by LRN stimulation (Fig. 1c; mean latency from stimulation 1.18 [from volley 0.68] +/− 0.16 ms s.d.), indicating independent recruitment of PN and RS inputs (Supplementary Note 2).
We examined whether RS neurons provide direct input to PNs. As above, extracellular recording was used to identify PNs via antidromic stimulation from both LRN and C7. Stimulation of the RS tract elicited short-latency monosynaptic responses (Fig. 1d; mean latency from third volley 0.43 +/− 0.17 ms s.d.; collision, red arrowheads). Taken together, these findings indicate that key features of PN circuitry are conserved in mice (Supplementary Note 1)16.
Excitatory PNs are a V2a subpopulation
V2a INs represent a major class of ipsilateral, excitatory pre-motor interneurons in the ventral spinal cord, and express the homeodomain transcription factor Chx10 (Fig. 2a)27,28. To assess whether excitatory PNs are included within the V2a cohort we crossed Chx10-Cre mice with a Rosa-lsl-tdTomato (-tdT) reporter line, generating Chx10::tdT mice. V2a INs were labeled by unilateral injection of a Cre-dependent adeno-associated viral vector expressing a Channelrhodopsin2-YFP fusion (AAV-FLEX-hChR2-YFP) into rostral cervical segments of adult Chx10::tdT mice (Fig. 2a).
Figure 2. Excitatory PNs are a V2a IN subpopulation.
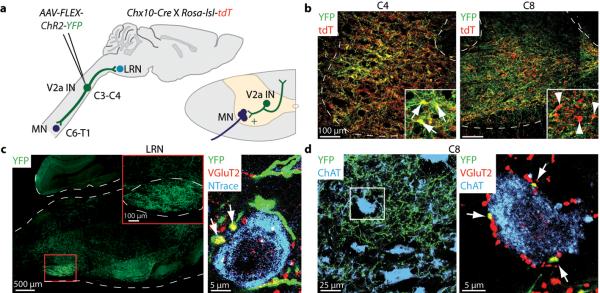
a, Unilateral C3/C4 injection of AAV-FLEX-hChR2-YFP into Chx10::tdT mice. b, 82% (+/− 7% s.e.m.; n = 2) of C3/C4 tdT+ V2a INs were transduced (C4, yellow neurons, arrows; C8, red only neurons, arrowheads). c, YFP+ V2a INs project to LRN. Neurons, labeled with NeuroTrace (blue), studded with vGluT2+ (red), YFP+ boutons (arrows, yellow boutons). Sparse YFP+ axonal labeling also in facial nucleus. d, C7/C8 ChAT+ MNs (blue) contacted by vGluT2+ (red), YFP+ boutons (arrows, yellow boutons).
With this labeling strategy >80% of all rostral cervical tdT+ V2a INs selectively expressed YFP (Fig. 2b). The LRN contained a dense network of YFP+ axons, and individual LRN neurons were studded with vGluT2+, YFP+ V2a-derived boutons (Fig. 2c). Similarly, C7/C8 level ChAT+ motor neurons were contacted by vGluT2+, YFP+ V2a boutons (Fig. 2d). We detected a similar pattern of bouton labeling on LRN and motor neurons after viral injection at C6-T1 levels, but little YFP+ labeling in the LRN after viral injection at more caudal levels (Extended Data Fig. 1a, Supplementary Note 3)20. Thus V2a neurons within C3 to T1 segments provide glutamatergic input to LRN and motor neurons.
To assess whether individual cervical V2a IN axons bifurcate to innervate LRN and forelimb-innervating motor neuron targets we injected a retrograde tracer, cholera toxin subunit B (CTB), into the LRN and a trans-synaptic tracer, wheat germ agglutinin (WGA)32, into forelimb muscles of Chx10-Cre;Rosa-lsl-YFP mice. >30% of YFP+ cervical V2a INs were CTB-labeled and many YFP+, CTB+, WGA+ neurons were detected at intermediate levels of cervical spinal cord (Extended Data Fig. 1b). Thus a significant fraction of cervical V2a INs are excitatory PNs.
Kinematics of mouse reaching
To evaluate the behavioral role of PNs we developed a three-dimensional kinematic assay of paw position during a goal-directed reaching task (Fig. 3a,b, Supplementary Videos 1,2, Methods)33,34. We delineated three modular aspects of movement: an early proximal ‘reach’ phase, from forelimb lift to the point that the paw passes through the access window; a late distal ‘grab’ phase, in which the arm is fully extended and the paw pronates in anticipation of pellet retrieval; and a digit abduction phase, during grasp. Task success, defined by pellet retrieval, was assessed in a multi-reach assay that tolerates numerous reach attempts34, and a more stringent single trial kinematic reach assay (Supplementary Note 4). In both assays the incidence of trial success varied considerably between animals (Extended Data Fig. 2a)33, leading us to compare behavior within individual mice, before and after experimental perturbation.
Figure 3. Reaching kinematics.
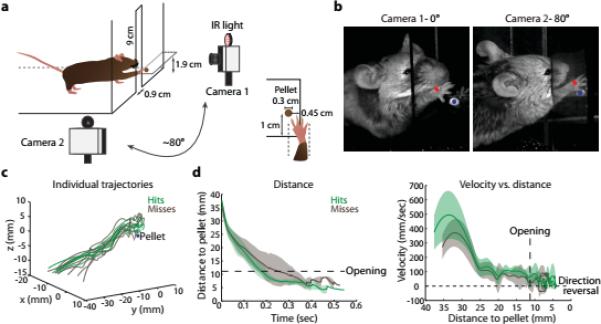
a, Mice were trained to reach for a food pellet displaced to the left. b, High-speed capture and tracking of an infrared (IR)-reflective marker attached to the right paw. c, Trajectories of successful (hits, green traces) and unsuccessful trials (misses, brown traces) from a representative mouse. d, Mean kinematics from a representative mouse. Transition from reach to grab phase delineated by box opening (large dashes). Velocity crossings of zero (small dashes) indicate direction reversals. Shaded regions indicate s.d. See Extended Data Fig. 2b.
Analysis of paw movement in wild type mice revealed stereotypic reach kinematics: a comparison of fourteen reach parameters failed to detect systematic differences between successful and unsuccessful trials (Fig. 3c,d, Extended Data Fig. 2b, Supplementary Videos 1,2, Methods; n = 7; two-tailed paired t-test), implying that wild type trial outcome reflects the accuracy of digit placement and/or object manipulation rather than an overt deviation in paw kinematics. We used this behavioral assay to explore two genetic means of perturbing V2a PN function: acute ablation of cervical V2a neurons, eliminating both PN axonal outputs; and optogenetic stimulation of PN terminals in the LRN to perturb selectively the internal copy branch.
V2a IN ablation perturbs reaching
We targeted cervical V2a INs for elimination by unilateral injection of a viral vector that directed conditional expression of a diphtheria toxin receptor (DTR)-GFP fusion (AAV-FLEX-DTR-GFP) into C3-T1 levels of Chx10::tdT mice (Fig. 4a, Extended Data Fig. 3a)35. Seven days after viral injection >80% of tdT+ V2a INs selectively expressed DTR-GFP, and the LRN contained a dense network of GFP+ axons (Fig. 4b, Extended Data Fig. 3b). Diphtheria toxin (DT; 400 ng) administration 14-21 days after DTR transduction resulted, 7 days later, in a >80% elimination of C3-T1 tdT+ V2a INs and a virtually complete loss of GFP+ axons within the LRN (Fig. 4c, Extended Data Fig. 3b,c).
Figure 4. Cervical V2a IN ablation perturbs reaching.

a, Experimental design. b, After C3-T1 AAV-FLEX-DTR-GFP injection 83% (+/− 0.3% s.e.m.; n = 2) of tdT+ V2a INs co-expressed GFP and DTR (arrows), and GFP+ projections were detected in LRN. c, Post-DT, 84% (+/− 9% s.e.m.; n = 2) of C3-T1 tdT+ V2a INs and GFP+ LRN projections were eliminated (arrowhead, spared V2a IN). d, Ablation reduced success in the multi-reach task (n = 3 DTR, n = 4 control). e, Kinematics from a representative V2a IN-ablated mouse. See Extended Data Fig. 3e. f, Mean number of direction reversals increased during reach, but not grab, phase in V2a IN-ablated mice. Shapes represent individual mice. Error bars indicate s.e.m. See Extended Data Table 1 and Extended Data Fig. 3 for statistical analysis.
After cervical V2a IN ablation reach success was reduced in the multi-reach task and eliminated in the kinematic assay, with no impact in DT-treated control mice spared DTR transduction (Fig. 4d, Extended Data Fig. 3d). During the reach phase in V2a IN depleted, but not in control, mice we observed an ~sixfold increase in the incidence of paw direction reversals, an ~two-fold decrease in mean velocity and an ~two-fold increase in the total duration of movement (Fig. 4e,f, Extended Data Fig. 3e-g, Extended Data Table 1, Supplementary Video 3). Motor impairment was confined to the reach phase, as the grab phase did not exhibit perturbed kinematics (Fig. 4e, Extended Data Fig. 3e, Extended Data Table 1). Moreover, the extent of digit abduction during grasp attempts was unaffected (Extended Data Fig. 3h, Supplementary Video 3), implying a sparing of digit movements. Thus the reach phase is perturbed selectively by ablation of cervical V2a INs.
To address the specificity of motor impairment mice were tested for accuracy of forepaw placement using a horizontal ladder task36 and found to display an equivalently low incidence of rung placement errors before and after DT-mediated ablation (Extended Data Fig. 3i, Supplementary Note 5). Thus elimination of cervical V2a neurons exerts a preferential impact on forelimb reach behavior.
PN internal copy branch activation
The reaching impairments observed after cervical V2a neuron elimination left unresolved the relevance of the PN internal copy branch. To address this issue ChR2 was expressed in cervical V2a INs by unilateral injection of AAV-FLEX-hChR2-YFP into C3-T1 segmental levels in Chx10-Cre mice. We reasoned that focal laser photo-stimulation of ChR2+ PN terminals within the LRN could provide specific access to the PN subset of V2a INs, and permit selective manipulation of the PN internal copy pathway.
After viral injection we detected a dense network of ChR2-YFP+ fibers within the LRN (Fig. 2, Extended Data Fig. 1a). Extracellular recording from LRN neurons in anaesthetized mice revealed that focal photo-stimulation of PN terminals excited ~40% (n = 8/21) of neurons with cerebellar projections, assessed by spike collision after cerebellar stimulation, with no effect in virus-spared control mice (Fig. 5a, Extended Data Fig. 4a-c).
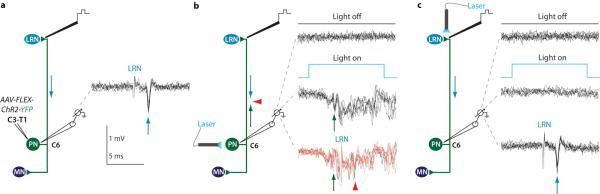
Figure 5. Photo-activation of PN terminals in the LRN.
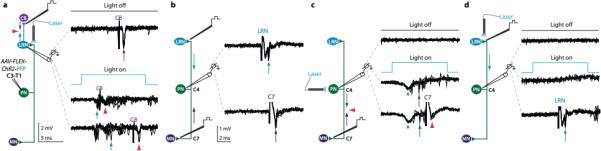
a, Extracellular recording of LRN neurons antidromically activated from cerebellum (20 μA; purple arrows) during PN terminal photo-stimulation (473 nm) revealed repeated spiking (n = 8/21; blue arrows) and collision (red arrowheads, two collision failures in bottom traces). b, PNs in C3/C4 were identified by electrical stimulation from LRN (80 μA) and C7 (40 μA) and by collision (not shown). c, Photo-stimulation of the same PN cell bodies activated 69% of PNs (n = 9/13; green arrows), verified by collision of C7 spike (lower traces; red arrowheads; compare with antidromic spike in b). See Supplementary Note 6. d, In the same PNs, photo-stimulation of terminals in LRN did not trigger antidromic spikes (0/31 PNs; 0/3 control), whereas electrical stimulation in LRN always produced antidromic spikes (lower traces; arrow; compare with antidromic spike in b). See Extended Data Fig. 5.
We examined whether photo-stimulation of PN terminals in the LRN triggers antidromic action potentials. As above, PNs were identified by spike collision after electrical stimulation of LRN and C7 (Fig. 5b, Extended Data Fig. 5a). Photo-stimulation of identified PN cell bodies at cervical levels revealed that ~70% expressed ChR2, as determined by spike collision after LRN or C7 electrical stimulation (Fig. 5c, Extended Data Fig. 5b, Supplementary Note 6). For these PNs we compared the impact of local LRN electrical stimulation and focal LRN photo-stimulation, monitoring the incidence of antidromic spikes. Electrical stimulation of the LRN invariably elicited antidromic spikes in PNs, whereas LRN photo-stimulation never elicited spiking (0/31 PNs; Fig. 5d, Extended Data Fig. 5c). Thus photo-stimulation of ChR2+ PN terminals within the LRN activates the internally-directed pathway without eliciting antidromic action potentials (Supplementary Discussion).
To examine the behavioral impact of activating the PN internal branch we analyzed the influence of LRN photo-stimulation on reach kinematics (Fig. 6a). Application of light pulses severely degraded reach success in the multi-reach task and eliminated success in the kinematic assay, with no impact on control, virus-spared, mice (Fig. 6b). Indeed, photo-stimulation in virally-transduced, but not in control, mice severely perturbed motor performance (Fig. 6c,d, Extended Data Fig. 6a-c, Extended Data Table 2, Supplementary Video 4: no light, Supplementary Video 5: light). We detected an ~4.5-fold increase in the incidence of paw direction reversals during the reach phase (Fig. 6d, Extended Data Table 2). Certain other kinematic parameters, notably variations in velocity, were perturbed in both reach and grab phases (Fig. 6c, Extended Data Fig. 6a,c, Extended Data Table 2) – nevertheless digit abduction was not affected (Extended Data Fig. 6d, Supplementary Video 5), revealing an element of selectivity. These findings indicate that imposed activation of the internally-directed PN branch severely disrupts forelimb reaching movements (Supplementary Discussion).
Figure 6. PN terminal photo-stimulation perturbs forelimb movement via a cerebellar-motor loop.
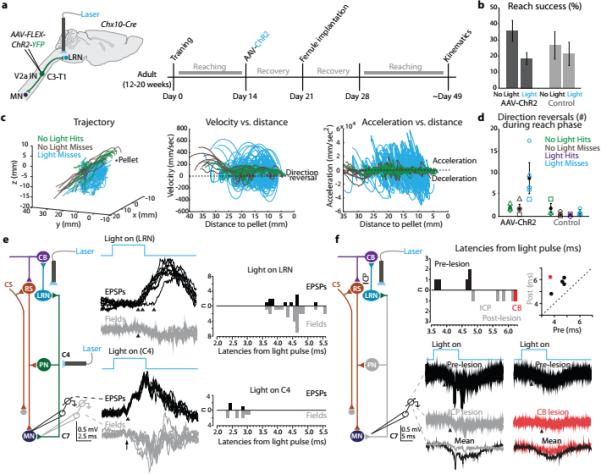
a, Experimental design. b, Photo-stimulation reduced success in the multi-reach task (n = 5 ChR2, n = 4 control). c, Kinematics from a representative AAV-ChR2 mouse. See Extended Data Fig. 6a. d, Mean number of reach phase direction reversals increased during photo-stimulation. See Extended Data Table 2 and Extended Data Fig. 6 for statistical analysis. e, Intracellular recording from forelimb MNs during PN terminal photo-stimulation revealed EPSPs with varying onset (upper black traces, bars; 0.8 ms between first two arrowheads, 2.5 ms between first and third arrowheads; n =11). Cervical photo-stimulation of PN cell bodies produced shorter latency fixed onset EPSPs (lower black traces, bars; onset (arrowhead) 0.6 ms from volley in field (arrow); n = 3). Field potentials recorded in C6/C7 ventral horn (gray traces, gray bars) had similar onset and duration as MN EPSPs (n = 27, LRN-light; n = 8, C4-light). f, Bilateral lesion of inferior cerebellar peduncles (ICP; gray traces) or cerebellar extirpation (CB; red traces) reduced field potential size (mean reduction in area; 56% +/− 8.8% s.d.; P = 0.001; n = 5; two-tailed paired t-test). Shortest latency fields (~3.6 to 4.7 ms) were eliminated after lesions (histogram, scatter plot). Error bars indicate s.e.m.
A PN internal copy cerebellar-motor loop
A core feature of internal copy models is a rapid modulation of motor output10-14. We therefore explored how motor neurons are influenced by photo-stimulation of the internally-directed PN branch. Intracellular recording from forelimb-innervating motor neurons in anesthetized Chx10-Cre mice injected at C3-T1 with AAV-FLEX-hChR2-YFP revealed polysynaptic EPSPs after LRN photo-stimulation (Fig. 6e; upper black traces; mean onset latency 4.18 +/− 0.75 ms s.d.; mean variance 0.28 +/− 0.35 ms2 s.d.). In contrast, recruitment of the pre-motor branch by photo-stimulation of PN cell bodies revealed monosynaptic motor neuron EPSPs (Fig. 6e; lower black traces; mean onset latency 2.60 +/− 0.20 ms s.d.; mean variance 0.014 +/− 0.009 ms2 s.d.). Recording from LRN neurons during PN terminal photo-stimulation revealed short-latency, monosynaptic activation (mean onset latency 0.87 +/− 0.10 ms s.d. from local depolarization; mean variance 0.009 +/− 0.006 ms2 s.d.), evidence that the variability in motor neuron EPSP onset after PN terminal photo-stimulation arises downstream of the PN-LRN synapse (Extended Data Fig. 7a). These findings reinforce the view that photo-stimulation of PN terminals activates motor neurons through a polysynaptic pathway and not by antidromic recruitment of the pre-motor branch (Supplementary Discussion, Extended Data Fig. 7b).
To examine whether the PN-LRN internal copy pathway engages cerebellar circuits we severed LRN output to cerebellar cortex and deep cerebellar nuclei through bilateral transection of the inferior cerebellar peduncles, or by cerebellar extirpation (Extended Data Fig. 8a). These lesions did not impair synaptic activation of LRN neurons induced by PN terminal photo-stimulation (Extended Data Fig. 8b). Motor neuron responses were assessed by recording field potentials in C6/C7 ventral horn – revealing an onset latency and duration similar to that of motor neuron EPSPs (Fig. 6e; gray traces, Extended Data Fig. 8c, Supplementary Note 7). After cerebellar lesions, field potentials elicited by PN terminal photo-stimulation were reduced by up to ~65% (Fig. 6f), suggesting that both cerebellar and non-cerebellar output pathways37-39 mediate the PN-LRN control of motor output. Nevertheless, field potential onsets after lesions occurred with an additional delay of ~1 to 3 ms when compared with non-lesioned mice (Fig. 6f). Thus the cerebellar-directed PN internal copy pathway appears to be involved in rapid feedback modulation of motor output.
Discussion
The refinement of goal-directed reaching movements is thought to rely on the generation of internally-directed copies of motor commands9-16. Here, we provide evidence that V2a PNs lie at the core of an internal copy feedback circuit crucial for skilled reaching. Ablation of cervical V2a INs elicits selective reaching defects, photo-stimulation of PN terminals within the LRN erodes the fidelity of forelimb movement, and activation of the PN internal copy branch recruits a fast cerebellar-motor feedback loop.
Our functional analysis has provided insights into two general issues in limb motor control – the degree to which distinct microcircuits control elemental aspects of movement, and the evolutionary conservation of circuits and strategies for skilled reaching. Targeted elimination of PNs, albeit through ablation of the entire set of cervical V2a INs, disrupts forelimb reaching in a selective manner. Thus PNs in particular, and cervical V2a INs as a whole, appear to have little impact on aspects of mouse forelimb movement that engage distal musculature during grasping. These findings add to an emerging view that limb motor modularity has its basis in the recruitment of distinct spinal interneuron subtypes and circuits1,16,25,40. Genetic inactivation of dI3 excitatory pre-motor interneurons preferentially impairs forepaw grasp behaviors41, and elimination of dI4 presynaptic inhibitory interneurons uncovers forelimb oscillatory tremor during reaching42, phenotypes distinct from that seen after V2a IN ablation. Classical studies in cat and primate also speak to the issue of conservation in PN function and behavioral modularity16,32. As with V2a neuronal ablation, severing the pre-motor output of cat PNs undermines reaching but not grasping25. The consistency of behavioral defects across mammalian species and interventional approaches suggests that PNs represent a major subpopulation of V2a INs involved in the control of reaching. In monkey, however, blocking the output of PNs disrupts both reach and grasp26, which may reflect an evolutionary elaboration in the wiring of circuits for distal forelimb dexterity16,43.
Our findings also provide insight into the nature of feedback provided by internal copy pathways. The PN-mediated recruitment of LRN neurons activates motor neurons through a fast cerebellar feedback loop. The most likely substrate for such rapid feedback is the collateral projection of LRN axons to deep cerebellar nuclei, which then recruit RS neurons that activate motor neurons as well as PNs themselves (Supplementary Discussion)31,37,44,45. Yet our findings pose the problem of the logical underpinnings of a circuit in which enhanced PN activity triggers a reinforcing feedback loop that further excites PNs and motor neurons, potentially destabilizing motor output. One potential resolution lies in the fact that we manipulated solely an excitatory subpopulation of PNs – the physiological operation of the PN system may depend critically on parallel recruitment of inhibitory PNs24,29,46. Our focus on the most rapid PN response pathway does not preclude the engagement of cerebellar granule and Purkinje circuits that display plasticity during motor adaptation and learning10,47,48, permitting an additional level of dynamic response to PN activity.
Finally, we consider the merits of an internal copy conveyed from the spinal cord. By virtue of their privileged status as last-order interneurons, and their role as mediators of convergent descending and segmental sensory input, PNs may be afforded access to a degree of integrated pre-motor information not available upstream. We note that the PN internal copy strategy differs in design from more conventional spinal efference copy systems that lack a pre-motor output arm, and as a consequence are required to receive and transmit a facsimile of the diverse inputs that impinge on motor neurons49,50. Admittedly, PNs provide only one of many convergent inputs to motor neurons32. Yet their bifurcating output reduces the burden inherent in conveying an accurate copy of pre-motor information, simplifying the task of matching pre-motor signal and internal report.
Methods
Mice
Wild type, Chx10-Cre (L. Zagoraiou, S. Crone, K. Sharma, T.M. Jessell), Rosa-lsl-EYFP (The Jackson Laboratory; 006148) and Rosa-lsl-CAG-tdTomato (The Jackson Laboratory; 007909) mice were all on a C57BL/6 background. Animals were housed individually with light on a 12:12 hour cycle. Procedures performed in this study were conducted according to US National Institutes of Health guidelines for animal research and were approved by the Institutional Animal Care and Use Committee of Columbia University. Electrophysiological procedures were approved by the ethical committee of Umeå University.
Reaching task
The basic training paradigm and reaching box design were based on established methods33,34. Adult mice (~12-20 weeks old) were used for all reaching experiments. Before training, to ensure motivation to perform the reaching task, animals were food deprived to ~80-90% of their original body weight. To habituate the mice to the food pellets used as the reaching target (20 mg, 3 mm diameter; Bio-Serv #F05301) while maintaining food deprivation, ~3 g of pellets were given at the end of each day. Following two to three days of food deprivation and habituation, mice were placed individually into a clear acrylic box 20 cm high, 8 cm wide and 19.5 cm long, with a 0.9 cm wide and 9 cm high opening on the front of the box. All walls were 0.32 cm thick, with the exception of the front wall, which was 0.16 cm thick. The top and bottom of the box were left open. An acrylic tray 1.9 cm tall, 8.3 cm long and 3.8 cm wide was placed in front of the opening. Food pellets were placed 1 cm away from the opening in an indentation 0.4 cm in diameter, 1.25 mm deep and centered 0.45 cm to the left of center, to encourage the mouse to use its right forelimb (Fig. 3a).
Mice remained in the box for 20 minutes per day. Pellets were initially left on the floor of the box and within tongue distance on the tray. Gradually, pellets were placed further away on the tray and eventually in the indentation to force the mice to reach for the pellet. This acclimation period was repeated for three to four days, after which the mice that were readily reaching with the right paw were selected for experiments (~50-75% of all mice tested). For all experiments, the selected mice were then trained every day for two weeks in the reaching box for 20 minutes or 20 successful reaches each day, whichever occurred first.
In the multi-reach assay, a successful reach was defined as reaching for, grasping and retrieving the pellet into the box in one motion. A miss was defined as any full reaching motion in which the paw passes through the opening but fails to grasp or retrieve the pellet33,34. Rapid successions of attempts were often ultimately successful and counted, though the rapidity of these movements made it difficult to determine whether the paw had returned all the way the ground. Success rates were highly variable between mice (Extended Data Fig. 2a)33, reinforcing the importance of comparing reaches within the same mouse before and after acute manipulation.
Kinematic quantification of mouse reaching
To quantify reaching in three dimensions and assess kinematics, trained mice were placed in a reaching box with the same dimensions as described above, but with a modified pellet tray 1 mm thick and 4.15 cm long glued to the front of the box, providing an unobstructed view of the paw during the entire reach (Fig. 3a,b and Supplementary Videos 1-5). The location of the pellet in the tray indentation was identical to the placement described above. Successful reaches in the kinematic assay were as defined above, with the exception that the paw must start from the ground and complete an entire reach (i.e. successive attempts where the paw did not initiate from the ground, as evident from the video recordings, were discarded). Success rates were lower than in the multi-reach success assay, due to the more stringent definition of reaching movements. We failed to detect successful reaches post-V2a IN ablation or during PN terminal photo-stimulation, and thus, no post-manipulation ‘hits’ are presented in the kinematic data.
Two high-speed, high-resolution monochrome cameras (HiSpec 1; 2 GB memory; Fastec) with 50 mm f/1.4 manual iris and focus lenses (C-Mount, ½ inch CCD; Fujinon) were placed in front and to the right of the box ~80° apart (Fig. 3a). An infrared LED light source (Clover Electronics) was mounted on top of each camera, and each lens was equipped with an infrared longpass filter (Midwest Optical Systems). Cameras were synced to each other and calibrated in space with a four-marker reference structure (4.5 cm by 2.77 cm) and a two-marker wand (2 cm), using MaxTRAQ3D software (Innovision Systems). Cameras were set to 500 fps with a resolution of 1280 × 1024. Black walls were placed behind the sides and back of the box to reduce background and increase contrast.
Mice were briefly anesthetized with isoflurane, and a custom-made 1.5 mm reflective hemisphere marker (B & L Engineering) was attached to the back of the right paw with adhesive. Mice were allowed to recover from anesthesia before being placed in the box. Small puffs of air from an air canister were occasionally used to discourage the mouse from chewing on and removing the marker. Overhead lights were turned off to increase the contrast of the reflective marker. HiSpec camera control software was used to record the reach from both cameras, using an external trigger in ring mode. Videos were saved as two uncompressed AVI files and MaxTRAQ2D software (Innovision Systems) was used to automatically track the marker and the pellet (settings: match accuracy 5%, search box height and width ~3× marker diameter, image threshold 111, center of mass centroid calculation, minimum marker size 3). Because the pellet is light in color, the center of the pellet could easily be identified and automatically tracked without the need for a reflective marker. Tracking began as the paw left the ground. The marker and pellet were tracked until the paw made contact with the pellet, or, in the cases where the paw missed the pellet completely, until the arm was maximally extended and a full reach and prehension motion was completed. The marker was manually tracked in the rare cases where automatic tracking failed or a camera lost sight of the marker. Two independent investigators verified the accuracy of all automated tracking. Tracked files were imported into MaxTRAQ3D software to compute the coordinates of the marker and pellet in three dimensions. Maximum residual error rates were set at 2 mm, though actual error rates were always much smaller. The three dimensional data (consisting of 6 columns: X,Y,Z coordinates of marker and of pellet) were imported into MaxMate motion analysis toolbox for Excel (Innovision Systems), and any gaps were interpolated (gaps in the data were rare and the maximum interpolation was 5 frames). Data were saved in Excel and imported into MATLAB (MathWorks) for analysis.
In MATLAB, 1) pellet position was normalized by subtracting the coordinates of the pellet from those of the paw; 2) the data were resampled at 1000 HZ by interpolating over a factor of two (MATLAB ‘interp’ function); 3) data were filtered through a custom-designed 25 Hz low-pass filter (M. Churchland); and 4) starting position was normalized by discarding reaches that started at a Z distance (between paw and pellet) below a specified threshold, and removing data frames for the remaining reaches above the specified threshold. The purpose of normalization was to: a) remove the most aberrant reaches (i.e. reaches with starting positions in the z-axis that differed substantially from the population; and 2) to normalize the starting position of the remaining reaches – we could not normalize x or y starting position since all reaches start from a different position, but all reaches must pass through a given z position on their way to the pellet, allowing us to normalize the start of each reach to this z position value. The z threshold was 13 mm for DTR ablation experiments (18 out of 157 total reaches discarded for starting below threshold); and was 15.25 mm for ChR2 experiments (22 out of 282 total reaches discarded for starting below threshold). The filtered, normalized data were then sorted into pre- and post-manipulation hits and misses.
Paw distance to pellet was calculated as the sqrt(X^2+Y^2+Z^2), velocity was calculated as the derivative of the distance and acceleration was calculated as the derivative of the velocity. Mean position, distance and velocity were calculated by taking the mean across reach frames; therefore, the number of reaches comprising the mean gradually decreases as time progresses. Standard deviation is represented as the shaded region around the mean.
Because of variability in behavior between mice, comparisons were performed within the same mouse before and after manipulation when possible. Analyses were performed on approximately equal numbers of male and female mice, and no sex-specific differences in reaching success or kinematics were identified. For all experiments, ~12-17 reaches per condition per mouse were recorded for kinematic analysis.
We selected 14 kinematic parameters for analysis and comparison. Mean reach duration was calculated across all reaches of the same category (e.g. all pre-toxin hits, all post-toxin misses) for each individual mouse. Mean minimum distance from the paw to the pellet was calculated across all reaches of the same category for each individual mouse. Mean velocity and acceleration were calculated by determining the mean velocity or acceleration during each individual reach, and calculating the mean across all reaches of the same category for each individual mouse. Mean maximum and minimum velocities and accelerations were calculated across all reaches of the same category for each individual mouse. The mean s.d. of the distance, velocity and acceleration were determined by calculating the standard deviation between all reaches of the same category at each frame, and calculating the mean across all frames for each individual mouse. Direction reversals were defined as the number of times the velocity transitioned from positive (movement toward the pellet) to negative (movement away from the pellet) and vice versa. Mean number of direction reversals was calculated across all reaches of the same category for each individual mouse. Mean amount of time spent moving away from the pellet was determined by quantifying the number of frames in which the velocity was below zero during each reach, and calculating the mean across all reaches of the same category for each individual mouse. Acceleration/deceleration transitions were defined as the number of times the acceleration transitioned from positive (acceleration) to negative (deceleration) and vice versa. Mean number of acceleration/deceleration transitions was calculated across all reaches of the same category for each individual mouse. Analyses of early reach and late grab phases were performed on the epoch before or after a distance-to-pellet threshold of 11 mm, the distance at which the paw completely passes through the opening of the box.
Reach success, digit distance and horizontal ladder quantification
For diphtheria toxin (DT)-mediated ablation experiments, reach success was quantified once a day in the multi-reach assay by counting the number of hits and misses over a period of 20 minutes or 20 hits, whichever came first. Quantification was performed for 5-15 total days before viral injection, for 5-15 days beginning after recovery from surgery (~one week post-surgery) and for 5-13 days post-ablation (beginning one week after DT administration). Control mice were quantified for 14-24 days pre-DT and for 8-10 days post-DT (beginning one week after DT administration). For ChR2 experiments, baseline was quantified for five days before viral injection. After 5 weeks of ChR2 expression (~4 weeks after ferrule implantation), quantification was performed with and without light over a period of 10 minutes or 10 hits, whichever occurred first, for a total of 4-5 days. In control mice, baseline was quantified for 8 days before ferrule implantation, and ~2 weeks later quantification was performed for a total of 5 days.
Maximum digit abduction was calculated in MaxTRAQ2D software by manually marking and measuring the distance between digits 2 and 4 in the frame captured by camera #1 in which the digits were maximally extended (Fig. 3b). The mean was calculated across all reaches in individual mice pre- and post-DT. For the horizontal ladder task36, two standing platforms measuring 10 cm long and 4 cm wide were placed at the ends of a clear acrylic box 68 cm long and 4 cm wide. At the inner edge of each platform were 10 rungs, each 1 cm apart, serving as starting rungs. In between the two groups of 10 rungs were 13 rungs, each 2 cm apart. Only steps on these 13 rungs were considered for quantification. Below the walkway was an angled mirror to provide a bottom-up view of the paws. Mice were placed in the box and videotaped with a high definition camcorder (Canon Vixia HF11) as they walked across the ladder 10-15 times; a walk was only considered valid if the mouse did not stop for an extended period of time and did not reverse direction. For quantification, the video recording of each walk was slowed to half speed and the number of times the right forepaw hit (direct placement on the rung); staggered (brief paw placement on the rung before replacing the paw on the same rung or the next rung); slipped (placement of the paw on a rung followed by a slip off the rung); and missed (paw misses rung completely) were quantified. Pre-DT walks were recorded following recovery from viral injection, and post-DT walks were recorded one week after DT administration. Mean values were calculated across all walks in individual mice pre- and post-DT.
Viral constructs
For Cre-dependent anatomical labeling of cervical V2a INs and for PN terminal photo-stimulation, we used a recombinant adeno-associated (AAV) construct containing an inverted hChR2(H134R)-EYFP sequence flanked by two pairs of heterotypic, antiparallel loxP recombination sites (K. Deisseroth; Addgene plasmid 20298). AAV-FLEX-hChR2-YFP was packaged and pseudotyped with an AAV1 serotype to a titer of 4 ×10¹² viral particles/ml (UNC Gene Therapy Center).
For cervical V2a IN ablation we generated a Cre-dependent AAV-FLEX-DTR-GFP. Simian DTR (HBEGF) fused to GFP (T. Buch)35 was removed from a pBluescript II KS(+/−) backbone via digestion at XhoI, blunt end generation with T4 DNA polymerase (New England Biolabs) and subsequent digestion at NotI. A pAM-FLEX AAV2 backbone51 was digested at EcoRI, followed by blunt end generation with T4 DNA polymerase and digestion at NotI. The insert was ligated into the backbone in between two pairs of heterotypic, antiparallel loxP recombination sites, downstream of a CAG promoter and upstream of a woodchuck hepatitis virus post-transcriptional regulatory element (WPRE) sequence. The final construct was validated by sequencing of the insert in forward and reverse directions. To test the construct, we grew 293T cells on chamber slides (Lab-Tek II; Thermo Scientific) to 70% confluence and transfected the cells with AAV-FLEX-DTR-GFP plasmid alone or in combination with a Cre-expressing plasmid (NLS-cre downstream from a PGK promoter) at a 3:1 FuGENE transfection reagent (Promega) to DNA ratio. After two days, the cells were fixed for 10 minutes with 4% paraformaldehyde in 0.1M phosphate buffer, processed for immunocytochemistry, mounted using Fluoromount-G (SouthernBiotech) and coverslipped for imaging. After confirming Cre-mediated expression specificity (Extended Data Fig. 3a), the virus was packaged and pseudotyped with an AAV1 serotype to a titer of 5 × 10¹² viral particles/ml (UNC Gene Therapy Center).
Cervical spinal cord viral injections
For cervical spinal cord AAV injections, mice were anesthetized with 0.01 ml/g body weight of 2.5% tribromoethanol (Sigma-Aldrich) via intraperitoneal injection. An additional 0.0025 ml/g was administered as necessary to sustain deep anesthesia during surgery. Hair was removed from the back and neck with a shaver and the mouse was placed in a stereotaxic frame with a mouse adapter, mouse ear bars, spinal base plate and digital display readout (David Kopf Instruments). Eye lubricant was applied (Puralube Vet Ointment; Dechra), the head was tilted forward and the tail was gently elevated and pulled back using a spinal vertebrae clamp (David Kopf Instruments). An incision was made over the cervical spinal cord and the muscles overlying the cord were separated along the midline using forceps. Muscle was cleaned from the spinal cord using a delicate bone scraper (Fine Science Tools) and absorption spears (Fine Science Tools). The large spiny process of the second thoracic vertebrae was clasped and gently elevated with a small alligator clip held by a spinal vertebrae clamp to separate the cervical vertebrae and expose the spinal cord. The dura was gently removed above the cervical segments with sharp forceps.
Virus was loaded into a pulled glass micropipette using a Nanoject II (Drummond Scientific). The Nanoject II was mounted onto the stereotaxic arm and the pipette was gently inserted to the full depth of the spinal cord (~1.1 to 1.6 mm from the surface). Injections were made in 23 nl increments, slowly retracting 100 μm with each injection until reaching the surface of the cord. After the final injection, 30 seconds were allowed to elapse before fully retracting the pipette from the cord. For each segment injected, three injection tracks were made on the right side of the cord, evenly distributed across the dorso-ventral extent of the segment and the medio-lateral extent of the gray matter. Depending on the experiment, injections were made in all or selected C3 to T1 segments. For thoracic and lumbar injections (Extended Data Fig. 1a), the incision and muscle separation were performed over the desired target area – for lumbar injections it was necessary to perform a partial laminectomy above the injection sites to expose the spinal cord. Following injection, the skin was sutured and the mouse was allowed to recover in a postoperative chamber before being housed individually. Post-operative buprenorphine (Henry Schein Medical) was given at 0.032 mg/kg body weight as analgesic.
Anatomical labeling of PNs
For conditional viral labeling of cervical V2a INs (Fig. 2, Extended Data Fig. 1a), AAV-FLEX-hChR2-YFP was injected into cervical, thoracic or lumbar segments of 8-12 week-old Chx10-Cre;Rosa-lsl-tdT mice, as described above. Mice were perfused two weeks after injection and tissue was processed for immunohistochemistry.
For dual retrograde labeling of PNs (Extended Data Fig. 1b), 8-12 week-old Chx10-Cre;Rosa-lsl-YFP mice were anesthetized, prepared and placed in a stereotaxic frame, as described above. For retrograde labeling from the LRN, hair was removed from the head and neck using a shaver, the head was placed in a skull flat orientation and an incision was made from the middle of the skull to the neck. A Nanoject II with a glass micropipette was loaded with 1% cholera toxin subunit B (CTB) conjugated to Alexa Fluor 555 (Invitrogen) in phosphate buffered saline. The zero coordinate of the pipette tip was calibrated to bregma and the pipette was moved posterior 7.6 mm and lateral to the right 1.2 mm. Muscle was gently removed from the skull overlying the target site, a small burr hole was made with a dental drill and the pipette was advanced 6.2 mm ventral. Six injections were made in 23 nl increments while slowly retracting from 6.2 mm to 5.75 mm ventral, waiting 10 seconds between injections and 30 seconds before finally retracting from the brain. For transsynaptic labeling of PNs via forelimb-innervating motor neurons32, a small incision was made on the right proximal forelimb and a pulled glass micropipette loaded with 5% wheat germ agglutinin (WGA; Vector Laboratories) in 10 mM HEPES buffered saline with 0.1 mM Ca2+ (pH 8.5) was inserted into the triceps brachii muscle. WGA was slowly pressure injected using an aspirator tube assembly (Sigma-Aldrich) and a syringe. The skin on the head and arm were sutured and the mouse was allowed to recover in a post-operative chamber before being housed individually. Post-operative buprenorphine was given at 0.032 mg/kg body weight as analgesic. Mice were perfused two weeks after injection and tissue was processed for immunohistochemistry.
Ablation of cervical V2a INs
For quantification of AAV-FLEX-DTR-GFP transduction efficiency (Fig. 4b, Extended Data Fig. 3b,c), two adult Chx10-Cre;Rosa-lsl-tdT mice were injected with AAV-FLEX-DTR-GFP in C3-T1 segments, as described above. Mice were perfused two weeks after injection and tissue was processed for immunohistochemistry. For quantification of DT ablation efficacy (Fig. 4c, Extended Data Fig. 3b,c), two adult Chx10-Cre;Rosa-lsl-tdT mice were injected with AAV-FLEX-DTRGFP in C3-T1 segments and two weeks later, along with two adult wild type control mice, were administered 400 ng of diphtheria toxin (Sigma-Aldrich) in sterile phosphate buffered saline via intraperitoneal injection. Mice were perfused one week after DT administration and tissue was processed for immunohistochemistry.
For pre-DT and post-DT V2a IN quantification, the right halves of 10-15 axial sections spanning C3-T1 were imaged. For pre-DT, the number of GFP+ neurons as a proportion of the total number of tdT+ V2a INs in each hemisection was quantified. No GFP+ neuron that was not also tdT+ was found. For post-DT, the number of remaining tdT+ neurons in each hemisection as a proportion of the mean total number of pre-DT tdT+ neurons was quantified.
For ablation behavioral experiments (Fig. 4, Extended Data Fig. 3), three 12-20 week-old Chx10-Cre;Rosa-lsl-tdT mice were trained in the reaching task for two weeks before AAV-FLEX-DTR-GFP was injected into C3-T1 segments, as described above. Following surgery, mice were allowed to recover for one week before food deprivation and reaching success quantification resumed, as described above. After approximately two weeks of reaching, video recordings for kinematic analysis of reaching, digit extension and horizontal ladder walking were made. Mice were then administered 400 ng of DT via intraperitoneal injection. Food deprivation continued, and after one week video recordings for kinematic analysis of reaching, digit extension and horizontal ladder walking were made and reaching success quantification resumed, as described above. Experiments on four control mice followed the same protocol with the exception of the viral injection.
Photo-stimulation of PNs
Five 12-20 week-old Chx10-Cre mice were trained in the reaching task for two weeks before AAV-FLEX-hChR2-YFP was injected into C3-T1 segments (Fig. 5,6, Extended Data Fig. 4-6,7a,8). After approximately one week of recovery, mice were prepared for stereotaxic LRN surgery, as described above, and a custom-made mono fiberoptic cannula comprised of a zirconia ferrule housing an optical fiber (200 μm core diameter; fiber protrusion length 5.95 mm; Doric Lenses) was inserted into the LRN (from bregma: 7.6 mm posterior; 1.2 mm lateral (right); 5.98 mm ventral) using a stereotaxic cannula holder and adapter (Doric Lenses). The ferrule was secured to the back of the skull using C&B-Metabond (Parkell) and Ortho-Jet acrylic resin (Lang), as described52, and a dust cap was placed over the ferrule. The mouse was allowed to recover for approximately one week before food deprivation and reaching resumed. A total of five weeks after viral injection, video recordings for kinematic analysis of reaching were made and reaching success quantification was performed, as described above. Light was delivered using a mono fiberoptic patch cord temporarily connected to the ferrule via a zirconia sleeve (Doric lenses). A 473 nm diode laser (CrystaLaser) and an arbitrary waveform generator (Agilent Technologies) were used to deliver pulses of light (15 ms pulse width, 20 Hz, ~12 mW, fiber tip 0.1 mm dorsal to LRN). Laser strength was calibrated at the end of the ferrule tip using a light power meter (Thor Labs). For kinematic video capture, laser pulses began just before the beginning of the reach and terminated at the end of the trial. For reach success quantification in the multi-reach task, laser pulses were delivered for the duration of the session. Experiments on four control mice followed the same protocol, with the exception of the viral injection.
In vivo electrophysiology
The results from the in vivo identification and characterization of PNs in the mouse (Fig. 1b-d, Extended Data Fig. 7b) were obtained from 11 wild type mice. The results from the in vivo analysis of ChR2-mediated excitation of PN somata and their terminals in the LRN (Fig. 5,6, Extended Data Fig. 4,5,7a,8) were obtained from 14 experimental mice 5 weeks post-virus injection, 1 experimental mouse 2 weeks post-virus injection and 5 wild type control mice. All mice had body weights of 21-33 grams and were 12-20 weeks old. Experiments were performed following published procedures31. Animals were anesthetized via intraperitoneal injection with a 1:1 mixture of fentanyl citrate (0.08 mg/ml; VetaPharma Ltd) / fluanisone (2.5 mg/ml; VetaPharma Ltd) and midazolam (1.25 mg/ml; Roche AB) at an initial dose of 0.15 ml. Doses of 0.02 ml atropine (to limit secretions in the trachea; 0.1 mg/ml, dose of 0.1 ml; Mylan AB) and betamethasone sodium phosphate (to prevent edema; 0.8 mg/ml, dose of 0.1 ml; Unipessoal, Lda) were given via intramuscular injection just after anesthesia. Tracheotomy and artificial respiration (rate: 60/min; volume: 50 ml flow O2) were always performed. The respiratory pump (S. Berg; U. of Göteborg) consisted of a rotary disc with a slit. Pancuronium bromide (paralytic; 20 μg/ml, dose of 0.1 ml; Organon AB) was given after tracheotomy and readministered approximately every 30 min. Additional fentanyl/fluanisone (dose of 0.1 ml) was given if the heart rate surpassed 600 bpm. Ephedrine (10 mg/ml, dose of 0.1 ml; NM Pharma AB) was given if pCO2 decreased below 1% for >5 min.
Body temperatures were maintained at 36-38° C, and the heart rate (~400 bpm) and expiratory pCO2 (3-4%) were monitored continuously and kept within physiological range. The pCO2 meter (Datex type CD-200-23-00; Instrumentarium Corp.) was adapted for the small expiratory volume of the mouse. The animal was mounted in a frame for stereotaxic placement of electrodes (L. Näslund; Umeå University) and the head was tilted forward 28.5°. In mice in which spinal cord recordings were performed, a 5 mm incision of the intercostal muscles was made bilaterally to eliminate pressure variations during respiration and stabilize the spinal cord. For spinal stimulation and recordings, laminectomies were performed to expose the C1, C3-C4, C6-T1 and T4 segments. For brainstem stimulation and recordings, a posterior craniotomy was performed to expose the caudal brainstem and cerebellum. The deep radial nerve was stimulated with needle electrodes inserted into the forelimb for guidance to antidromically identify forelimb-innervating motor neurons and the ventral horn, and to assess the physiological integrity of the spinal cord. Cord dorsum potentials were recorded with a silver ball electrode on the surface of the spinal cord near the recording site to monitor the incoming volley and to assess the physiological integrity of the spinal cord. For all single unit recordings, stimulation threshold was assessed to validate ‘all-or-nothing’ responses indicative of a single unit.
To identify PNs (Fig. 1b, Fig. 5b, Extended Data Fig. 5a,7b; n = 11 mice), a boro-silicate glass microelectrode (tip diameter ~0.5-1 μm; impedance ~10-30 MΩ; filled with 2M potassium citrate at pH 7.4) was inserted into cervical segments at a 3-5° lateral angle to a depth ranging from 0.2 to 0.8 mm from the surface of the cord. Single units were identified extracellularly via antidromic stimulation with tungsten electrodes (uninsulated tips 10 μm diameter; impedance 100 kΩ) inserted into the ipsilateral LRN (1.0-1.5 mm caudal to obex, 1.3 mm ipsilateral from the midline, 1.25 mm ventral from the brainstem surface, 25° forward angle; stimulation 30-100 μA), C7 (ipsilateral lateral edge of gray matter; 0.5 mm ventral from surface of cord; stimulation 15-100 μA) and T4 (ipsilateral lateral edge of gray matter; 0.5 mm ventral from surface of cord; stimulation 40-100 μA). By adjusting the timing of stimulation, collision tests were used to identify PNs projecting to both LRN and C7 ventral horn. The large majority of LRN-projecting neurons could also be antidromically activated by electrical stimulation in more caudal spinal cord, suggesting that most LRN-projecting neurons send bifurcating axons.
To measure effects of LRN and RS stimulation on forelimb-innervating motor neurons (Fig. 1c; n = 4 mice), the glass microelectrode was inserted into C6/C7 at 10-12° lateral from the vertical line to a depth ranging from 0.8 to 1.2 mm from the surface of the cord toward laminae IX, as identified via antidromic deep radial nerve stimulation. Field recordings, extracellular single unit motor neuron recordings and intracellular motor neuron recordings (minimal membrane potential of -30 mV) were performed. Tungsten electrodes were used to stimulate the LRN (see above) and the ipsilateral RS tract (0.5 mm rostral to obex, 0.3 mm ipsilateral from the midline, 1.0 mm ventral from the surface of the brainstem, 25° forward angle; stimulation 40-100 μA).
To measure the effects of RS tract stimulation on PNs (Fig. 1d; n = 9 mice), a glass microelectrode was used to identify PNs, as described above, and a tungsten electrode was used to stimulate the RS tract (0.5 mm rostral to obex, 0.3 mm contralateral from the midline, 1.0 mm ventral from the surface of the brainstem, 25° forward angle; stimulation 3 × 50 μA). The integrity of the descending tracts and spinal cord was assessed via stimulation of the medial longitudinal fasciculus (MLF) with a tungsten electrode (1.0 mm rostral to obex, 0.3 mm contralateral from the midline, 0.5 mm ventral from the surface of the brainstem, 25° forward angle; stimulation 100 μA).
For ChR2 recording experiments (Fig. 5,6, Extended Data Fig. 4,5,7a,8), an optical fiber (200 μm; ThorLabs) attached to a 473 nm diode laser (CrystaLaser) was placed dorsal to the LRN (1.0-1.5 mm caudal to obex; 1.3 mm ipsilateral from the midline; 0.4 mm dorsal to 1.2 mm ventral from the surface of the brainstem). Stimulation consisted of 1-15 ms pulse widths of light at 2-20 Hz, with laser strength calibrated to 1-13 mW at the fiber tip. For recording of light-induced synaptic activation of LRN neurons (Fig. 5a, Extended Data Fig. 4, Extended Data Fig. 7a, Extended Data Fig. 8b; n = 12 mice), single unit and field recordings were made with a glass microelectrode or tungsten electrode inserted into the LRN (1.0-1.5 mm caudal to obex, 1.3 mm ipsilateral from the midline, 1.1-1.5 mm ventral from the surface of the brainstem, 25° forward angle), and LRN neurons were antidromically identified and collision tests performed via tungsten electrode stimulation from the cerebellar white matter (2.5-3.0 mm rostral to obex, 0.5-1.5 mm ipsilateral from the midline, 1.5 mm ventral from the surface of the cerebellum, 25° forward angle; stimulation 20-100 μA). When recording in the vicinity of LRN neurons during PN terminal photo-stimulation, we observed a small negative field potential occurring after the onset of the light pulse, most likely caused by LRN neuron depolarization. Thus the onset of the local depolarization is designated as the onset of this negative-going field potential (Fig. 5a).
For single unit recordings examining antidromic effects of LRN photo-stimulation (Fig. 5b-d, Extended Data Fig. 5; n = 6 mice), a glass microelectrode was used to identify PNs, as described above. Expression of ChR2 was assessed in these PNs by exposing the surface of the spinal cord to 15 ms pulses of light at 2-20 Hz, with laser strength calibrated to ~10-13 mW at the fiber tip. After repositioning the light to the LRN, we found no evidence for antidromic activation of these PNs, though antidromic spikes could always be elicited by electrical stimulation in the LRN.
To measure motor effects of photo-stimulation (Fig. 6e,f, Extended Data Fig. 7a,8c; n = 8 mice), intracellular motor neuron recordings and field recordings in spinal cord ventral gray matter were performed while photo-stimulating PN somata or terminals in the LRN, as described above. To lesion LRN projections to the cerebellum (Fig. 6f, Extended Data Fig. 8a,b), a small sharpened spatula was used to bilaterally sever the inferior cerebellar peduncles (ICP) via insertion between the brainstem and cerebellum (n = 4 mice). Complete removal of the cerebellum was accomplished via aspiration with a glass capillary (n = 1 mouse). Field and single unit recordings in the LRN confirmed that lesions did not disrupt synaptic activation of LRN neurons (Extended Data Fig. 8b), and MLF stimulation was performed to verify post-lesion physiological integrity of the cord. The area under the field potential curve was quantified before and after lesion. For all jitter analysis, variance was calculated as the square of the s.d. of spiking or EPSP onset, with respect to the shortest latency response.
Antibodies
Primary antibodies: rabbit anti-GFP (1:500, Invitrogen); sheep anti-GFP (1:1000, AbD Serotec); mouse anti-SV2 (1:100, Developmental Studies Hybridoma Bank); goat anti-ChAT (1:200, Millipore); guinea pig anti-VGluT2 (1:3000, Millipore); mouse anti-Cre (1:500, Millipore); goat anti-CTB (1:8000, List Biological Laboratories); mouse anti-CTB (1:500, Abcam); goat anti-WGA (1:500, Vector Labs); rabbit anti-tdTomato (1:1000, Clontech; Living Colors DsRed); and goat anti-DTR (1:400, Santa Cruz Biotechnology; HBEGF). Appropriate fluorophore-conjugated secondary antibodies were from the Jackson ImmunoReseach antibody series.
Immunohistochemistry and imaging
Mice were transcardially perfused with 4% paraformaldehyde 0.1M phosphate buffer fixative. For vibratome brain sections, tissue was postfixed overnight, washed and sectioned along the sagittal plane at 100 μm. For cryostat spinal cord sections, tissue was postfixed for 2 hours, washed, equilibrated in 30% sucrose 0.1M phosphate buffer solution for 2 days, embedded in O.C.T., frozen on dry ice and sectioned along the axial plane at 19 μm onto glass slides. Immunohistochemistry was performed on tissue through sequential exposure to primary antibodies (overnight at 4°C) and fluorophore-conjugated secondary antibodies (3 hours at room temperature). Hoechst nuclear stain (Invitrogen) was applied for 10 minutes at room temperature at 1:20,000 dilution following secondary antibody wash. NeuroTrace 640/660 fluorescent Nissl stain (Invitrogen) was applied for 30 minutes at room temperature at 1:300 dilution following secondary antibody wash. Sections were mounted using Fluoromount-G (SouthernBiotech) and coverslipped for imaging. Confocal images were taken with an LSM 710 microscope (Carl Zeiss). A motorized stage was used to facilitate the creation of montage images and z-axis image stacks.
Statistics
Results are expressed as the mean +/− s.e.m. or s.d., as indicated. For evaluation of wild type kinematics (comparing 14 reach parameters) and for analysis of field potential reduction after cerebellar lesion, two-tailed paired t tests were used. For evaluation of reach success and kinematic, digit extension and ladder walk comparison in DT ablation experiments, two-way repeated-measures ANOVA was used, enabling within-mouse pairing of data. For ChR2 kinematic comparison, because not all mice had ‘no light hits’, two-way ANOVA was used. To permit use of two-way ANOVA, post-manipulation ‘hits’, which were only present in control and not in experimental mice during the kinematic assay, were not considered for kinematic statistical analysis. Bonferroni and Tukey post hoc multiple comparisons tests were performed, as indicated. P < 0.05 was considered significant.
Extended Data
Extended Data Figure 1. LRN-projecting V2a INs are restricted to cervical segments.

a, AAV-FLEX-hChR2-YFP was injected unilaterally into C6-T1, mid thoracic and mid lumbar spinal cord of adult Chx10-Cre mice. YFP+ projections to the LRN could be identified following C3-C4 (see Fig. 2) and C6-T1 V2a IN transduction, but were minimal or absent following thoracic or lumbar transduction. b, Dual injection of CTB into the LRN (red) and WGA into triceps brachii muscle (blue) labeled YFP+ V2a INs (green) in intermediate levels of cervical cord in Chx10-Cre;Rosa-lsl-YFP mice. CTB also labeled YFPoff neurons, potentially corresponding to inhibitory PNs46.
Extended Data Figure 2. 3D kinematics of mouse reaching.
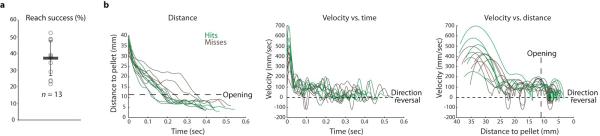
a, Following training, mice exhibited a high degree of variability in success in the multi-reach assay (37.0% +/− 10.4% s.d.; n = 13). Error bars indicate s.d. The mean s.d. of reach success from day to day across mice was 10.2% +/− 4.1% s.d. (n = 13). b, Individual reach plots of paw distance to pellet, velocity vs. time and velocity vs. distance to pellet from a representative mouse. Transition from the early reach phase to the late grab phase of the movement is delineated by the box opening (large dashes). Velocity crossings of zero (small dashes) indicate reversals in direction toward or away from the pellet. See Fig. 3d for mean plots from the same mouse.
Extended Data Figure 3. Ablation of C3-T1 V2a INs selectively perturbs reaching.

a, AAV-FLEX-DTR-GFP plasmid DNA was transfected into 293T cells. Only when co-transfected with a Cre-expressing plasmid (red; middle panel) did recombination occur, resulting in expression of DTR (red; right panel) and GFP. b, After viral injection into C3-T1 of adult Chx10::tdT mice, 83% (+/− 0.3% s.e.m.; n = 2) of tdT+ V2a IN cell bodies co-expressed GFP and DTR. After DT administration, there was an 84% (+/− 9% s.e.m.; n = 2) reduction in the number of tdT+ V2a INs in C3-T1. Error bars indicate s.e.m. c, No GFP+ V2a INs (arrowheads) were found in mid thoracic or lumbar segments prior to DT administration, and normal numbers of V2a INs remained following DT administration (arrowheads). d, Success in the multi-reach task quantified by day from a representative DTR-transduced mouse (black) and control mouse (gray). Viral injection did not affect success rate, while subsequent DT administration reduced success in the DTR-transduced but not control mouse. See Fig. 4d for mean success rates across mice (pre-DT, 41.3% +/− 8.3% s.e.m.; post-DT, 20.7% +/− 6.7% s.e.m; n = 3 DTR, n = 4 control; two-way repeated-measures ANOVA, interaction of group × toxin: F1,5 = 6.67, P = 0.049; post-hoc Bonferroni test, DT: P < 0.05). e, Individual reach trajectories and mean kinematics from a representative DTR-transduced mouse reveal perturbation of trajectory, duration and velocity following ablation. There were no successful reaches in the kinematic assay following V2a IN ablation (Supplementary Note 4). See Fig. 4e for individual reach plots from the same mouse. f, Individual and mean reach kinematics from a representative control mouse show no effects of DT administration. Shaded regions indicate s.d. g, In DTR-transduced mice relative to control mice, mean paw velocity decreased (n = 3 DTR, n = 4 control; two-way repeated-measures ANOVA, interaction of group × condition, reach phase: F2,10 = 8.315, P = 0.008; post-hoc Tukey test, DTR pre-DT hits vs. post-DT misses, P < 0.01; grab phase: F2,10 = 0.063, P = 0.55) and mean duration of paw movement increased (reach phase: F2,10 = 15.37, P = 0.0009; post-hoc Tukey test, DTR pre-DT hits vs. post-DT misses, P < 0.0001, DTR pre-DT misses vs. post-DT misses, P < 0.01; grab phase: F2,10 = 0.99, P = 0.40) during the reach phase but not the grab phase following ablation. As shown in Fig. 4f, the mean number of direction reversals increased during the reach, but not the grab, phase in DTR-transduced mice, relative to control mice (reach phase: F2,10 = 19.03, P = 0.0004; post-hoc Tukey test, DTR pre-DT hits vs. post-DT misses, P < 0.001, DTR pre-DT misses vs. post-DT misses, P < 0.001; grab phase: F2,10 = 2.64, P = 0.12). Shapes represent individual mice and black circles indicate means across mice. See Extended Data Table 1. h, Digit abduction (maximum distance between digits 2 and 4) during grasp attempts was unaffected by V2a IN ablation (n = 3 DTR, n = 4 control; twoway repeated-measures ANOVA, F1,5 = 0.088, P = 0.78). i, V2a IN ablation had no effect on the mean number of mistakes in right forepaw placement during a horizontal ladder locomotion test (n = 3 DTR, n = 3 control; two-way repeated-measures ANOVA, F1,4 = 3.53, P = 0.13). Moreover, ablation had no effect on the types of mistakes made (stagger, slip, or miss; n = 3 DTR, n = 3 control; two-way repeated-measures ANOVA, stagger: F1,4 = 2.49, P = 0.19; slip: F1,4 = 0.41, P = 0.56; miss: F1,4 = 5.17, P = 0.09). Error bars indicate s.e.m.
Extended Data Figure 4. Selective photo-activation of PN input to the LRN.

a, Population recordings in the LRN revealed photo-stimulation induced synaptic activation of LRN neurons across a range of optical fiber depths in and above the brainstem. Retraction of the optical fiber from the LRN (presumably resulting in a decrease in light exposure) resulted in a reduced amplitude of the LRN extracellular field potential (arrow), and, consequently in an increase in LRN neuronal firing latency. Schematic depicts coronal section of caudal brainstem and optical fiber depths. Sp5c, spinal trigeminal nucleus, caudal part; MLF, medial longitudinal fasciculus; IO, inferior olive; Pyr, pyramidal tract. b, Extracellular recording of LRN neurons antidromically activated from cerebellum (CB; 20 μA; purple arrows), with the optical fiber just dorsal to the LRN, revealed activation (blue arrows) and spike collision (red arrowheads) across a range of laser intensities (also see Fig. 5a). Increasing the light intensity caused more intense synaptic firing and a slight shortening of the latency from light onset. c, Extracellular recording of LRN neurons in control mice revealed no activation and no collision of the electrically-induced antidromic spike from the cerebellum (purple arrows) during photo-stimulation (n = 0/14 neurons).
Extended Data Figure 5. Photo-activation of PN terminals in the LRN does not elicit antidromic spikes.
a, PNs in C6 were identified antidromically by electrical stimulation from the LRN (40 μA; arrows) and C7 ventral horn (40 μA; not shown) and by spike collision (not shown). b, Cervical photo-stimulation of the same PN cell bodies activated 69.2% of PNs (n = 9/13; green arrows indicate single spikes), as identified by collision of the LRN antidromic spike (lower red traces; red arrowheads; compare with antidromic spike in a; two lower black traces exhibit failed collision). c, In the same PNs, photo-stimulation of PN terminals in the LRN did not trigger antidromic spikes that invaded the cell body (0/31 PNs; 0/3 in control mice), whereas electrical stimulation in the LRN always produced antidromic spikes (lower traces; arrow; compare with antidromic spike in a). Also see Fig. 5b-d.
Extended Data Figure 6. Selective photo-stimulation of PN terminals in the LRN perturbs reaching.

a, Mean reach kinematics from a representative mouse with perturbed reach trajectory and large fluctuations in velocity and acceleration during PN terminal photo-stimulation. See Fig. 6c for individual reach plots from the same mouse. As shown in Fig. 6b, photo-stimulation reduced success in the multi-reach task in ChR2 vs. control mice (no light, 35.7% +/− 6.5% s.e.m.; light, 18.3% +/− 3.8% s.e.m.; n = 5 ChR2, n = 4 control; two-way repeated-measures ANOVA, interaction of group × light: F1,7 = 8.65, P = 0.02; post-hoc Bonferroni test, ChR2: P < 0.001). There were no successful reaches in the kinematic assay during PN terminal photo-stimulation (Supplementary Note 4). b, Individual and mean reach kinematics from a representative control mouse show no effects of LRN photo-stimulation. Shaded regions indicate s.d. c, As shown in Fig. 6d, the mean number of direction reversals during the reach phase increased during photo-stimulation in ChR2 mice, relative to control mice (n = 5 ChR2, n = 4 control; two-way ANOVA, interaction of group × condition, reach phase: F2,19 = 5.24, P = 0.02; post-hoc Tukey test, ChR2 no light hits vs. light misses, P < 0.01, ChR2 no light misses vs. light misses, P < 0.01; grab phase: F2,19 = 2.70, P = 0.09). In addition, photo-stimulation resulted in severe kinematic perturbation during the entire movement (reach and grab phases) in ChR2 mice relative to control mice, including increases in: the mean amount of time spent moving away from the pellet (F2,19 = 4.07, P = 0.03; post-hoc Tukey test, ChR2 no light hits vs. light misses, P < 0.01, ChR2 no light misses vs. light misses, P < 0.01); the mean minimum distance from the paw to the pellet (F2,19 = 6.37, P = 0.008; post-hoc Tukey test, ChR2 no light hits vs. light misses, P < 0.0001, ChR2 no light misses vs. light misses, P < 0.001); the mean peak velocity away from the pellet (F2,19 = 9.08, P = 0.002; post-hoc Tukey test, ChR2 no light hits vs. light misses, P < 0.001, ChR2 no light misses vs. light misses, P < 0.001); the mean s.d. of the velocity (F2,18 = 25.02, P < 0.0001; post-hoc Tukey test, ChR2 no light hits vs. light misses, P < 0.0001, ChR2 no light misses vs. light misses, P < 0.0001); the mean peak acceleration and deceleration (acceleration: F2,19 = 10.08, P = 0.001; post-hoc Tukey test, ChR2 no light hits vs. light misses, P < 0.001, ChR2 no light misses vs. light misses, P < 0.0001; deceleration: F2,19 = 21.53, P < 0.0001; post-hoc Tukey test, ChR2 no light hits vs. light misses, P < 0.0001, ChR2 no light misses vs. light misses, P < 0.0001); and the mean s.d. of the acceleration (F2,18 = 29.21, P < 0.0001; post-hoc Tukey test, ChR2 no light hits vs. light misses, P < 0.0001, ChR2 no light misses vs. light misses, P < 0.0001). Shapes represent individual mice. Black circles indicate means across mice. See Extended Data Table 2. d, Digit abduction (maximum distance between digits 2 and 4) during grasp attempts was unaffected by photo-stimulation (n = 5 ChR2, n = 4 control; two-way repeated-measures ANOVA, F1,7 = 3.71, P = 0.10). Error bars indicate s.e.m.
Extended Data Figure 7. Variance of LRN neuronal spiking and motor neuron EPSPs during PN terminal photo-stimulation, and evaluation of electrically-induced antidromic action potentials in PNs.
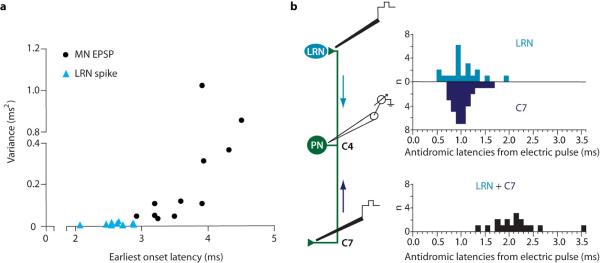
a, LRN neurons exhibited low jitter spiking (mean variance 0.009 +/− 0.006 ms2 s.d.; n = 9), consistent with monosynaptic input, during photo-stimulation of PN terminals in the LRN. This contrasts sharply with large motor neuron (MN) EPSP jitter during PN terminal photo-stimulation (mean variance 0.28 +/− 0.35 ms2 s.d.; n = 11), consistent with recruitment of a polysynaptic pathway. An ~30-fold increase in the variance for MN EPSPs as compared to LRN spiking can be seen. Variance was calculated with respect to the shortest latency response. b, Antidromic spiking of PN somata evoked by electrical stimulation of their ascending (LRN; light blue) and descending (C7; dark blue) axonal branches occurred with a mean latency of ~1 ms in each case, adding to a total conduction time of about 2 ms (black). Subtracting approximate axonal activation and two soma invasion times, which are likely each on the order of 0.4 ms19, provides an estimate for the conduction time of an antidromic action potential across both branches of the PN – in the ~1 – 1.2 ms range. See Supplementary Discussion.
Extended Data Figure 8. Photo-stimulation of PN input to the LRN before and after cerebellar lesion.

a, Post-physiology histology confirmed intact inferior cerebellar peduncles (ICP) in control mice and bilateral lesion of ICP (red arrowheads; n = 4) and complete removal of cerebellar cortex and deep cerebellar nuclei (n = 1) in experimental mice. b, Cerebellar lesions resulted in no change in LRN field potential size during PN terminal photo-stimulation (n = 2; two-tailed paired t-test). c, In non-lesioned mice, C7 field potential recordings revealed that photo-stimulation of PN terminals in the LRN (black traces) or PN somata in C4 (gray traces) elicited responses restricted to ventral regions of the gray matter, near motor neurons and their dendrites. Field onsets (arrowheads) were consistently longer following LRN vs. C4 photo-stimulation (also see Fig. 6e). Schematic depicts axial section of C7 and recording electrode depths. Roman numerals indicate Rexed laminae.
Extended Data Table 1.
Pre and post-V2a IN ablation kinematics. Kinematics across DTR-transduced and control mice (n = 3 DTR, n = 4 control; mean +/− s.e.m.; two-way repeated-measures ANOVA, interaction of group × condition). During the reach phase, but not the grab phase, V2a IN depleted mice displayed an increase in the frequency of forelimb direction reversals, a decrease in mean paw velocity and an increase in the total duration of paw movement. There were no successful reaches in the kinematic assay following V2a IN ablation (Supplementary Note 4). Kinematics were not affected in virus-spared control mice during either phase of movement. See Fig. 4e,f and Extended Data Fig. 3e-g (figure legends describe results of post-hoc Tukey tests).
| Reach phase | |||||||||
|---|---|---|---|---|---|---|---|---|---|
| AAV-DTR + DT (n = 3) | DT only control (n = 4) | ||||||||
| Pre-DT hit | Pre-DT miss | Post-DT miss | Pre-DT hit | Pre-DT miss | Post-DT hit | Post-DT miss | F2,10 | P value | |
| Direction reversals (#) | 0.49 +/− 0.14 | 1.28 +/− 0.17 | 4.49 +/− 0.59 | 0.63 +/− 0.48 | 1.60 +/− 0.56 | 0.17 +/− 0.17 | 0.48 +/− 0.38 | 19.03 | 0.0004 |
| Mean paw velocity (mm/sec) | 130.70 +/− 13.24 | 98.72 +/− 14.83 | 62.65 +/− 2.30 | 150.75 +/− 17.23 | 125.82 +/− 23.47 | 156.45 +/− 21.78 | 159.44 +/− 21.18 | 8.32 | 0.008 |
| Duration (sec) | 0.17 +/− 0.01 | 0.25 +/− 0.04 | 0.42 +/− 0.03 | 0.16 +/− 0.01 | 0.23 +/− 0.04 | 0.16 +/− 0.03 | 0.18 +/− 0.03 | 15.37 | 0.0009 |
| Grab phase | |||||||||
|---|---|---|---|---|---|---|---|---|---|
| AAV-DTR + DT (n = 3) | DT only control (n = 4) | ||||||||
| Pre-DT hit | Pre-DT miss | Post-DT miss | Pre-DT hit | Pre-DT miss | Post-DT hit | Post-DT miss | F2,10 | P value | |
| Direction reversals (#) | 4.07 +/− 2.03 | 2.74 +/− 1.13 | 1.66 +/− 0.27 | 0.27 +/− 0.16 | 0.95 +/− 0.20 | 1.43 +/− 0.41 | 0.53 +/− 0.20 | 2.64 | 0.12 |
| Mean paw velocity (mm/sec) | 34.96 +/− 4.47 | 32.47 +/− 5.57 | 31.62 +/− 8.05 | 67.19 +/− 11.57 | 69.10 +/− 13.79 | 68.58 +/− 12.28 | 76.36 +/− 10.75 | 0.06 | 0.55 |
| Duration (sec) | 0.19 +/− 0.04 | 0.18 +/− 0.01 | 0.14 +/− 0.02 | 0.10 +/− 0.01 | 0.09 +/− 0.02 | 0.13 +/− 0.03 | 0.09 +/− 0.01 | 0.99 | 0.40 |
Extended Data Table 2.
Kinematics with and without PN terminal photo-stimulation. Kinematics across AAV-ChR2 and control mice (n = 5 ChR2, n = 4 control; mean +/− s.e.m.; two-way ANOVA, interaction of group × condition). The mean number of direction reversals increased during the reach phase, but not the grab phase, during photo-stimulation in ChR2 mice, relative to control mice. Photostimulation resulted in severe kinematic perturbation during the entire movement (reach and grab phases) in ChR2 mice relative to control mice, including increases in: the mean amount of time spent moving away from the pellet; the mean minimum distance from the paw to the pellet; the mean peak velocity away from the pellet; the mean s.d. of the velocity; the mean peak acceleration and deceleration; and the mean s.d. of the acceleration. There were no successful reaches in the kinematic assay during PN terminal photo-stimulation in AAV-ChR2 mice (Supplementary Note 4). Kinematics were not affected in virusspared control mice during either phase of movement. See Fig. 6c,d and Extended Data Fig. 6a-c (figure legends describe results of post-hoc Tukey tests).
| Reach phase | |||||||||
|---|---|---|---|---|---|---|---|---|---|
| AAV-ChR2(n = 5) | Control (n = 4) | ||||||||
| No light hit | No light miss | Light miss | No light hit | No light miss | Light hit | Light miss | F2,19 | P value | |
| Direction reversals (#) | 2.13 +/− 0.34 | 1.97 +/− 0.62 | 8.82 +/− 2.37 | 1.89 +/− 0.92 | 0.62 +/− 0.20 | 0.33 +/− 0.24 | 0.91 +/− 0.33 | 5.24 | 0.02 |
| Grab phase | |||||||||
|---|---|---|---|---|---|---|---|---|---|
| AAV-ChR2 (n = 5) | Control (n = 4) | ||||||||
| No light hit | No light miss | Light miss | No light hit | No light miss | Light hit | Light miss | F2,19 | P value | |
| Direction reversals (#) | 0.83 +/− 0.32 | 1.39 +/− 0.49 | 6.26 +/− 2.34 | 1.89 +/− 0.10 | 1.59 +/− 0.36 | 1.67 +/− 0.47 | 1.99 +/− 0.50 | 2.70 | 0.09 |
| Reach and grab phase | |||||||||
|---|---|---|---|---|---|---|---|---|---|
| AAV-ChR2 (n = 5) | Control (n = 4) | ||||||||
| No light hit | No light miss | Light miss | No light hit | No light miss | Light hit | Light miss | F2,19 | P value | |
| Time moving away (sec) | 0.03 +/− 0.01 | 0.04 +/− 0.01 | 0.17 +/− 0.05 | 0.04 +/− 0.01 | 0.03 +/− 0.01 | 0.02 +/− 0.001 | 0.04 +/− 0.01 | 4.07 | 0.03 |
| Min. distance (mm) | 4.26 +/− 0.14 | 5.00 +/− 0.27 | 7.91 +/− 0.87 | 4.01 +/− 0.16 | 5.41 +/− 0.27 | 4.05 +/− 0.02 | 5.17 +/− 0.16 | 6.37 | 0.008 |
| Peak velocity away (mm/sec) | −52.57 +/− 11.44 | −41.55 +/− 11.62 | −202.70 +/− 27.42 | −98.65 +/− 60.36 | −45.96 +/− 6.42 | −18.87 +/− 0.55 | −45.58 +/− 5.92 | 9.08 | 0.002 |
| s.d. of velocity (mm/sec) | 57.92 +/− 2.65 | 56.96 +/− 3.56 | 121.88 +/− 6.95 | 48.31 +/− 1.49 | 64.30 +/− 3.22 | 40.24 +/− 7.56 | 65.29 +/− 4.64 | 25.02 | <0.0001 |
| Peakaccel. (mm/sec2; × 102) | 15.07 +/− 2.77 | 14.79 +/− 2.33 | 35.12 +/− 2.74 | 24.01 +/− 5.33 | 17.98 +/− 1.00 | 16.06 +/− 1.78 | 19.49 +/− 1.47 | 10.08 | 0.001 |
| Peak decel. (mm/sec2; × 102) | −13.64 +/− 1.76 | −16.50 +/− 1.91 | −35.61 +/− 1.55 | −18.77 +/− 3.55 | −15.55 +/− 0.45 | −13.08 +/− 1.21 | −16.94 +/− 0.67 | 21.53 | <0.0001 |
| s.d. of accel. (mm/sec2; × 102) | 4.55 +/− 0.71 | 4.19 +/− 0.47 | 13.37 +/− 0.88 | 3.23 +/− 0.12 | 4.78 +/− 0.40 | 3.74 +/− 0.38 | 4.99 +/− 0.17 | 29.21 | <0.0001 |
Supplementary Material
Supplementary Video 1. Kinematics of a successful reach. High-resolution, high-speed capture of reaching movements from two cameras placed ~80° apart for tracking of infrared-reflective markers attached to the back of the right paw. Plots of 3D paw trajectory and velocity vs. distance to pellet for a successful reach (green) are shown. Pellet location marked with asterisk. Transition from the early reach phase to the late grab phase of the movement is delineated by the box opening (vertical dashes). Velocity crossings of zero (horizontal dashes) indicate reversals in direction toward or away from the pellet. The video is slowed to approximately 6% real time.
Supplementary Video 2. Kinematics of an unsuccessful reach. Plots of 3D paw trajectory and velocity vs. distance to pellet for an unsuccessful reach (brown) by the same mouse shown in Supplementary Video 1. The video is slowed to approximately 6% real time.
Supplementary Video 3. Kinematics following ablation of C3-T1 V2a INs. Plots of 3D paw trajectory and velocity vs. distance to pellet for an unsuccessful reach following cervical V2a IN ablation (red) by the same mouse shown in Supplementary Videos 1 and 2. Note the higher frequency of paw direction reversals, the increase in reach duration and the reduction in paw velocity during the reach phase (before the box opening). Normal digit abduction occurs as the paw approaches the pellet. The video is slowed to approximately 6% real time.
Supplementary Video 4. Kinematics with no photo-stimulation. Plots of 3D paw trajectory and velocity vs. distance to pellet for a successful reach (green) following injection of AAV-FLEX-hChR2-YFP and implantation of the fiberoptic ferrule, but with no photo-stimulation. The video is slowed to approximately 6% real time.
Supplementary Video 5. Kinematics during PN terminal photo-stimulation. Plots of 3D paw trajectory and velocity vs. distance to pellet for an unsuccessful reach (blue) during photo-stimulation of PN terminals in the LRN (473 nm, ~12 mW, 20 Hz, 15 ms pulse width) in the same mouse shown in Supplementary Video 4. Note the large increase in the number of direction reversals during the reach phase, the severe effects on trajectory and the large swings in velocity toward and away from the pellet. Normal digit abduction occurs as the paw approaches the pellet. The video is slowed to approximately 6% real time.
Acknowledgements
We thank L. Zagoraiou, S. Crone and Kamal Sharma for the Chx10-Cre mouse; T. Buch for the DTR-GFP construct; K. Deisseroth for the AAV-FLEX-hChR2-YFP plasmid; and M. Churchland for providing a low-pass filter. We are grateful to J. Krakauer for discussion of concepts in mammalian motor control and a lively debate about terminology and text, and T. Isa for comments and continuing discussion on primate forelimb movement. R. Axel, M. Churchland, D. Jabaudon, A. Karpova, A. Miri, N. Sawtell and C. Zuker also provided valuable discussion and comments on the manuscript. We are grateful to K. Miao for technical assistance; S. Fageiry for work on retrograde CTB labeling; T. Akay for assistance with the horizontal ladder task; D. Ng for the Cre-expressing plasmid; M. Mendelsohn, N. Zabello and S. Patruni for animal care; and B. Han, K. MacArthur, S. Morton and I. Schieren for technical assistance. E.A. is a Howard Hughes Medical Institute Fellow of the Helen Hay Whitney Foundation; J.J. was supported by grants to B.A. from Umeå University; B.A. was supported by grants from the Swedish Research Council; T.M.J was supported by NIH grant NS033245, the Harold and Leila Y. Mathers Foundation and Project A.L.S., and is an investigator of the Howard Hughes Medical Institute.
Footnotes
Author Contributions E.A., B.A. and T.M.J. designed the experiments and analyzed data. E.A. performed molecular, anatomical and behavioral experiments. B.A, J.J. and E.A. performed and analyzed electrophysiological experiments. E.A., B.A. and T.M.J. prepared the manuscript.
The authors declare no competing financial interests.
Supplementary Information is linked to the online version of the paper at www.nature.com/nature.
References
- 1.Iwaniuk AN, Whishaw IQ. On the origin of skilled forelimb movements. Trends Neurosci. 2000;23:372–376. doi: 10.1016/s0166-2236(00)01618-0. doi:S0166-2236(00)01618-0 [pii] [DOI] [PubMed] [Google Scholar]
- 2.Fitts PM. The information capacity of the human motor system in controlling the amplitude of movement. Journal of experimental psychology. 1954;47:381–391. [PubMed] [Google Scholar]
- 3.Morasso P. Spatial control of arm movements. Exp Brain Res. 1981;42:223–227. doi: 10.1007/BF00236911. [DOI] [PubMed] [Google Scholar]
- 4.Lawrence DG, Kuypers HG. The functional organization of the motor system in the monkey. I. The effects of bilateral pyramidal lesions. Brain : a journal of neurology. 1968;91:1–14. doi: 10.1093/brain/91.1.1. [DOI] [PubMed] [Google Scholar]
- 5.Lawrence DG, Kuypers HG. The functional organization of the motor system in the monkey. II. The effects of lesions of the descending brain-stem pathways. Brain : a journal of neurology. 1968;91:15–36. doi: 10.1093/brain/91.1.15. [DOI] [PubMed] [Google Scholar]
- 6.Lemon RN. Descending pathways in motor control. Annual review of neuroscience. 2008;31:195–218. doi: 10.1146/annurev.neuro.31.060407.125547. doi:10.1146/annurev.neuro.31.060407.125547. [DOI] [PubMed] [Google Scholar]
- 7.Prablanc C, Martin O. Automatic control during hand reaching at undetected two-dimensional target displacements. J Neurophysiol. 1992;67:455–469. doi: 10.1152/jn.1992.67.2.455. [DOI] [PubMed] [Google Scholar]
- 8.Messier J, Kalaska JF. Comparison of variability of initial kinematics and endpoints of reaching movements. Exp Brain Res. 1999;125:139–152. doi: 10.1007/s002210050669. [DOI] [PubMed] [Google Scholar]
- 9.Todorov E, Jordan MI. Optimal feedback control as a theory of motor coordination. Nat Neurosci. 2002;5:1226–1235. doi: 10.1038/nn963. doi:10.1038/nn963. [DOI] [PubMed] [Google Scholar]
- 10.Ito M. The cerebellum and neural control. Raven Press; 1984. [Google Scholar]
- 11.Wolpert DM, Miall RC, Kawato M. Internal models in the cerebellum. Trends in cognitive sciences. 1998;2:338–347. doi: 10.1016/s1364-6613(98)01221-2. [DOI] [PubMed] [Google Scholar]
- 12.Kawato M. Internal models for motor control and trajectory planning. Curr Opin Neurobiol. 1999;9:718–727. doi: 10.1016/s0959-4388(99)00028-8. [DOI] [PubMed] [Google Scholar]
- 13.Scott SH. Optimal feedback control and the neural basis of volitional motor control. Nat Rev Neurosci. 2004;5:532–546. doi: 10.1038/nrn1427. doi:10.1038/nrn1427. [DOI] [PubMed] [Google Scholar]
- 14.Shadmehr R, Krakauer JW. A computational neuroanatomy for motor control. Exp Brain Res. 2008;185:359–381. doi: 10.1007/s00221-008-1280-5. doi:10.1007/s00221-008-1280-5. [DOI] [PMC free article] [PubMed] [Google Scholar]
- 15.Alstermark B, Lundberg A. In: Muscle afferents and spinal control of movement. Jami L, Pierrot-Deseilligny E, Zytnicki D, editors. Pergamon; 1992. pp. 327–354. [Google Scholar]
- 16.Alstermark B, Isa T. Circuits for skilled reaching and grasping. Annual review of neuroscience. 2012;35:559–578. doi: 10.1146/annurev-neuro-062111-150527. doi:10.1146/annurev-neuro-062111-150527. [DOI] [PubMed] [Google Scholar]
- 17.Illert M, Jankowska E, Lundberg A, Odutola A. Integration in descending motor pathways controlling the forelimb in the cat. 7. Effects from the reticular formation on C3-C4 propriospinal neurones. Exp Brain Res. 1981;42:269–281. doi: 10.1007/BF00237494. [DOI] [PubMed] [Google Scholar]
- 18.Illert M, Lundberg A, Tanaka R. Integration in descending motor pathways controlling the forelimb in the cat. 3. Convergence on propriospinal neurones transmitting disynaptic excitation from the corticospinal tract and other descending tracts. Exp Brain Res. 1977;29:323–346. doi: 10.1007/BF00236174. [DOI] [PubMed] [Google Scholar]
- 19.Alstermark B, Kummel H, Pinter MJ, Tantisira B. Integration in descending motor pathways controlling the forelimb in the cat. 17. Axonal projection and termination of C3-C4 propriospinal neurones in the C6-Th1 segments. Exp Brain Res. 1990;81:447–461. doi: 10.1007/BF02423494. [DOI] [PubMed] [Google Scholar]
- 20.Alstermark B, Lindstrom S, Lundberg A, Sybirska E. Integration in descending motor pathways controlling the forelimb in the cat. 8. Ascending projection to the lateral reticular nucleus from C3-C4 propriospinal also projecting to forelimb motoneurones. Exp Brain Res. 1981;42:282–298. doi: 10.1007/BF00237495. [DOI] [PubMed] [Google Scholar]
- 21.Brodal A. Spinal afferents to the lateral reticular nucleus of the medulla oblongata in the cat; an experimental study. J Comp Neurol. 1949;91:259–295. doi: 10.1002/cne.900910206. incl 252 pl. [DOI] [PubMed] [Google Scholar]
- 22.Corvaja N, Grofova I, Pompeiano O, Walberg F. The lateral reticular nucleus in the cat--I. An experimental anatomical study of its spinal and supraspinal afferent connections. Neuroscience. 1977;2:537–553. doi: 10.1016/0306-4522(77)90050-1. [DOI] [PubMed] [Google Scholar]
- 23.Arshavsky YI, Gelfand IM, Orlovsky GN, Pavlova GA. Messages conveyed by spinocerebellar pathways during scratching in the cat. I. Activity of neurons of the lateral reticular nucleus. Brain Res. 1978;151:479–491. doi: 10.1016/0006-8993(78)91081-8. [DOI] [PubMed] [Google Scholar]
- 24.Alstermark B, Ekerot CF. The Lateral Reticular Nucleus: a precerebellar center providing the Cerebellum with overview and integration of motor functions at systems level.A new hypothesis. J Physiol. 2013;591:5453–5458. doi: 10.1113/jphysiol.2013.256669. doi:10.1113/jphysiol.2013.256669. [DOI] [PMC free article] [PubMed] [Google Scholar]
- 25.Alstermark B, Lundberg A, Norrsell U, Sybirska E. Integration in descending motor pathways controlling the forelimb in the cat. 9. Differential behavioural defects after spinal cord lesions interrupting defined pathways from higher centres to motoneurones. Exp Brain Res. 1981;42:299–318. doi: 10.1007/BF00237496. [DOI] [PubMed] [Google Scholar]
- 26.Kinoshita M, et al. Genetic dissection of the circuit for hand dexterity in primates. Nature. 2012;487:235–238. doi: 10.1038/nature11206. doi:10.1038/nature11206. [DOI] [PubMed] [Google Scholar]
- 27.Al-Mosawie A, Wilson JM, Brownstone RM. Heterogeneity of V2-derived interneurons in the adult mouse spinal cord. Eur J Neurosci. 2007;26:3003–3015. doi: 10.1111/j.1460-9568.2007.05907.x. doi:EJN5907 [pii] 10.1111/j.1460-9568.2007.05907.x. [DOI] [PubMed] [Google Scholar]
- 28.Lundfald L, et al. Phenotype of V2-derived interneurons and their relationship to the axon guidance molecule EphA4 in the developing mouse spinal cord. Eur J Neurosci. 2007;26:2989–3002. doi: 10.1111/j.1460-9568.2007.05906.x. doi:EJN5906 [pii] 10.1111/j.1460-9568.2007.05906.x. [DOI] [PubMed] [Google Scholar]
- 29.Pivetta C, Esposito MS, Sigrist M, Arber S. Genetic code of spinal neuronal subpopulations uncovers specificity of ascending connectivity matrix to brainstem. Cell. In press at. [Google Scholar]
- 30.Goulding M. Circuits controlling vertebrate locomotion: moving in a new direction. Nat Rev Neurosci. 2009;10:507–518. doi: 10.1038/nrn2608. doi:10.1038/nrn2608. [DOI] [PMC free article] [PubMed] [Google Scholar]
- 31.Alstermark B, Ogawa J. In vivo recordings of bulbospinal excitation in adult mouse forelimb motoneurons. J Neurophysiol. 2004;92:1958–1962. doi: 10.1152/jn.00092.2004. doi:10.1152/jn.00092.2004 [pii] [DOI] [PubMed] [Google Scholar]
- 32.Alstermark B, Kummel H. Transneuronal transport of wheat germ agglutinin conjugated horseradish peroxidase into last order spinal interneurones projecting to acromio- and spinodeltoideus motoneurones in the cat. 2. Differential labelling of interneurones depending on movement type. Exp Brain Res. 1990;80:96–103. doi: 10.1007/BF00228851. [DOI] [PubMed] [Google Scholar]
- 33.Whishaw IQ. An endpoint, descriptive, and kinematic comparison of skilled reaching in mice (Mus musculus) with rats (Rattus norvegicus). Behav Brain Res. 1996;78:101–111. doi: 10.1016/0166-4328(95)00236-7. doi:0166432895002367 [pii] [DOI] [PubMed] [Google Scholar]
- 34.Farr TD, Whishaw IQ. Quantitative and qualitative impairments in skilled reaching in the mouse (Mus musculus) after a focal motor cortex stroke. Stroke. 2002;33:1869–1875. doi: 10.1161/01.str.0000020714.48349.4e. [DOI] [PubMed] [Google Scholar]
- 35.Buch T, et al. A Cre-inducible diphtheria toxin receptor mediates cell lineage ablation after toxin administration. Nat Methods. 2005;2:419–426. doi: 10.1038/nmeth762. doi:10.1038/nmeth762. [DOI] [PubMed] [Google Scholar]
- 36.Farr TD, Liu L, Colwell KL, Whishaw IQ, Metz GA. Bilateral alteration in stepping pattern after unilateral motor cortex injury: a new test strategy for analysis of skilled limb movements in neurological mouse models. J Neurosci Methods. 2006;153:104–113. doi: 10.1016/j.jneumeth.2005.10.011. doi:10.1016/j.jneumeth.2005.10.011. [DOI] [PubMed] [Google Scholar]
- 37.Wu HS, Sugihara I, Shinoda Y. Projection patterns of single mossy fibers originating from the lateral reticular nucleus in the rat cerebellar cortex and nuclei. J Comp Neurol. 1999;411:97–118. doi: 10.1002/(sici)1096-9861(19990816)411:1<97::aid-cne8>3.0.co;2-o. [DOI] [PubMed] [Google Scholar]
- 38.Zhan X, Ryugo DK. Projections of the lateral reticular nucleus to the cochlear nucleus in rats. J Comp Neurol. 2007;504:583–598. doi: 10.1002/cne.21463. doi:10.1002/cne.21463. [DOI] [PubMed] [Google Scholar]
- 39.Rose MF, et al. Math1 is essential for the development of hindbrain neurons critical for perinatal breathing. Neuron. 2009;64:341–354. doi: 10.1016/j.neuron.2009.10.023. doi:10.1016/j.neuron.2009.10.023. [DOI] [PMC free article] [PubMed] [Google Scholar]
- 40.Bizzi E, Cheung VC, d'Avella A, Saltiel P, Tresch M. Combining modules for movement. Brain research reviews. 2008;57:125–133. doi: 10.1016/j.brainresrev.2007.08.004. doi:10.1016/j.brainresrev.2007.08.004. [DOI] [PMC free article] [PubMed] [Google Scholar]
- 41.Bui TV, et al. Circuits for Grasping: Spinal dI3 Interneurons Mediate Cutaneous Control of Motor Behavior. Neuron. 2013;78:191–204. doi: 10.1016/j.neuron.2013.02.007. doi:10.1016/j.neuron.2013.02.007. [DOI] [PMC free article] [PubMed] [Google Scholar]
- 42.Fink AJP, et al. Cosyne. Salt Lake City, UT: 2013. Spinal presynaptic inhibition promotes smooth limb trajectories during reaching. [Google Scholar]
- 43.Isa T, Ohki Y, Alstermark B, Pettersson LG, Sasaki S. Direct and indirect cortico-motoneuronal pathways and control of hand/arm movements. Physiology. 2007;22:145–152. doi: 10.1152/physiol.00045.2006. doi:22/2/145 [pii]10.1152/physiol.00045.2006. [DOI] [PubMed] [Google Scholar]
- 44.Carpenter MB, Nova HR. Descending division of the brachium conjunctivum in the cat a cerebello-reticular system. J Comp Neurol. 1960;114:295–305. doi: 10.1002/cne.901140307. [DOI] [PubMed] [Google Scholar]
- 45.Schultz W, Montgomery EB, Jr., Marini R. Proximal limb movements in response to microstimulation of primate dentate and interpositus nuclei mediated by brain-stem structures. Brain : a journal of neurology. 1979;102:127–146. doi: 10.1093/brain/102.1.127. [DOI] [PubMed] [Google Scholar]
- 46.Alstermark B, Lundberg A, Sasaki S. Integration in descending motor pathways controlling the forelimb in the cat. 10. Inhibitory pathways to forelimb motoneurones via C3-C4 propriospinal neurones. Exp Brain Res. 1984;56:279–292. doi: 10.1007/BF00236284. [DOI] [PubMed] [Google Scholar]
- 47.Fujita M. Adaptive filter model of the cerebellum. Biological cybernetics. 1982;45:195–206. doi: 10.1007/BF00336192. [DOI] [PubMed] [Google Scholar]
- 48.Dean P, Porrill J, Ekerot CF, Jorntell H. The cerebellar microcircuit as an adaptive filter: experimental and computational evidence. Nat Rev Neurosci. 2010;11:30–43. doi: 10.1038/nrn2756. doi:10.1038/nrn2756. [DOI] [PubMed] [Google Scholar]
- 49.Lundberg A. Function of the ventral spinocerebellar tract. A new hypothesis. Exp Brain Res. 1971;12:317–330. doi: 10.1007/BF00237923. [DOI] [PubMed] [Google Scholar]
- 50.Arshavsky YI, Gelfand IM, Orlovsky GN, Pavlova GA. Messages conveyed by spinocerebellar pathways during scratching in the cat. II. Activity of neurons of the ventral spinocerebellar tract. Brain Res. 1978;151:493–506. doi: 10.1016/0006-8993(78)91082-x. [DOI] [PubMed] [Google Scholar]
- 51.Murray AJ, et al. Parvalbumin-positive CA1 interneurons are required for spatial working but not for reference memory. Nat Neurosci. 2011;14:297–299. doi: 10.1038/nn.2751. doi:10.1038/nn.2751. [DOI] [PMC free article] [PubMed] [Google Scholar]
- 52.Zhang F, et al. Optogenetic interrogation of neural circuits: technology for probing mammalian brain structures. Nature protocols. 2010;5:439–456. doi: 10.1038/nprot.2009.226. doi:10.1038/nprot.2009.226. [DOI] [PMC free article] [PubMed] [Google Scholar]
Associated Data
This section collects any data citations, data availability statements, or supplementary materials included in this article.
Supplementary Materials
Supplementary Video 1. Kinematics of a successful reach. High-resolution, high-speed capture of reaching movements from two cameras placed ~80° apart for tracking of infrared-reflective markers attached to the back of the right paw. Plots of 3D paw trajectory and velocity vs. distance to pellet for a successful reach (green) are shown. Pellet location marked with asterisk. Transition from the early reach phase to the late grab phase of the movement is delineated by the box opening (vertical dashes). Velocity crossings of zero (horizontal dashes) indicate reversals in direction toward or away from the pellet. The video is slowed to approximately 6% real time.
Supplementary Video 2. Kinematics of an unsuccessful reach. Plots of 3D paw trajectory and velocity vs. distance to pellet for an unsuccessful reach (brown) by the same mouse shown in Supplementary Video 1. The video is slowed to approximately 6% real time.
Supplementary Video 3. Kinematics following ablation of C3-T1 V2a INs. Plots of 3D paw trajectory and velocity vs. distance to pellet for an unsuccessful reach following cervical V2a IN ablation (red) by the same mouse shown in Supplementary Videos 1 and 2. Note the higher frequency of paw direction reversals, the increase in reach duration and the reduction in paw velocity during the reach phase (before the box opening). Normal digit abduction occurs as the paw approaches the pellet. The video is slowed to approximately 6% real time.
Supplementary Video 4. Kinematics with no photo-stimulation. Plots of 3D paw trajectory and velocity vs. distance to pellet for a successful reach (green) following injection of AAV-FLEX-hChR2-YFP and implantation of the fiberoptic ferrule, but with no photo-stimulation. The video is slowed to approximately 6% real time.
Supplementary Video 5. Kinematics during PN terminal photo-stimulation. Plots of 3D paw trajectory and velocity vs. distance to pellet for an unsuccessful reach (blue) during photo-stimulation of PN terminals in the LRN (473 nm, ~12 mW, 20 Hz, 15 ms pulse width) in the same mouse shown in Supplementary Video 4. Note the large increase in the number of direction reversals during the reach phase, the severe effects on trajectory and the large swings in velocity toward and away from the pellet. Normal digit abduction occurs as the paw approaches the pellet. The video is slowed to approximately 6% real time.