

Abstract
A new method to decoupling of bacterial interactions measured by atomic force microscopy (AFM) into specific and nonspecific components is proposed. The new method is based on computing the areas under the approach and retraction curves. To test the efficacy of the new method, AFM was used to probe the repulsion and adhesion energies present between L. monocytogenes cells cultured at five pH values (5, 6, 7, 8 and 9) and silicon nitride (Si3N4). Overall adhesion energy was then decoupled into its specific and nonspecific components using the new method as well as using Poisson statistical approach. Poisson statistical method represents the most commonly used approach to decouple bacterial interactions into their components. For all pH conditions investigated, specific energies dominated the adhesion and a transition in adhesion and repulsion energies for cells cultured at pH 7 was observed. When compared, the differences in the specific and nonspecific energies obtained using Poisson analysis and the new method were on average 2.2% and 6.7%, respectively. The relatively close energies obtained using the two approaches demonstrate the efficacy of the new method as an alternative way to decouple adhesion energies into their specific and nonspecific components.
Keywords: Listeria monocytogenes, AFM, adhesion energy, repulsion energy, pH and Poisson model
Introduction
Bacteria are dependent on substratum attachment for optimal growth and development [1]. Once on a surface, bacterial cells establish their initial attachment via a combination of specific and nonspecific energies [2] in a two-step process [3]. The first step is called the docking stage and represents the initial nonspecific reversible unicellular attachment to a surface. This step is dominated by long-range interactions (>50 nm) such as dispersion, van der Waals, electrostatic and Lewis acid-base hydrophobic interactions [2, 3]. These interactions are affected by physiochemical properties of bacterial cells and substrates such as wettability, roughness, and charge [4-7]. In addition, the pH and ionic strength of the medium in which bacterial interactions are taking place are important to consider [3]. In the literature, these interactions are generally quantified using one form or another of the Derjaguin-Landau-Verwey-Overbeek (DLVO) theory of colloidal stability [8-11].
Once a bacterial cell is in close proximity to a surface of interest, specific interactions come into play in the locking stage [2]. These specific interactions are irreversible short-range (< 1 nm) interactions and can be categorized as i) chemical interactions such as dipole-dipole interactions, dipole-induced dipole interactions, ion-dipole interactions and hydrogen bonding [3] and/or ii) biological ligand-receptor energies. Biopolymeric molecules present on the bacterial surface, such as pili, proteins, fimbriae, lipopolysaccharides (LPS) and capsular polysaccharides, are thought to play a role in mediating the specific energies [4]. From a thermodynamic perspective, bacterial adhesion to surfaces can be promoted by minimizing the Gibbs free energy [3]. In order to understand the mechanisms involved in bacterial adhesion to surfaces, it is of great importance to not only measure the overall strength of bacterial adhesion but to as well decouple these interactions into their specific and nonspecific components.
AFM has been extensively used to quantify the overall strengths of bacterial adhesion to a variety of model inert surfaces [12]. Although such studies are interesting, the types of energies that dominate the bacterial adhesion process remain elusive. Decoupling of the overall AFM adhesion interactions into specific and nonspecific components thus can lead to fundamental understanding of how to control the adhesion process. Traditionally, decoupling of the overall adhesion into specific and nonspecific components was largely done by applying statistical analysis methods, such as Poisson analysis [13, 14] or Weibull analysis [15] to the AFM measured adhesion data. Decoupling of bacterial adhesion using statistical analyses relies on two assumptions. First, the overall adhesion develops as the sum of discrete bond interactions and second these bonds form randomly and all have similar forces or energies [16]. In addition, it requires the sampling of many adhesion events [17] to account for the heterogeneous nature of the bacterial surface [18]. Even when many adhesion events are collected, statistical functions may sometimes prove incapable of describing the adhesion data; in which case overall adhesion cannot be easily decoupled into its components with statistical-based methods.
In this study, motivated by the difficulties underlying the application of statistical analyses to decouple the overall adhesion strength into its specific and nonspecific components, we propose an alternative approach. In our methodology, the area under the approach force-distance curve is assumed to represent the nonspecific repulsive energies measured between the AFM tip and the bacterial surface. In comparison, the area under the retraction force-distance curve is assumed to represent the overall specific and nonspecific components of the adhesion energy. The difference between the absolute magnitudes of the two areas will thus represent the specific adhesion energies.
Our new approach was applied to adhesion measurements collected between the pathogenic Listeria monocytogenes EGDe strain grown at five different pH conditions of growth and Si3N4 under water. L. monocytogenes are food-borne opportunistic pathogens responsible for a wide range of clinical diseases including meningitis and septicemia [19]. Several outbreaks of food-borne disease cases as well as massive food product recalls have been recorded worldwide due to the consumption of food contaminated with L. monocytogenes [20]. The ability of this bacterium to grow in diverse environmental conditions, for instance low pH [21], along with its capability to adhere to inert surfaces and persist in industrial environments, make its presence in food processing plants a major concern [22]. The attached cells to inert surfaces eventually form a reservoir for re- or cross-contamination of the food products throughout the food processing chain [23], hence it only takes a few cells to affect product safety and cause food poisoning [21]. Understanding the types of energies that govern initial bacterial adhesion to surfaces is thus crucial in optimizing and designing the environmental conditions and surface coatings under which bacterial adhesion can be minimized or prevented.
Materials and Methods
Bacterial cultures
Pathogenic Listeria monocytogenes EGDe was obtained from Prof. Mark Lawrence, an associate professor at the Department of Basic Sciences, the College of Veterinary medicine at Mississippi State University. Among the highly pathogenic L. monocytogenes strains, EGDe was chosen as our model strain because it has a fully sequenced and annotated genome [24]. The strain was activated by growing for 12 h at 37 °C in a temperature controlled shaker rotating at a 150 rpm in brain heart infusion broth (BHIB). Following activation, 1% of the activated culture was transferred into 20 ml of BHIB adjusted to different pH values (5, 6, 7, 8 and 9) using 2 N HCl or 2 N NaOH. The pH range investigated herein was chosen to mimic the acidity of the environments encountered by L. monocytogenes in vitro [25]. The optical density was recorded every hour at a wavelength of 600 nm to obtain complete growth curves of cells. Cells for each tested pH value were cultured in three replicates to ensure reproducibility. Cells were harvested at the late exponential phase of growth.
Atomic force microscopy (AFM) experiments
Bacterial cells were attached to gelatin-coated mica disks according to previously published protocols [26]. All AFM experiments were performed with a PicoForce™ scanning probe microscope with Nanoscope IIIa controller and extender module (Bruker AXS Inc., Santa Barbara, CA). Si3N4 cantilevers (DNP-S, Bruker AXS Inc., Santa Barbara, CA) were used in all experiments. The force constant of each cantilever was determined prior to experiments and was found to be 0.07 ± 0.01 N/m (n = 5) on average [27]. Force measurements were performed on fifteen locations on each cell for fifteen cells from three different cultures. For further details on parameters used in measuring bacterial adhesion energies, please see supplementary materials.
Analysis of AFM retraction and approach curves for adhesion and repulsion energies, respectively
Retraction curves were considered individually because of the complex and heterogeneous nature of the interactions observed between the bacterial surface biopolymers and the AFM Si3N4 cantilever [12, 28, 29]. Bacterial adhesion was quantified in terms of adhesion energy measured upon retraction of the AFM cantilever from the bacterial surface (Er). For each retraction curve, the adhesion energy was computed as the area under the retraction force-distance curve with the baseline taken at zero force (Figure 1A). In general, force and energy are correlated such as [30]:
| (1) |
where F is the pull-off force, h is the tip-sample separation distance and h1 and h2 are the first and last distance points at which the retraction curve crosses the zero force axis (Figure 1A). The integral in eq. 1 was evaluated as described previously [31]. Representative retraction curves for all investigated pH conditions are provided in Figure S1-A in the supplementary materials.
Figure 1.

(A) An example of an AFM retraction curve of L. monocytogenes EGDe cultured in BHIB at pH 7. The gray shadowed area represents the adhesion energy in aJ. The black arrows at the top of the curve indicate the bounds of integration where the adhesion energy was computed using eq. 1. (B) An example of an AFM approach curve of L. monocytogenes EGDe cultured in BHIB at pH 7. The gray shadowed area represents the repulsion energy in aJ. The black arrows at the top of the curve indicate the bounds of integration where the repulsion energy was computed using eq. 2.
Similarly, the area under the approach force-distance curve was calculated to obtain the repulsion energy measured upon approach of the AFM cantilever to the bacterial surface (Ea) (Figure 1B). The repulsive energy can be calculated using Trapezoidal rule as [32]:
| (2) |
Where F̂ is the repulsive force measured between the AFM cantilever and the sample upon approach, and h is the tip-sample separation distance. In eq. 2, h3 and h4 were taken as the distance points at which the approach curve crosses the zero force and zero separation distance axes, respectively (Figure 1B), and n was equal to the number of data points collected per approach curve in the integral interval and varied from one curve to another. In computing the integral in eq. 2, a uniform grid was used. Representative force-distance approach curves for all investigated pH conditions of growth are shown in Figure S1-B in the supplementary materials.
In evaluating the adhesion energy, note that the pull-off forces used in equation 1 are negative while the distances are positive. Equation 1 will result in positive adhesion energies due to the presence of a negative sign in front of the equation. In comparison, repulsion energies measured upon approach will be negative due to the positive forces and positive distances used in equation 2. In this manuscript, positive energies are attractive and negative energies are repulsive.
Poisson statistical analysis of adhesion energies quantified between bacterial surface biopolymers and silicon nitride in water
The overall cellular adhesion force measured using AFM can be decoupled into specific and nonspecific forces using a Poisson statistical analysis method developed originally by Beebe et al. [13]. Beebe et al. have utilized the fact that only van der Waals interactions can present between a gold-coated tip and a gold-coated surface and that only hydrogen bonds can be available between a bare silicon nitride tip and a mica surface to develop a statistical method that utilizes Poisson dynamic peak probability function to decouple AFM data into specific forces (hydrogen bonds) and nonspecific forces (electrostatic and van der Waals forces) [17]. Later on, Chen et al. applied the Poisson statistical analysis to adhesion energy data measured between bacteria and surfaces using AFM [33]. The application of Poisson analysis to decouple bacterial adhesion forces into their main components requires two assumptions [13]. First, the adhesion force (F) develops as the sum of discrete bond interactions and second these bonds form randomly and all have similar forces (Fi) [16]. A sampling of many of these events produces a mean measured adhesion force (μF). However, since applying Poisson statistical analysis to the bacterial adhesion force data involves the tedious task of identifying the magnitudes of many adhesion peaks registered in the AFM retraction force-distance curves, a new simpler way of utilizing Poisson analysis to investigate the interactions that dominate bacterial adhesion to surfaces was proposed by Chen et al. [33]. In their method, the Poisson analysis was applied to bacterial adhesion energies (E). The adhesion energies represented the free energy required to detach a bacterium from a substratum surface [33]. Adhesion energy can be calculated as the area under the retraction force-distance curve (eq. 1, Figure 1A). The assumptions required to apply Poisson analysis to the adhesion forces are assumed to be valid for applying the Poisson analysis to the adhesion energy data [33], i.e., (1) the adhesion energy (E) develops as the sum of discrete bond-rapture energies and (2) these bonds form randomly and all have similar bond energy values (Ei). For the purposes of Poisson analysis of the adhesion data, each retraction force-distance curve represents an independent bacterial detachment event from the inert surface.
Applying Poisson analysis to the adhesion energy data has several advantages over that of applying the analysis to the adhesion forces. First, calculating the area under the retraction force-distance curve can be easily automated. Second, the area computed is independent of user choices. Third, it is known that the long-range components of adhesion forces or energies decay with distance, therefore it is more reasonable to assume that the long-range energy is invariant among the different force-distance retraction curves than to assume that the long-range force to be constant among the different individual adhesion peaks [33]. Applying Poisson analysis to the adhesion energy data has also its disadvantages. First, applying the method requires the collection of a larger number of retraction curves compared to when forces are being analyzed by the Poisson analysis [33]. Second, the adhesion energies represent the mean of the adhesion interactions and thus can mask interesting data that result from individual events.
Applying Poisson statistical distribution to adhesion energy data requires first the distribution of adhesion energy data to be well fit by the Poisson distribution function [34]:
| (3) |
In equation 1, P(n; μE) is the probability of observing a certain magnitude of adhesion energies, n represents the various magnitudes of adhesion energies and/or various numbers of bonds formed; the probability of which is given by the function described by eq. 3 and μE is the mean measured adhesion energy. Note that n is an integer number. To obtain μE, a sampling of many of adhesion energy events is required. The adhesion energy (E) is related to the number of bonds ruptured during the complete cell detachment event by:
| (4) |
where Ei represents specific bond rupture energy. However, since the only specific energy available in our system is hydrogen bond energy, then Ei represent the strength of hydrogen bonds between bacterial biopolymers and silicon nitride in water. If the Poisson probability function was able to fit the distribution of adhesion energies measured between the bacterial surface biopolymers and Si3N4 (Figure 2), then one can take advantage of the fact that the mean and the variance of the data will be the equal to derive the following equations [13, 17]:
| (5) |
| (6) |
Figure 2.
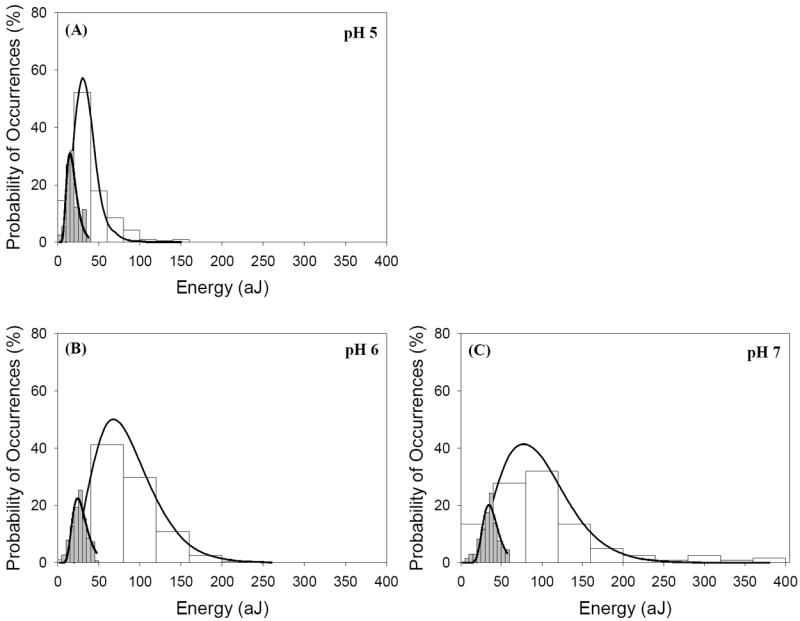

(A-E) Histograms that show the distribution of the adhesion energies (aJ) quantified from retraction curves (white-filled) and the repulsion energies computed from approach curves (gray-filled) between the biopolymers of L. monocytogenes EGDe cells cultured at pH values of 5, 6, 7, 8, and 9 and Si3N4 under water. For comparison purposes, the absolute values of the repulsion energies were plotted on the same figure. Solid lines in white-filled histograms indicate the theoretical Poisson distribution fits to the distributions of adhesion energies. The ability of the Poisson model to fit the distribution of adhesion energies was judged by the values of coefficient of correlation (r2); which averaged 0.90 for all histograms. Solid lines in the gray-filled histograms indicate the log-normal probability distribution function with three parameters fits to the distributions of repulsion energies. The coefficient of correlation (r2) values for the log-normal fits were 0.88, 0.89, 0.88, 0.75 and 0.83, respectively. (F) A scatter graph that shows the means of all data included in the histograms shown in panels A-E of this Figure as a function of the pH of the bacterial growth media. Absolute values of repulsion energies were used in this scatter graph. Error bars indicate the values of the standard error of the mean.
When nonspecific attractive or repulsive, long-range interaction energies are taken into account with an additional parameter (Eo), equation 5 and 6 become:
| (7) |
| (8) |
As can be seen from eq. 8, a linear regression of the data that result from plotting of the variance of the adhesion energy (σE2) versus the mean of the adhesion energy (μE) can be used to obtain Ei from the slope of the line and Eo from the intercept of the line (-Ei Eo) (Figure 3A). For our measurements, σE2 and μE were taken as the variance and the mean of the adhesion energy data obtained for all retraction curves measured on each cell investigated. Ten cells were probed in the current study. For the rationale behind using Poisson method to decouple the specific and nonspecific energies measured by AFM as well as the physical meaning of the equations above, please refer to the supplementary methods.
Figure 3.
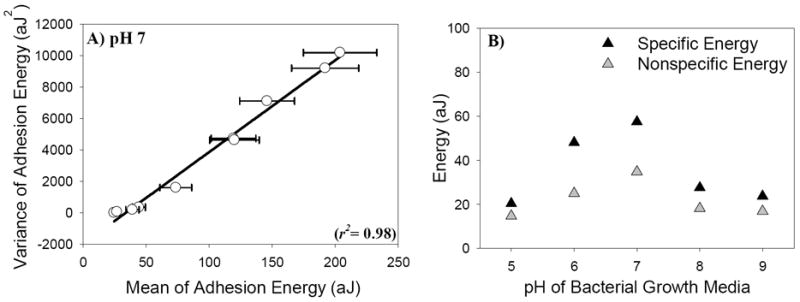
(A) A representative scatter plot of the variance, σE2, versus the mean, μE, of the adhesion energies measured between L. monocytogenes cells cultured at pH 7 and Si3N4 in water. Each point represents the variance and the mean of all adhesion energies quantified from retraction force-distance curves collected on one cell. The solid line represents the linear regression fit to the data and was used to obtain the specific and nonspecific components of the adhesion energies (Table 1, eq. 8). The error bars represent the standard errors of the means. Figure S2 in the supplementary materials shows similar scatter plots for L. monocytogenes cells cultured at the other four investigated pH conditions of growth. The coordinates of the data points used in constructing Figures 3A and S2 are given in Table S1 in the supplementary materials. (B) A scatter-graph that shows the specific and nonspecific energy components predicted using Poisson statistical analysis of the adhesion energies as a function of the pH of the bacterial growth media.
Decoupling of the overall adhesion energy into specific and nonspecific components using the new method
Specific and nonspecific adhesion energies were estimated using a new methodology. According to our new methodology, we have five assumptions. These are:
The area under the approach curve represents the nonspecific repulsive energies to be overcome by bacteria to attach to a given surface which is Si3N4 in our case. These nonspecific interactions are distance-dependent and play major roles in controlling adhesion at long distances [35]. In fact, repulsive energies are detected as soon as the cantilever senses a biomolecule on the bacterial surface and does not require actual contact with bacterial surface. As such, these energies are only nonspecific. Nonspecific energies can be DLVO, steric, acid-base as well as energies required to cause conformational changes of some of the bacterial surface biomolecules [36-39].
In comparison, the area under the retraction curve represents the sum of all adhesive specific and nonspecific energies actually present between the bacterial cell and Si3N4. Note that detaching the cantilever from the bacterial surface requires supplementing the system with enough energy to overcome both specific and nonspecific components of the adhesion energy [33]. Specific energies may be hydrogen bonds of which some can be used to stretch bacterial surface biomolecules or cause conformational changes in them and can be ligand-receptor type interactions in other systems [5, 17]. We have shown previously that our applied forces on the cantilever are sufficient to indent only ~30% in the bacterial biopolymer brush (~ 300 nm thick) [16]. As such, forces involved in cell deformation are not accounted for in our discussion of overall forces acting on the system. The attractive energies measured under the retraction curve (Figure 1A) always operate at longer or equal distances to the repulsive forces measured under the approach curves (Figure 1B). This is to be expected as repulsive energies are often registered without the need of the cantilever to touch the bacterial surface or its biomolecules. As such, repulsive energies reflect interactions with biomolecules on the bacterial surface in their native and stable three dimensional conformations. The distance at which repulsive forces are measured (150 nm in Figure 1B) is directly proportional to the length of the bacterial surface biopolymer brush. In comparison, attractive energies reflect the fact that the cantilever was in contact with the bacterial biopolymer brush and now will withdraw from that surface. Depending on the force applied by the cantilever on the bacterial biopolymer brush, biomolecules can be stretched before falling from the cantilever. The distances to which these molecules can be stretched depend on the location at which the cantilever meet the biopolymer and the composition of the biopolymer at that location as well as on how much energy is required to stretch the biomolecules. The composition of the biomolecule at which cantilever interacts with it determines if the energy measured at that point is specific or nonspecific in nature. Most often, these energies are specific as the cantilever is in contact with the biomolecule (< 1nm distance). Such distance is in agreement with distances at which specific energies are observed.
Since nonspecific energies are ascribed to the overall macroscopic surface characteristics at long distances (>50 nm) where the interacting substrata cannot distinguish the individual molecules on the bacterial surface [40], they should be conserved upon the approach of the cantilever to the bacterial surface and retraction of the cantilever from the bacterial surface. In order to contact the surface, the cantilever must gain enough energy that is equivalent to that required to overcome the repulsive energy present between the cantilever and the surface often referred to as the energy barrier to adhesion. According to the first law of thermodynamics, energy should be conserved [41]. As such, when the cantilever withdraws from the bacterial surface, at some point when it drops all bacterial surface biomolecules interacting with it from its surface, it has to provide the same energy gained while approaching the surface. Similarly, the energy gained by the cantilever when it contacts the bacterial surface biomolecules (specific energy) should be released when the biomolecules drop from the cantilever. This is why we consider adhesion force to be equivalent to the pull-off force measured by AFM. By accepting the fact that energies should be balanced in a system, we assumed that repulsive energies are conserved between approach and retraction curves and can be subtracted from the overall adhesion energy measured for the system. This assumption is only valid for elastic surfaces in contact with the cantilever. When surfaces are plastic, the methodology proposed will not be valid.
In comparison, specific energies represent the state at which the cantilever is in molecular contact with bacterial surface biopolymers (<1 nm). These energies represent, in our system, hydrogen bonds that result from molecularly mediated binding interactions between specific adhesins on a bacterial surface site and silanol groups on the Si3N4 surface [17]. These interactions can contribute largely to interactions required to stretch biomolecules on bacterial surface.
Therefore, since the magnitude of the nonspecific repulsion energy is already known from modeling of the area under approach curves, the nonspecific adhesion energy will be equal to that in magnitude and opposite in sign. Based on that, the difference between the absolute areas measured under the retraction and approach curves will be equivalent to the specific adhesion energy component. Since Poisson statistical model ability to decouple the overall adhesion interactions into specific and nonspecific components has been validated in the literature for a wide variety of systems [13, 14, 17, 42, 43], it will be used here to demonstrate the efficacy of our new proposed approach.
Colorimetric measurements of the total concentrations of proteins and carbohydrates of L. monocytogenes EGDe cells
Bacterial cells cultured at the pH of interest were harvested at the late exponential phase of growth and washed twice by centrifugation at 5525g for ten minutes each round. The collected bacterial pellet was then diluted with 0.2 μm filtered DI water to make a suspension with an optical density of ~0.5 at a wavelength of 600 nm. The bacterial suspension of interest was then assayed via the standard colorimetric Lowry assay to determine the total concentration of bacterial proteins [44]. Bovine serum albumin (BSA) was used as the protein standard. Similarly, the concentration of bacterial carbohydrates was obtained for the bacterial suspension of interest via the standard colorimetric anthrone assay [45]. Glucose was used as the carbohydrate standard. Triplicates of measurements were performed and averaged for all samples investigated.
Statistical description of AFM data
The non-parametric groups comparison Mann-Whitney Rank Sum Test or Dunn’s Test available in Sigma Stat 2.03 (Jandel Scientific) were applied to the data to determine if adhesion energies were different for variable pH conditions of growth.
Results and Discussion
Distributions of the adhesion and repulsion energies as a function of the pH of the bacterial growth media
As can be seen from Figure 2 and Table 1, both repulsion and adhesion energies measured between the surface biopolymers of L. monocytogenes EGDe cultured at five different pH values and Si3N4 in water spanned a wide range under all investigated pH conditions of growth. Observing a range of adhesion energy data for AFM measurements is common in the literature and can be attributed to the heterogeneity of the bacterial surface biopolymers [28, 29]. To describe the heterogeneity in the distributions of the repulsion energy data, the mean, standard error of mean, median, and range of these distributions are provided in Table 1. In addition, the log-normal dynamic peak function with three fitting parameters was used to fit the repulsion energy data (gray-filled histograms in Figure 2) [46]. Similarly, Poisson statistical model (eq. 1 in the supplementary materials) was fit to the adhesion energy data (white-filled histograms in Figure 2). Both models were able to describe the energy distributions very well.
Table 1.
A summary of the adhesion and repulsion energy values collected using AFM between L. monocytogenes EGDe individual cells grown in media adjusted to variable pH values of 5.0, 6.0, 7.0, 8.0, and 9.0 and silicon nitride under water. In addition, a summary of the specific and nonspecific energy components predicted from Poisson statistical analysis of the adhesion energies is provided. Finally, the concentrations of the total proteins and carbohydrates of L. monocytogenes EGDe as a function of the pH of growth media are given.
| pH of bacterial growth | 5 | 6 | 7 | 8 | 9 |
|---|---|---|---|---|---|
| Adhesion retraction energy (Er in aJ) | |||||
| Mean | 35.1 | 72.3 | 97.9 | 49.6 | 44.4 |
| Standard error of the mean | 0.9 | 1.7 | 5.5 | 1.9 | 1.0 |
| Median | 29.4 | 62.4 | 48.2 | 26.1 | 39.1 |
| Range | 154.3 | 376.6 | 708.2 | 294.0 | 109.4 |
| No. of curves | 211 | 203 | 161 | 212 | 161 |
| No. of cells | 15 | 15 | 15 | 15 | 15 |
|
| |||||
| Repulsion approach energy (Ea in aJ, equivalent to nonspecific energies) | |||||
| Mean | -16.1 | -27.3 | -37.6 | -18.3 | -18.3 |
| Standard error of the mean | 0.8 | 2.4 | 3.7 | 1.3 | 1.6 |
| Median | -16.3 | -11.9 | -17.8 | -21.8 | -6.5 |
| Range | -35.8 | -105.0 | -179.3 | -92.8 | -83.5 |
| No. of curves | 165 | 168 | 157 | 120 | 169 |
| No. of cells | 15 | 15 | 15 | 15 | 15 |
|
| |||||
| Difference between Er and |Ea| (Specific energies) | 19.0 | 45.0 | 60.2 | 31.3 | 26.1 |
|
| |||||
| Poisson statistical analysis of retraction force-distance data | |||||
| Specific energy (Ei, aJ) | 20.4 | 48.1 | 57.5 | 27.6 | 23.7 |
| Nonspecific energy (Eo, aJ) | 14.7 | 25.0 | 34.8 | 18.1 | 16.9 |
|
| |||||
| Results of colorimetric assays (concentrations are in g/L) | |||||
| Proteins’ concentration | 0.025 | 0.015 | 0.014 | 0.033 | 0.017 |
| Standard error of the mean | 0.001 | 0.001 | 0.002 | 0.001 | 0.001 |
| Carbohydrates’ concentration | 0.019 | 0.016 | 0.032 | 0.017 | 0.004 |
| Standard error of the mean | 0.003 | 0.001 | 0.003 | 0.001 | 0.001 |
Compared to all pH conditions of growth, repulsion and adhesion energies collected for cells grown in pH 7 were the most heterogeneous (Figure 2 and standard errors of mean in Table 1). Consistent with this heterogeneity, our colorimetric measurements showed that the total bacterial cells carbohydrates’ concentration was the highest for cells cultured in media with pH 7 compared to cells cultured in media adjusted to higher or lower pH values (Table 1). Cells varied as well in their proteins’ concentrations (Table 1). It has to be noted here that the cell wall of L. monocytogenes EGDe is highly heterogeneous and is primarily composed of peptidoglycans and proteins [24]. When the banding profiles of the surface proteins of L. monocytogenes EGDe cells cultured at pH 5 and 7 were compared, more bands were found for cells cultured at pH 7 compared to those cultured at pH 5 [47]. A second study indicated that pre-exposure of L. monocytogenes to an acidic pH of 5.1 resulted in a significant decrease in the phospholipase C type A (plcA) gene transcript, encoding a phospholipase C involved in vacuolar escape and cell-to-cell spread [48]. The genetic studies above indicate L. monocytogenes vary the composition of their surface proteins in response to pH stresses.
Strength of the adhesion and repulsion energies as a function of the pH of bacterial growth media
Both the log-normal and the Poisson models predicted a transition in the most probable repulsion and adhesion energies for cells cultured at pH 7 (Figure 2F). The mean values of the repulsion and adhesion energies respectively were 47% and 49% higher on average for cells grown in pH 7 compared to all other pH conditions of growth investigated (Table 1). Median adhesion and repulsion energies measured for cells cultured at pH 7 were statistically higher than those measured for cells cultured at other pH conditions of growth (P≤ 0.007, Dunn’s test). When compared, magnitudes of adhesion energies were on average 60 % larger than magnitudes of repulsion energies for all investigated pH conditions of growth (Table 1, Figure 2F). This is expected since repulsion energies represent the nonspecific energies while the adhesion energies represent the sum of both nonspecific and specific energies [49].
The higher adhesion and repulsion energies observed for cells cultured at pH 7 can be attributed largely to the composition and conformation of the bacterial surface molecules at that condition. First, we have observed that L. monocytogenes cells cultured in media with pH 7 have 50% and 88% higher concentration of carbohydrates compared to cells cultured in acidic or basic conditions of growth, respectively (Table 1). This agrees well with our knowledge of the cell wall composition of L. monocytogenes which contains two secondary polyanionic electronegative carbohydrate-containing polymers in addition to proteins and peptidoglycans. These are the wall teichoic acids (WTAs) which are covalently bound to peptidoglycan and the lipoteichoic acids (LTAs) which are impeded into the plasmic membrane by a diacylglycerolipid [24]. Literature studies have indicated that WTAs and LTAs play major roles in supporting bacterial cell structure, adherence and virulence as they represent long polymers threading through the layers of peptidoglycans and can account for over 60% of the mass of the Gram-positive bacteria cell wall [50].
Similarly, the higher concentration of carbohydrates for cells cultured in pH 7 is expected to contribute to the higher repulsion energies observed for those cells. Note that the acidic WTAs and LTAs are negatively charged as well as the Si3N4 cantilever is negatively charged [36]. Therefore, repulsion energies are to be expected between the two. In addition, since the WTAs and LTAs represent the longer molecules observed on the bacterial surface, they will lead to the long-range repulsion energies observed in our study.
Decoupling of adhesion energies into specific and nonspecific components
The overall adhesion energies measured by AFM were decoupled into their specific and nonspecific adhesion energy components at each pH condition of growth investigated using Poisson statistical approach and our new proposed methodology. First, for all investigated pH conditions of growth, Poisson modeling of adhesion data indicated that specific energies were 36% higher than the nonspecific energies, dominating the interactions between L. monocytogenes and Si3N4 in water (Table 1, Figure 3B). The highest specific and nonspecific interaction energies were obtained for cells cultured at pH 7 (Figure 3B) and displayed the same trend observed for the adhesion energies measured using AFM (Figure 2F). Note that specific and nonspecific energies were positive indicating attractive energies. Similarly, specific energies estimated using our new methodology were 35% higher than nonspecific energies for all investigated pH conditions of growth (Table 1).
In our bacteria-Si3N4-water system, nonspecific energies refer mainly to DLVO-based energies resulting from the sum of electrostatic repulsive energies and van der Waals energies as well as acid-base interactive energies [40] while specific energies refer to hydrogen bonds [14]. LTAs and WTAs in the cell wall of L. monocytogenes EGDe strain are composed of repeating polyribitol-phosphate (RboP) units containing the carbohydrate components rhamnose (Rha) and N-acetylglycosamine (GlcNAc) [51]. Thereby, hydrogen bonds in our system can arise between silanols (SiH3-OH) forming on the Si3N4 surface in water [17] and the hydroxyl groups of the polyribitol-phosphate (RboP) units of WTAs. The strengths of the hydrogen bonds increase as the electronegativity of the WTAs and LTAs increase. This is mainly because negatively charged polymers will repel each other and extend far apart exposing more hydrogen binding sites to the AFM cantilever. Therefore, the higher specific adhesion energies obtained for cells cultured at pH 7 compared to other pH conditions of growth can be attributed mainly to the higher concentration of carbohydrates on the cell surface offering more hydrogen binding sites to Si3N4.
Irrespective of the pH of the growth media, the specific adhesion energies represented by hydrogen bonds dominated the overall adhesion energies quantified between the cantilever and bacterial surface. This is can be in part explained by the ability of bacterial cells to form hydrogen bonds due to the presence of a high concentration of carbohydrates on their surfaces. Hydrogen bond energies are generally stronger than DLVO energies [33]. Our results suggest that controlling L. monocytogenes EGDe adhesion to surface can be done by reducing the strength of hydrogen bonding. An example on doing that is to coat the inert surface with thin polymer films that can mask the hydrogen donor groups on these surfaces and hence reduce bacterial adhesion [52].
Nonspecific repulsive energies can also be used to design methods to control bacterial adhesion. The higher the nonspecific energies are, the higher the energy expenditure required for the bacterial cells to overcome the long-range repulsions and approach to a given substrate [53]. Therefore, by changing environmental conditions of growth, the suspending medium conditions or the substrate electrical or hydrophobic properties, long-range repulsions can be maximized. This is particularly important for motile bacteria in stagnant or low fluid velocity environments [54].
A comparison between specific and nonspecific adhesion energies estimated by the new method and Poisson statistical method
When specific and nonspecific energies computed using the new methodology were compared to the Poisson model estimates of the two types of energies, the differences between the two methods estimates were 2.2% and 6.7% on average, respectively (Table 1). Both models’ estimates of specific and nonspecific energies were linearly correlated with an intercept of zero, a slope that is very close to one and r2 values that are higher than 0.97 (Figure 4). The two approaches gave values that are in good agreement with each other for both specific and nonspecific energies. This is to be expected as specific and nonspecific energies are properties of the system investigated and their values should be constant irrespective of the method used to obtain them. This demonstrates the validity of the new approach as a method to decouple overall adhesion energies into specific and nonspecific components. Previously, we have shown that nonspecific forces determined based on Poisson modeling of the AFM adhesion forces measured between L. monocytogenes EGDe and Si3N4 were very close to the nonspecific forces determined using soft-particle analysis of DLVO forces [16]. Although we did not compute the DLVO energies in this manuscript, the results of the study above which indicated that Poisson estimates of specific and nonspecific forces are very close to DLVO estimates of these forces add to the validity of our new methodology as means of decoupling of the overall adhesion energies into its components.
Figure 4.


Scatter graphs that show the relationship between (A) specific energies and (B) nonspecific energies, respectively estimated using Poisson statistical model and our new proposed methodology. Solid lines indicate linear fits to the data. In (A), the equation is described by Y=1.02X, r2=0.97 and in (B), the equation is described by Y=1.08X with r2 value of 0.99.
Advantages and disadvantages of the new proposed method compared to Poisson approach
As was discussed earlier, Poisson statistical model has been the hallmark of methods used to decouple bacterial adhesion in the literature [14, 55, 56]. This can be largely attributed to the experiments performed by Beebe et al. and validated the ability of the model to decouple overall adhesion forces measured between gold-gold and mica-silicon nitride into specific and nonspecific components with high accuracy [17]. However, despite its ability to decouple the adhesion energies into specific and nonspecific components, this approach suffers from three main shortcomings. First, the Poisson distribution function (equation 3) should fit the histograms of the adhesion energies (Figure 2) prior to applying it to decouple the energies. This may not be always possible. Second, assuming that the first criterion was accomplished, a large set of data is needed to obtain enough statistical significance and confidence in the analysis. Third, the model assumes that the adhesion energy (E) develops as the sum of discrete bond-rapture energies and that these bonds form randomly and all have similar bond specific energy values (Ei). To overcome some of these shortcomings, we proposed our new methodology. In the new proposed approach, manipulation of data is minimal. The user just needs to integrate the area under the curves to get the specific and nonspecific energy components. As such, the method does not require any fitting procedures. Second, the method can be easily automated for large data sets as it is independent of user choices. Third, the method can be applied to any system of interest. Although, we have applied the new tool here for interactions between L. monocytogenes and silicon nitride which is an inert surface, the same procedure can be used to decouple interactions in other systems of interest. For example, if interactions between bacteria and biotic surfaces were measured using AFM, areas under approach and retraction curves can be calculated. The area under the approach curve will be equivalent to nonspecific energies and the area under the retraction curve will be the sum of nonspecific and specific energies. In this particular example, specific energies will be ligand-receptor type energies and nonspecific energies will be those coming from geometric and conformational effects as well as charge effects. One of the disadvantages of the new method lies in its assumption that the nonspecific energies are constant between the approach and retraction half-cycles of the AFM measurements. This assumption may not be always valid, especially if the sample is highly plastic.
Conclusions
The overall adhesion energies measured using AFM between L. monocytogenes EGDe cells grown at five different pH conditions of growth and Si3N4 in water were decoupled into their specific and nonspecific components using two approaches. These were the traditional Poisson statistical model and a new approach proposed here. Estimates of both approaches of the specific and nonspecific adhesion energies were close to each other. Both approaches showed that specific energies were higher than nonspecific energies for all pH conditions investigated and predicted a transition in the specific and nonspecific energies for cells grown at pH 7. When compared for all pH conditions of growth, cells cultured in pH 7 were characterized by the highest adhesion energies. Our results indicate that the new approach proposed here to decouple overall adhesion energy strength into specific and nonspecific energies provides an alternative, simple and easy to automate approach to current statistical methods.
Supplementary Material
Acknowledgments
We would like to thank Josue Orellana for his MATLAB program used in computing the areas under the AFM retraction and approach curves. We would like to thank Christy Hou for her help in data analysis. We would like to thank the National Institutes of Health (NIH) grants 1R03AI077590–01A1 and 5R03AI077590–02 for financial support of this work. We would like to thank the two unanimous reviewers for their valuable suggestions.
References
- 1.Gristina AG, Naylor P, Myrvik Q. Infections from biomaterials and implants: A race for the surface. Med Prog Technol. 1988;14:205–224. [PubMed] [Google Scholar]
- 2.Bushnak IA, Labeed FH, Sear RP, Keddie JL. Adhesion of microorganisms to bovine submaxillary mucin coatings: Effect of coating deposition conditions. Biofouling. 2010;26:387–397. doi: 10.1080/08927011003646809. [DOI] [PubMed] [Google Scholar]
- 3.Katsikogianni M, Missirlis YF. Concise review of mechanisms of bacterial adhesion to biomaterials and of techniques used in estimating bacteria-material interactions. European Cells & Materials. 2004;8:37–57. doi: 10.22203/ecm.v008a05. [DOI] [PubMed] [Google Scholar]
- 4.van Oss CJ. Energetics of cell-cell and cell-biopolymer interactions. Cell biophysics. 1989;14:1–16. doi: 10.1007/BF02797387. [DOI] [PubMed] [Google Scholar]
- 5.Rabinovich YI, Adler JJ, Ata A, Singh RK, Moudgil BM. Adhesion between nanoscale rough surfaces I. Role of asperity geometry. Journal of Colloid and Interface Science. 2000;232:10–16. doi: 10.1006/jcis.2000.7167. [DOI] [PubMed] [Google Scholar]
- 6.Rabinovich YI, Adler JJ, Ata A, Singh RK, Moudgil BM. Adhesion between nanoscale rough surfaces II. Measurement and comparison with theory. Journal of Colloid and Interface Science. 2000;232:17–24. doi: 10.1006/jcis.2000.7168. [DOI] [PubMed] [Google Scholar]
- 7.Abu-Lail NI, Camesano TA. Specific and nonspecific interaction forces between Escherichia coli and silicon nitride, determined by poisson statistical analysis. Langmuir. 2008;24:4420–4420. doi: 10.1021/la0533415. [DOI] [PubMed] [Google Scholar]
- 8.Derjaguin B. Untersuchungen über die reibung und adhäsion, iv. Kolloid-Zeitschrift Kolloid-Zeitschrift. 1934;69:155–164. [Google Scholar]
- 9.Verwey EJW, Overbeek JTG, Nes Kv. Theory of the stability of lyophobic colloids; the interaction of sol particles having an electric double layer. New York: Elsevier Pub. Co; 1948. [Google Scholar]
- 10.Ohshima H. Electrophoresis of soft particles. Advances in Colloid and Interface Science. 1995;62:189–235. doi: 10.1016/j.cis.2019.06.007. [DOI] [PubMed] [Google Scholar]
- 11.Sharma PK, Rao KH. Adhesion of Paenibacillus polymyxa on chalcopyrite and pyrite: Surface thermodynamics and extended DLVO theory. Colloids and Surfaces B-Biointerfaces. 2003;29:21–38. [Google Scholar]
- 12.Park BJ, Haines T, Abu-Lail NI. A correlation between the virulence and the adhesion of Listeria monocytogenes to silicon nitride: An atomic force microscopy study. Colloids and Surfaces B: Biointerfaces. 2009;73:237–243. doi: 10.1016/j.colsurfb.2009.05.027. [DOI] [PubMed] [Google Scholar]
- 13.Han T, Williams JM, Beebe TP., Jr Chemical bonds studied with functionalized atomic force microscopy tips. Anal Chim Acta. 1995;307:365–376. [Google Scholar]
- 14.Abu-Lail NI, Camesano TA. Specific and nonspecific interaction forces between Escherichia coli and silicon nitride, determined by poisson statistical analysis. Langmuir. 2006;22:7296–7301. doi: 10.1021/la0533415. [DOI] [PubMed] [Google Scholar]
- 15.van der Mei HC, de Vries J, Busscher HJ. Weibull analyses of bacterial interaction forces measured using AFM. Colloids and Surfaces B: Biointerfaces. 2010;78:372–375. doi: 10.1016/j.colsurfb.2010.03.018. [DOI] [PubMed] [Google Scholar]
- 16.Gordesli FP, Abu-Lail NI. Combined poisson and soft-particle DLVO analysis of the specific and nonspecific adhesion forces measured between L. monocytogenes grown at various temperatures and silicon nitride. Environ Sci Technol. 2012;46:10089–10098. doi: 10.1021/es300653w. [DOI] [PubMed] [Google Scholar]
- 17.Williams JM, Han T, Beebe TP. Determination of single-bond forces from contact force variances in atomic force microscopy. Langmuir. 1996;12:1291–1295. [Google Scholar]
- 18.Tsuneda S, Aikawa H, Hayashi H, Yuasa A, Hirata A. Extracellular polymeric substances responsible for bacterial adhesion onto solid surface. FEMS Microbiology Letters. 2003;223:287–292. doi: 10.1016/S0378-1097(03)00399-9. [DOI] [PubMed] [Google Scholar]
- 19.Ramaswamy V, Cresence VM, Rejitha JS, Lekshmi MU, Dharsana KS, Prasad SP, Vijila HM. Listeria-review of epidemiology and pathogenesis. Journal of Microbiology, Immunology, and Infection. 2007;40:4–13. [PubMed] [Google Scholar]
- 20.Nappi R, Bozzetta E, Serra R, Grattarola C, Decastelli L, Florio C, Caramelli M. Molecular characterization of Listeria monocytogenes strains associated with outbreaks of listeriosis in humans and ruminants and food products by serotyping and automated ribotyping. Veterinary Research Communications. 2005;29:249–252. doi: 10.1007/s11259-005-0054-9. [DOI] [PubMed] [Google Scholar]
- 21.Mafu AA, Plumety C, Deschênes L, Goulet J. Adhesion of pathogenic bacteria to food contact surfaces: Influence of pH of culture. International Journal of Microbiology. 2011;2011:1–10. doi: 10.1155/2011/972494. [DOI] [PMC free article] [PubMed] [Google Scholar]
- 22.Mafu AA, Roy D, Goulet J, Magny P. Attachment of Listeria monocytogenes to stainless steel, glass, polypropylene, and rubber surfaces after short contact times. Journal of Food Protection. 1990;53:742–746. doi: 10.4315/0362-028X-53.9.742. [DOI] [PubMed] [Google Scholar]
- 23.Tresse O, Lebret V, Garmyn D, Dussurget O. The impact of growth history and flagellation on the adhesion of various Listeria monocytogenes strains to polystyrene. Canadian Journal of Microbiology. 2009;55:189–196. doi: 10.1139/w08-114. [DOI] [PubMed] [Google Scholar]
- 24.Bierne H, Cossart P. Listeria monocytogenes surface proteins: From genome predictions to function. Microbiology and Molecular Biology Reviews. 2007;71:377–397. doi: 10.1128/MMBR.00039-06. [DOI] [PMC free article] [PubMed] [Google Scholar]
- 25.Ryser ET, Arimi SM, Donnelly CW. Effects of pH on distribution of Listeria ribotypes in corn, hay, and grass silage. Applied and Environmental Microbiology. 1997;63:3695–3697. doi: 10.1128/aem.63.9.3695-3697.1997. [DOI] [PMC free article] [PubMed] [Google Scholar]
- 26.Doktycz MJ, Sullivan CJ, Hoyt PR, Pelletier DA, Wu S, Allison DP. AFM imaging of bacteria in liquid media immobilized on gelatin coated mica surfaces. Ultramicroscopy. 2003;97:209–16. doi: 10.1016/S0304-3991(03)00045-7. [DOI] [PubMed] [Google Scholar]
- 27.Hutter JL, Bechhoefer J. Calibration of atomic force microscope tips. Review of Scientific Instruments. 1993;64:1868–1873. [Google Scholar]
- 28.Park BJ, Abu-Lail NI. Atomic force microscopy investigations of heterogeneities in the adhesion energies measured between pathogenic and non-pathogenic Listeria species and silicon nitride as they correlate to virulence and adherence. Biofouling. 2011;27:543–559. doi: 10.1080/08927014.2011.584129. [DOI] [PMC free article] [PubMed] [Google Scholar]
- 29.Camesano TA, Abu-Lail NI. Heterogeneity in bacterial surface polysaccharides, probed on a single-molecule basis. Biomacromolecules. 2002;3:661–667. doi: 10.1021/bm015648y. [DOI] [PubMed] [Google Scholar]
- 30.Israelachvili JN. Intermolecular and surface forces. New York: Academic Press; 1992. [Google Scholar]
- 31.Park BJ, Abu-Lail NI. The role of the pH conditions of growth on the bioadhesion of individual and lawns of pathogenic listeria monocytogenes cells. Journal of Colloid and Interface Science. 2011;358:611–620. doi: 10.1016/j.jcis.2011.03.025. [DOI] [PMC free article] [PubMed] [Google Scholar]
- 32.Cox MG. The area under a curve specified by measured values. Metrologia. 2007;44:365–378. [Google Scholar]
- 33.Chen Y, Busscher HJ, van der Mei HC, Norde W. Statistical analysis of long- and short-range forces involved in bacterial adhesion to substratum surfaces as measured using atomic force microscopy. Applied and environmental microbiology. 2011;77:5065–5070. doi: 10.1128/AEM.00502-11. [DOI] [PMC free article] [PubMed] [Google Scholar]
- 34.Barlow R. Statistics: A guide to the use of statistical methods in the physical sciences. New York: Wiley; 1989. [Google Scholar]
- 35.Hayashi H, Tsuneda S, Hirata A, Sasaki H. Soft particle analysis of bacterial cells and its interpretation of cell adhesion behaviors in terms of DLVO theory. Colloids and surfaces B, Biointerfaces. 2001;22:149–157. doi: 10.1016/s0927-7765(01)00161-8. [DOI] [PubMed] [Google Scholar]
- 36.Abu-Lail NI, Camesano TA. Role of ionic strength on the relationship of biopolymer conformation, DLVO contributions, and steric interactions to bioadhesion of Pseudomonas putida kt2442. Biomacromolecules. 2003;4:1000–1012. doi: 10.1021/bm034055f. [DOI] [PubMed] [Google Scholar]
- 37.Azeredo J, Visser J, Oliveira R. Exopolymers in bacterial adhesion: Interpretation in terms of DLVO and xDLVO theories. Colloids and Surfaces B-Biointerfaces. 1999;14:141–148. [Google Scholar]
- 38.Bostrom M, Williams DRM, Ninham BW. Specific ion effects: Why DLVO theory fails for biology and colloid systems. Physical Review Letters. 2001;87:168103-1–168103-4. doi: 10.1103/PhysRevLett.87.168103. [DOI] [PubMed] [Google Scholar]
- 39.Rijnaarts HHM, Norde W, Lyklema J, Zehnder AJB. DLVO and steric contributions to bacterial deposition in media of different ionic strengths. Colloids and Surfaces B-Biointerfaces. 1999;14:179–195. [Google Scholar]
- 40.Busscher HJ, Weerkamp AH. Specific and non-specific interactions in bacterial adhesion to solid substrata. FEMS Microbiology Letters. 1987;46:165–173. [Google Scholar]
- 41.Heinisch R, Rogowski A, Schutt E. The first law of thermodynamics. Forschung Im Ingenieurwesen-Engineering Research. 1994;60:29–35. [Google Scholar]
- 42.Lo YS, Huefner ND, Chan WS, Stevens F, Harris JM, Beebe TP. Specific interactions between biotin and avidin studied by atomic force microscopy using the poisson statistical analysis method. Langmuir. 1999;15:1373–1382. [Google Scholar]
- 43.Lo YS, Zhu YJ, Beebe TP. Loading-rate dependence of individual ligand-receptor bond-rupture forces studied by atomic force microscopy. Langmuir. 2001;17:3741–3748. [Google Scholar]
- 44.Lowry OH, Rosebrough NJ, Farr AL, Randall RJ. Protein measurement with the folin phenol reagent. The Journal of Biological Chemistry. 1951;193:265–275. [PubMed] [Google Scholar]
- 45.Hodge JE, Hofreiter BT. In: Methods in carbohydrate chemistry. Whistler RL, Be Miller JN, editors. New York: Academic Press; 1962. [Google Scholar]
- 46.Gordesli FP, Abu-Lail NI. The role of growth temperature in the adhesion and mechanics of pathogenic L. Monocytogenes: An AFM study. Langmuir. 2012;28:1360–1373. doi: 10.1021/la203639k. [DOI] [PubMed] [Google Scholar]
- 47.Tresse O, Lebret V, Benezech T, Faille C. Comparative evaluation of adhesion, surface properties, and surface protein composition of Listeria monocytogenes strains after cultivation at constant ph of 5 and 7. J Appl Microbiol. 2006;101:53–62. doi: 10.1111/j.1365-2672.2006.02968.x. [DOI] [PubMed] [Google Scholar]
- 48.Conte MP, Petrone G, Di Biase AM, Longhi C, Penta M, Tinari A, Superti F, Fabozzi G, Visca P, Seganti L. Effect of acid adaptation on the fate of Listeria monocytogenes in thp-1 human macrophages activated by gamma interferon. Infection and Immunity. 2002;70:4369–4378. doi: 10.1128/IAI.70.8.4369-4378.2002. [DOI] [PMC free article] [PubMed] [Google Scholar]
- 49.Cappella B, Dietler G. Force-distance curves by atomic force microscopy. Surface Science Reports. 1999;34:1–104. [Google Scholar]
- 50.Silhavy TJ, Kahne D, Walker S. The bacterial cell envelope. Cold Spring Harbor Perspectives in Biology. 2010;2:a000414. doi: 10.1101/cshperspect.a000414. [DOI] [PMC free article] [PubMed] [Google Scholar]
- 51.Eugster MR, Loessner MJ. Rapid analysis of listeria monocytogenes cell wall teichoic acid carbohydrates by esi-ms/ms. PLoS ONE. 2011;6:1–7. doi: 10.1371/journal.pone.0021500. [DOI] [PMC free article] [PubMed] [Google Scholar]
- 52.Chapman RG, Ostuni E, Liang MN, Meluleni G, Kim E, Yan L, Pier G, Warren HS, Whitesides GM. Polymeric thin films that resist the adsorption of proteins and the adhesion of bacteria. Langmuir. 2001;17:1225–1233. [Google Scholar]
- 53.Marshall KC, Stout R, Mitchell R. Mechanism of the initial events in the sorption of marine bacteria to surfaces. Journal of General Microbiology. 1971;68:337–348. [Google Scholar]
- 54.McClaine JW, Ford RM. Characterizing the adhesion of motile and nonmotile escherichia coli to a glass surface using a parallel-plate flow chamber. Biotechnology and Bioengineering. 2002;78:179–189. doi: 10.1002/bit.10192. [DOI] [PubMed] [Google Scholar]
- 55.Gordesli FP, Abu-Lail NI. Combined poisson and soft-particle DLVO analysis of the specific and nonspecific adhesion forces measured between L. monocytogenes grown at various temperatures and silicon nitride. Environmental Science & Technology. 2012;46:10089–10098. doi: 10.1021/es300653w. [DOI] [PubMed] [Google Scholar]
- 56.Mei L, van der Mei HC, Ren YJ, Norde W, Busscher HJ. Poisson analysis of streptococcal bond strengthening on stainless steel with and without a salivary conditioning film. Langmuir. 2009;25:6227–6231. doi: 10.1021/la9000494. [DOI] [PubMed] [Google Scholar]
Associated Data
This section collects any data citations, data availability statements, or supplementary materials included in this article.