

Abstract
Rhabdomyosarcoma (RMS), a cancer of skeletal muscle lineage, is the most common soft-tissue sarcoma in children [1]. Major subtypes of RMS include alveolar (ARMS) and embryonal (ERMS).[2, 3] Whereas ARMS typically contain translocations generating the PAX3-FOXO1 or PAX7-FOXO1 aberrant transcription factors which block terminal myogenic differentiation [4-6], no functionally comparable genetic event has been found in ERMS. Here, we report the discovery, through whole exome sequencing, of a recurrent somatic point mutation Leu122Arg in the myogenic transcription factor, MYOD1, in a distinctive subset of ERMS with poor outcomes that also often contain PI3K/AKT pathway mutations. Previous mutagenesis studies had shown that MYOD1 Leu122Arg can block wild-type MYOD1 function and bind to MYC consensus sequences [7], suggesting a possible switch from differentiation to proliferation. Our functional data now confirm this prediction. RMS with MYOD1 Leu122Arg represents a molecularly defined subset of RMS eligible for high risk protocols and targeted therapeutic development.
We performed whole exome sequencing on 20 RMS samples (9 ARMS, 11 ERMS) of which 8 (2 ARMS, 6 ERMS) also underwent whole transcriptome sequencing (WTS). The patient ages at diagnosis for the ARMS and ERMS tumor samples ranged from 1-25 and 1-21 years, respectively (Supplementary Table 1 and 2). Complete tables of variant calls are provided in the Supplement (Supplementary Table 3). In addition to mutations in RAS genes and FGFR4 seen in ERMS samples and previously reported in this RMS subtype [8, 9], two ERMS showed the same c.365T>G point mutation in MYOD1, leading to an Leu122Arg substitution (Figure 1 and Supplementary Figure 1). Both were primary tumor samples and, in each case, normal tissue did not harbor the variant, confirming these as somatic mutations. WTS data were available for one of the two samples with the MYOD1 Leu122Arg mutation and this showed that the mutant allele was highly expressed (Supplementary Figure 1). MYOD1, as a member of the bHLH family of transcription factors,[10] binds DNA through the basic domain adjacent to its HLH dimerization domain. The Leu122Arg mutation occurs in the conserved basic region of MYOD1, at a highly specific conserved residue that is a leucine in all myogenic bHLH transcription factors, including MYOD1, MYF5, MYOG (myogenin) and MRF4, but is an arginine in MYC-family bHLH transcription factors, including MYC and MYCN (Figure 1). Remarkably, the MYOD1 Leu122Arg was created experimentally over 20 years ago by Van Antwerp and colleagues who examined whether mutating the MYOD1 basic domain to render it more similar to the MYC basic domain would confer it with oncogenic properties.[7] They showed that the MYOD1 Leu122Arg mutant bound a consensus MYOD1 site, competing with wild-type MYOD1, but without leading to MYOD1 target gene transactivation, as well as a MYC consensus sequence, thereby potentially deregulating MYC target genes. They hypothesized that this apparent combination of inhibition of differentiation (lack of MYOD1 transactivation) and enhanced proliferation (MYC-like properties) could be a key oncogenic feature of RMS.[7]
Figure 1. Identification of MYOD1 Leu122Arg in RMS.

mino acid sequence of DNA-binding Basic Domain of myogenic and MYC-family bHLH transcription factors. The leucine at the carboxy end of the domain is highly specific for the myogenic bHLH transcription factors and is replaced by an arginine in MYC-family bHLH transcription factors. The MYOD1 Leu122Arg was found in 10/104 ERMS samples. A screen in 91 ERMS lacking the MYOD1 Leu122Arg for the corresponding leucine to arginine mutation in MYF5, MYF6, and MYOG was completely negative. (Figure adapted from Figure 1 in ref. 22).
To better assess the prevalence of this mutation in ERMS, we genotyped another 93 ERMS for MYOD1 Leu122Arg using mass spectrometry-based genotyping (Sequenom). The mutation was detected in 8 additional cases (and confirmed as somatic in 6 cases with available normal DNA), resulting in an overall prevalence of approximately 10% (10/104) (Figure 1 and Supplementary Figure 2). No MYOD1 mutations were found in 25 ARMS (19 fusion positive, 6 fusion negative). To exclude the possibility of analogous leucine to arginine mutations in other highly related myogenic factors (MYF5 L96R, MYF6 L106R, MYOG L94R), we screened 101 ERMS (from the above set of 104) for such mutations but none were identified (Figure 1).
The ERMS harboring the MYOD1 Leu122Arg mutation displayed high cellularity and frequent spindle cell morphology with strong positivity for MYOD1 by immunohistochemistry (IHC) (Figure 2), suggesting, in some cases, a pathologic overlap with the adult spindle cell variant of ERMS [11, 12]. Notably, 9 of 10 ERMS with MYOD1 mutations were from patients diagnosed in adolescence or adulthood (mean age = 25; median age = 28), were more likely to arise in the head/neck (8/10 vs 16/80; p=0.0003), and were somewhat more common in females (8/45 vs 2/53; p=0.04). Furthermore, the survival of patients with MYOD1-mutant ERMS was significantly poorer than for ERMS lacking MYOD1 mutation (0% vs 48% at 10 yrs; p=0.02) (Figure 2).
Figure 2. Distinctive clinicopathologic features and outcome of ERMS with MYOD1 Leu122Arg.

(a) Kaplan-Meier survival analysis comparing ERMS patients with and without the MYOD1 Leu122Arg mutation. Analysis was performed in 70 patients from MSKCC with available clinical outcome data. Overall survival of ERMS patients with the MYOD1 Leu122Arg mutation is significantly worse (p=0.02). (b) Typical histology of ERMS with MYOD1 Leu122Arg shows high cellularity, frequent mitoses, and in some cases, prominent spindle cell morphology (scale bar: 100 μm). The IHC for MYOD1 shows moderate to intense nuclear immunoreactivity in all cases. Insets show higher magnification detail of hematoxylin & eosin-stained section and MYOD1 IHC (scale bar: 100 μm).
Previous functional studies on the MYOD1 Leu122Arg mutant had documented effects on binding and regulation of model MYOD1 and MYC targets.[7] To extend these data, we first sought to evaluate the effect of the MYOD1 Leu122Arg mutant on myogenic differentiation. We therefore examined morphological differences during induced differentiation of C2C12 myoblasts in growth factor-deficient medium following retroviral introduction of wild type MYOD1, MYOD1 Leu122Arg, and MYC (Figure 3a). Increased differentiation index and enhanced muscle cell fusion were observed in MYOD1-expressing C2C12 cells (Figure 3b). In contrast, these were not observed in C2C12 cells expressing MYOD1 Leu122Arg (Figure 3b). Consistent with previous data [13], C2C12 cells expressing MYC could be induced to undergo limited differentiation but cell fusion was severely inhibited (Figure 3b). Wild type MYOD1 induced reduced growth of C2C12 cells while MYOD1 Leu122Arg did not affect in vitro growth (Figure 3c). In soft-agar colony formation assay, MYOD1 Leu122Arg increased the number of transformed colonies although colony size was smaller than that seen in C2C12 cells with MYC (Figure 3a and 3d). In comparison, the same experiments performed in normal growth medium produced myogenic differentiation only in C2C12 cells expressing wild type MYOD1 (See Supplementary Note; Supplementary Figure 3).
Figure 3. Effects of MYOD1 Leu122Arg on cell growth and myogenic differentiation in vitro.

Muscle cell differentiation was assessed by immunofluorescence (IF) for myosin heavy chain (MHC) in GFP control-transfected cells and MYOD1-expressing cells at day 5 after differentiation induction. (a) Phase contrast microscopy of C2C12 cells transfected with GFP, wild type MYOD1, MYOD1 Leu122Arg or MYC expression constructs, cultured in differentiation medium (DM) (top panel; magnification 400X; scale bar: 200 μm). Arrowheads indicate multinucleate dmyotubes. The middle panel shows IF of the corresponding cells immunostained for MHC. Cells were fixed and immunostained for MHC, and myoblast differentiation was observed by IF (green, MHC; blue, DAPI; magnification 100X; scale bar: 100 μm). The bottom panel shows representative images of soft agar colony formation (CF) assays (magnification 50X; scale bar: 100 μm). (b) Bar graphs showing the differentiation index (DI), [(nuclei within MHC-positive myocytes/total number of nuclei) × 100] and the fusion index (FI) [(nuclei within MHC-positive myocytes containing > 3 nuclei/ total number of nuclei) × 100]. GFP, WT, Leu122Arg or MYC respectively represent GFP, wild type MYOD1, MYOD1 Leu122Arg or MYC transfected C2C12 cells. Error bars represent SD of three independent experiments. *p < 0.01 vs. GFP. (c) Evaluation of in vitro growth. For each experiment, 2×10⁴ cells were cultured in DMEM, and counted at day 5. *p < 0.01 vs. GFP; N.S. not significant vs. GFP. (d) Soft agar colony formation assay. The colonies were countedat 28 days under x40 magnification. Error bars represent SD of three independent experiments. *p < 0.01 vs. GFP.
In a previous report, we identified PIK3CA mutations in 3 of 60 ERMS [8]. Remarkably, all 3 of these PIK3CA-mutated tumor samples are among the 10 MYOD1 Leu122Arg cases identified here (Table 1). The relationship between MYOD1 Leu122Arg and PIK3CA mutations appeared significant in the 66 cases with genotyping data for both (PIK3CA mutations in 3/10 MYOD1 Leu122Arg cases vs 0/56 MYOD1 wild type cases; Fisher’s exact p=0.003). The notion that MYOD1 Leu122Arg is associated with mutations activating the PI3K/AKT signaling pathway is further strengthened by the finding of 2 additional MYOD1-mutated ERMS with PTEN deletions (Table 1 and Supplementary Figure 4). Therefore, to asses possible cooperation between these mutations, we examined the effects of PIK3CA H1047R and MYOD1 Leu122Arg in C2C12 cells. We introduced GFP, wild type MYOD1, MYOD1 Leu122Arg and MYC, each combined with PIK3CA H1047R, into C2C12 cells and compared these to C2C12 cells transfected with GFP and control vector (Figure 4a). Although introduction of PIK3CA H1047R by itself decreased the differentiation index and fusion index, this effect was not observed in combination with wild type MYOD1. However, in combination with MYOD1 Leu122Arg, differentiation was markedly inhibited (Figure 4b). While PIK3CA H1047R increased the growth of C2C12 cells regardless of MYOD1, soft-agar colony formation assays showed that only the combination of PIK3CA H1047R and MYOD1 Leu122Arg resulted in increased colony formation; notably, combining wild type MYOD1 with PIK3CA H1047R did not cause a similar increase (Figure 4c and 4d). The negative effect of wild type MYOD1 on C2C12 cell number and colony formation in the presence of normal medium appears to be due to induction of differentiation accompanied by cell fusion (Supplementary Fig. 3a). However, co-transfection of PIK3CA H1047R with wild type MYOD1 inhibited myogenic differentiation (Supplementary Fig. 3c). We further confirmed the combined effects of PIK3CA H1047R and MYOD1 Leu122Arg in C2C12 cells in vivo using cell line xenografts. While introduction of either MYOD1 Leu122Arg or PIK3CA H1047R increased in vivo growth of C2C12 cells, the combination of PIK3CA H1047R and MYOD1 Leu122Arg resulted in more rapidly growing tumors (Figure 4e). These double mutant xenograft tumors share characteristic features of ERMS such as strong nuclear MYOD1 expression, abundant mitotic activity, and high-grade nuclear atypia (Figure 4f).
Table 1. Table of clinicopathologic data on 10 patients with ERMS containing MYOD1 Leu122Arg.
The patients tend to be older than typical ERMS, with more frequent head and neck primary sites. 11p LOH: loss of heterozygosity at 11p including MYOD1, based on Affymetrix Oncoscan array data. See text for details.
| Case ID | Status | Stage | Primary Site | Age at diagnosis | Sex | 11p LOH | PI3K/AKT pathway mutation |
|---|---|---|---|---|---|---|---|
| RMS1 | Dead | Stage 3, Group III | Chest Wall | 21 | F | No | |
| RMS2 | Dead | Stage 3, Group III | Pterygopalatine Fossa | 37 | M | No | PIK3CA H1047R |
| RMS3 | Dead | Stage 3, Group I | Mandible | 32 | M | No | |
| RMS4 | n/a | n/a | Facial | 41 | F | Yes | PTEN deletion |
| RMS5 | n/a | n/a | Cheek | 32 | F | Yes | PTEN deletion |
| RMS6 | n/a | Stage 3, Group III | Left peritonsillar region | 4 | F | No | |
| RMS7 | Dead | Stage 3, Group III | Left buccal region | 35 | F | No | |
| RMS8 | Dead | n/a | Nasopharynx | 24 | F | n.a. | |
| RMS9 | Dead | Stage 4 | Left hemidiaphragm, ribs | 13 | F | Yes | PIK3CA E545K |
| RMS10 | Dead | Stage 3, Group III | Infratemporal Fossa | 12 | F | yes | PIK3CA E542K |
Figure 4. Effects of concurrent PIK3CA H1047R on MYOD1 Leu122Arg-induced phenotypes in vitro and in vivo.
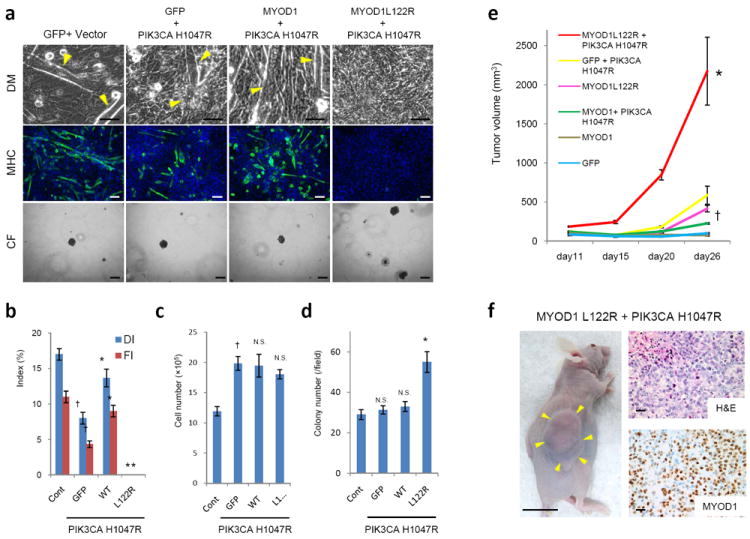
Muscle cell differentiation was evaluated by IF for MHC expression at day 5 after differentiation induction. (a) Phase contrast microscopy of C2C12 cells transfected with indicated expression plasmids including PIK3CA H1047R cultured in differentiation medium (DM) (top panel; 400X magnification; scale bar: 200 μm). Myoblast differentiation was observed by fluorescence microscopy as described above (green, MHC; blue, DAPI) (2nd panel; 100X magnification; scale bar: 100 μm). Representative images of soft agar colony formation assay (CF) (3rd panel; 100X magnification; scale bar: 100 μm). (b) The DI and the Flare plotted for each condition. The expression constructs described above were co-transfected with PIK3CA H1047R. Cont represents C2C12 cells transfected with control pBabe vector and GFP. Error bars represent SD of three independent experiments. *p < 0.01 vs. GFP; †p < 0.01 vs. Cont. (c) Evaluation of in vitro growth. For each experiment, 2×10⁴ cells were cultured in DMEM and counted at day 5. †p < 0.01 vs. Cont; N.S. not significant vs. GFP. (d) Soft agar colony formation assay. The colonies were counted at 28 days under × 40 magnification. Error bars represent SD of three independent experiments. *p < 0.01 vs. GFP; N.S. not significant vs. Cont. (e) Evaluation of xenograft growth in vivo. 1×10⁷ C2C12 cells transfected with the indicated expression constructs were injected in the subcutaneous tissue of mice. n=5 mice per group. The tumor volumes were calculated as described in Materials and Methods.*p < 0.01 vs. MYOD1 Leu122Arg; †p < 0.01 vs. GFP.(f) Xenografts of C2C12 cells co-transfected with MYOD1 Leu122Arg and PIK3CA H1047R 26 days after injection are shown. Arrows indicate tumor mass (left panel; scale bar: 1 cm). Representative photographs of tumor with hematoxylin and eosin (H&E) staining (upper right panel; scale bar: 100 μm) and IHC analysis for MYOD1 (lower right panel; scale bar: 100 μm) are shown.
As MYOD1 Leu122Arg is likely to function as an aberrant transcription factor, we examined associated gene expression changes. In C2C12 mouse cells, overlaps among both upregulated and downregulated genes were greater between MYOD1 Leu122Arg and MYC than between the former and wild type MYOD1 (p<0.001 for both upregulated and downregulated genes) (Supplementary Fig. 5a). In BJ human fibroblast cells, the overlap among downregulated genes was greater between MYOD1 Leu122Arg and MYC than between the former and wild type MYOD1 (p<0.001) but the overlap of upregulated genes was not significantly different (p=0.425) (Supplementary Fig. 5b). Unsupervised hierarchical clustering placed C2C12 cells with MYOD1 Leu122Arg into an independent cluster separate from MYC and wild type MYOD1, while, in BJ cells, MYOD1 Leu122Arg-bearing cells and MYC-bearing cells together formed a cluster separate from wild type MYOD1 cells and parental BJ cells (Supplementary Fig. 5c and 5d). Analysis of muscle differentiation genes within the MYOD1 Leu122Arg expression profiles in C2C12 and BJ cells (see Supplementary Note; Supplementary Table 4 and 5), showed that terminal myogenic genes were up-regulated by wild type MYOD1 and down-regulated by MYOD1 Leu122Arg (Figure 5), consistent with a differentiation block induced by this mutation.
Figure 5. Aberrant transcriptional effects of MYOD1 Leu122Arg.

(a) Heat maps of hierarchical clustering of the transcriptional profiles of parental, wild type MYOD1-, MYOD1 Leu122Arg-, or MYC –transfected C2C12 mouse myoblast cells. The analysis was performed on 17 mouse genes commonly expressed in skeletal muscle cells. Levels of expression are indicated on a color scale where red represents the up-regulated genes and green, the down-regulated genes. Similarities or differences in the gene expression patterns of each cell line are represented in the dendrogram. (b) Same analysis as in (a) but performed in BJ human fibroblasts. The analysis was performed on 12 human genes commonly expressed in skeletal muscle cells.
As an alternative approach to examine these gene expression relationships, we also used Gene Set Enrichment Analysis (GSEA)[14] on the gene list from MYOD1 Leu122Arg transfected C2C12 cells using the pre-ranked GSEA function and the transcription factor targets gene sets within the C3: Motif Collection from the Molecular Signature Database [14]. A MYC target gene set was among six gene sets that were significantly enriched in the MYOD1 Leu122Arg transfected C2C12 cells (Supplementary Fig. 6). Taken together, these results are consistent with previous data from electrophoretic mobility shift assays and model promoter transactivation asssays showing that the Leu122Arg mutation confers upon this mutant MYOD1 the neomorphic capacity to bind and regulate MYC target sites [7].
These observations raised the possibility of a dominant negative effect of MYOD1 Leu122Arg. Although loss of heterozygosity at 11p15 is frequent in ERMS (refs 15 & 16), our data from Affymetrix Oncoscan LOH analysis (Supplementary Fig. 4) and comparisons of mutant and wild type alleles in genotyping data (Supplementary Fig. 2) together supported loss of the wild type allele in only 5 of the 10 MYOD1 Leu122Arg tumors. This suggested that loss of the wild type MYOD1 allele was not required. Therefore, to assess a dominant negative effect of the MYOD1 Leu122Arg mutant, we compared the effect of transfecting the latter alone to that of co-transfecting it with equal amounts of wild type MYOD1 on three myogenic genes. Intriguingly, the expression levels of Myh1, Acta1 and Myog were reduced by 84%, 61% and 84%, respectively, in the co-transfected C2C12 cells compared to cells transfected with wild type MYOD1 alone (Supplementary Fig. 7). This suggests that even in the presence of wild type MYOD1, MYOD1 Leu122Arg can inhibit the expression of myogenic target genes to a supralinear degree, implying a dominant effect.
MYOD1 is known to recruit histone-modifying enzymes that increase the levels of H3K4me1 and H3K27ac to promote muscle differentiation [15]. Chromatin immunoprecipitation (ChIP) assays in C2C12 cells at three myotube-specific genes [16] Mly1, Myl2, and Casq2 showed that H3K27me3 and H3K4me1 marks were increased in the presence of MYOD1 Leu122Arg but not wild type MYOD1 (see Supplementary Note; Supplementary Fig. 8). To extend these ChIP data, we performed ChIP-sequencing (ChIP-seq) for histone marks in C2C12 cells transfected with mutant or wild type MYOD1. Consistent with the above data from individual ChIP assays, forced expression of MYOD1 Leu122Arg, but not wild type MYOD1, resulted in the emergence of peaks for these marks that were significantly enriched for the 99 differentially regulated genes described above (see Supplementary Note for details; Supplementary Table 6). Finally, to look for genome-wide evidence of a shift induced by MYOD1 Leu122Arg towards a MYC transcriptional program, we analyzed the ChIP-seq data for the activation mark H3K4me3, comparing ChIP-seq peaks to those previously defined for MYC [17]. This analysis demonstrated that, while both mutant and wild type MYOD1 are associated with deposition of H3K4me3 marks at MYC targets, this effect is highly significantly stronger for MYOD1 Leu122Arg (p<10E-15; Supplementary Table 7). These ChIP-seq data for H3K4me3 are therefore in line with the above expression profiling data showing a shift to a MYC-like transcriptional program.
Previously described genetic alterations in ERMS include LOH at 11p15 [18, 19] and activating mutations of RAS, FGFR4, and PIK3CA [8, 9, 20] but none of these define clinically distinct ERMS subsets. In contrast, ERMS tumors with MYOD1 Leu122Arg are distinctive, as they tend to present in older patients, usually arise in the head/neck, some overlap pathologically with the recently described spindle cell variant of ERMS, and have especially poor outcomes. Indeed, the poor outcomes of these patients are more similar to ARMS than to ERMS. Another parallel with ARMS is the observation that transfection of PAX-FOXO1 fusions into myoblasts leads to suppression of MYOD1 targets [21], providing a mechanism for how PAX-FOXO1 fusions may lead to differentiation arrest, even as they upregulate expression of MYOD1 itself [22, 23]. As progression through the different myogenic stages is controlled by the sequential activation of four myogenic factors, namely MYOD1, MYF5, MYOG (myogenin) and MRF4, PAX-FOXO1 fusions and MYOD1 Leu122Arg may represent alternative mechanisms to disrupt this differentiation program at the MYOD1 stage.
As MYOD1 has long been recognized as a critical regulator of skeletal muscle differentiation [24], artificial mutations have been used to explore its function, leading to the in vitro identification, over 20 years ago, of the Leu122Arg mutation as a neomorphic change.[7] Following up on that in vitro finding, the same group [25] screened for MYOD1 Leu122Arg in human RMS samples, including 19 primary RMS tumors and 14 cell lines, but no mutations were identified. Possible reasons that MYOD1 mutations were not identified in that study include a limited number of actual ERMS tested (about 20), misidentification of certain cell lines as RMS, and fewer tumor samples from patients diagnosed in late childhood or adulthood.
Although PIK3CA mutations are uncommon in ERMS (approximately 5% of cases) [8], we find that they are significantly over-represented in the subset of ERMS with MYOD1 Leu122Arg. We also observed PTEN intragenic deletions in additional cases. Together with our findings in C2C12 cells expressing MYOD1 Leu122Arg and PIK3CA H1047R, these observations suggest cooperation between a transcriptional differentiation block and mutational activation of pro-survival PI3K/AKT signaling, as has recently been established for MYCN and ALK in another major pediatric solid tumor, neuroblastoma.[26, 27] Overall, our data establish ERMS with MYOD1 Leu122Arg as a novel, molecularly defined subset of RMS that should be considered for high risk protocols and targeted therapeutic development.
METHODS
Samples for Illumina Hiseq sequencing
Frozen tumor samples and matched frozen normal tissue samples were procured at Memorial Sloan-Kettering Cancer Center (MSKCC) under Institutional Review Board–approved protocols with informed consent. DNA was extracted from RMS cell lines and frozen samples using the Qiagen DNeasy Kit according to the manufacturer’s directions.
Exome capture and high throughput sequencing
Two μg of high quality genomic DNA was captured by hybridization using the SureSelect XT HumanAllExon 51Mb (Agilent). Samples were prepared according to the manufacturer instructions. PCR amplification of the libraries was carried out for 6 cycles in the pre-capture step and for 10 cycles post capture. Samples were barcoded and run on a Hiseq 2000 in a 75bp/75bp paired end run, using the TruSeq SBS Kit v3 (Illumina). An average of 81 million paired reads were generated per sample, the duplication rate varied between 5 and 11% and 94% of the targeted region was covered at least 30X.
Transcriptome sequencing
After ribogreen quantification and quality control of Agilent BioAnalyzer, 1μg of total RNA (RIN between 5 and 7) underwent polyA selection and Truseq library preparation according to instructions provided by Illumina (TruSeq™ RNA Sample Prep Kit v2), with 6 cycles of PCR. Samples were barcoded and run on a Hiseq 2000 in a 75bp/75bp Paired end run, using the TruSeq SBS Kit v3 (Illumina). An average of 80 million paired reads were generated per sample. Ribosomal reads represented at most 0.1% of reads and the percent of mRNA bases was close to 68% on average.
Illumina Hiseq Exome Variant Calling Pipeline
FASTQ files generated by the CASAVA bcl2fastq scripts were processed in the default block size of 4,000,000 reads per block. The reads were clipped of adapter sequences using fastx_clipper from the FASTX toolkit. The adapters specific to the R1 and R2 reads were used and any reads shorter than 50bp after clipping were discarded. Reads were then trimmed using the fastq_quality_trimmer to cut bases with a base quality less than 3 and again reads shorter than 50bp were dropped. Using a custom Perl script, we repaired reads and any read whose pair was discard in the clipping/trimming phase was moved to a file of single end reads to be processed separately.
All reads were then mapped to a genome comprising just the assembled chromosomes (chr1-chr22, chrX, chrY, chrM) of build hg19 of the human genome. BWA version 0.5.9-r16 was used. bwa aln was used for both paired and single end reads. Then SAM files were created using bwa sampe for paired reads and bwa samse for single end reads. Read Groups were added at this point and the SAM files were filtered for proper pairing and unique maps (MAPQ>0). The blocks were sorted and then merged using PICARD MergeSamFiles and duplicates were removed using PICARD MarkDuplicates.
Next, the BAMs for all samples were processed following the GATK best practices guidelines. GATK version 1.6-7 was used. First, the BAMs were realigned using GATK RealignerTargetCreator followed by GATK IndelRealigner. These steps were done on all samples with each chromosome processed in parallel. Then the quality scores were recalibrated. GATK CountCovariates was run using the following covariates: ReadGroupCovariate, QualityScoreCovariate, CycleCovariate, DinucCovariate, MappingQualityCovariate, MinimumNQSCovariate. The recalibrated BAMs were then computed with GATK TableRecalibration. To call variants, we used the GATK Unified Genotyper separately for SNPs and INDELs. The following options were used. For SNP calling: -stand_call_conf 50.0, -stand_emit_conf 10.0, -dcov 500, -mbq 15; and for INDEL calling: -stand_call_conf 50.0, -stand_emit_conf 10.0, -dcov 500, -mbq 15.
To filter for somatic events, we used a custom Python script that discards events flagged by GATK as LowQual then we filtered for events that were genotyped 0/0 in the normal sample and not 0/0 in the tumor sample (i.e. 0/1 or 1/1). We also filtered for a minimum coverage of 2 reads with a given variant (i.e. AD_ALT>1) in the tumor and a minimum coverage of 2 reads that matched the reference (AD_REF>1) in the normal. We also filtered on the non-reference allele frequency (NRAF) such that NRAF_TUMOR>NRAF_NORMAL+0.10; i.e. is the tumor had to have an NRAF 10 percentage points higher than the normal. Finally, we retained only events that either changed the amino acid sequence (missense or nonsense, or any indel targeting an exon) or events that occurred at splice sites.
For the unpaired tumor samples (lacking matched normals), we used the following two subtraction filters. First, we removed events that were called in either of the two normal samples and, second, we removed any events from a curated version of dbSNP 135. The curation consisted in removing any SNPs from dbSNP that were annotated as having clinical significance, specifically any SNP that had an OM, CLN, PMC, or PM tag in its VCF entry.
Illumina Hiseq RNAseq Variant Calling Pipeline
To call variants in RNAseq data, we used a custom pipeline based on TopHat and VarScan. The sequence data were mapped using TopHat (v 1.4.0) with the transcriptome mapping option on, using the RefSeq gene GTF from UCSC with genes smaller than 150 bp removed. The BAM files from TopHat were processed to make them compatible with VarScan. This consisted of reordering the chromosome header information to match the correct genome order, marking reads with read groups and coordinate sorting the file. We then used samtools mpileup with the depth parameter set to 1000 (-d 1000) and passed the pileup to VarScan (v 2.3.2) mpileup2snp. The previous exome calls were then intersected with the RNAseq calls creating a list of events that were present in both datasets. The combined calls were filtered to have a combined depth of at least 10 reads (DP_RNA+DP_EXOME>=10) and again filtered for events that changed the amino acid sequence. Finally, they were also filtered against the curated dbSNP 135 database described in the preceding section.
Validation samples and Sequenom-based DNA genotyping
Formalin-fixed paraffin-embedded (FFPE) ERMS samples were procured at MSKCC under Institutional Review Board–approved protocols. Additional FFPE ERMS samples were acquired at the Brigham and Women’s Hospital, Boston (JAF) (13 ERMS), at the University Hospital Gasthuisberg, Leuven (RS) (9 ERMS), and at the University of Nebraska Medical Center, Omaha (JB) (6 ERMS), under respective institutional protocols. In addition, 3 ERMS cell lines were included in the set: RD (American Type Culture Collection, Manassas, VA, USA), RMS559 (from J.A.F.), and the clonally related lines CT-TC (from Dr Hajime Hosoi) and SMS-CTR (from Fred Barr). These validation samples were studied using the MassARRAY system (Sequenom), which is based on matrix-assisted laser desorption/ionization —time-of-flight/mass spectrometry (MALDI-TOF/MS). Genotyping by this method relies on the principle that mutant and wild-type alleles for a given point mutation produce single-allele base extension reaction products of a mass that is specific to the sequence of the product. Mutation calls are based on the mass differences between the wild-type product and the mutant products as resolved by MALDI-TOF/MS. Amplification and extension primers were designed using Sequenom Assay Designer v3.1 software to target the curated list of mutations. Amplification primers were designed with a 10-mer tag sequence to increase their mass so that they fall outside the range of detection of the MALDI-TOF/MS. The sequences of the primers are shown in Supplementary Table 8.
Immunohistochemistry
IHC was performed on formalin-fixed paraffin-embedded (FFPE) sections using MYOD1 antibody (Thermo Scientific, MS-278-P) and a Ventana immunostainer Discovery XT. After pretreatment (CC1), primary antibody was applied (dilution 1:50) for 90 minutes. The iView Detection Kit (Ventana) was used for detection following the manufacturer’s recommendations.
Statistical analysis of survival data
Curves for overall survival (calculated as the time from diagnosis) were constructed using the Kaplan-Meier method and compared between groups using the log-rank test.
Cell lines
Mouse myoblast cell line C2C12 (ATCC#CRL-1772) was purchased from American Type Culture Collection (Manassas, VA, USA). Human telomerase catalytic subunit (hTERT)-expressing BJ cells, human diploid foreskin fibroblasts was kindly provided by Dr. Shinya Tanaka (Hokkaido University, Japan). All cell lines were cultured in Dulbecco’s modified minimal essential medium (DMEM) supplemented with 10% fetal bovine serum (FBS) (Hyclone, Logan, UT, USA).
Immunofluorescence
Cells grown on glass coverslips were fixed with 4% formaldehyde and blocked in PBS containing 2% goat serum (Invitrogen, Carlsbad, CA, USA), 1% bovine serum albumin (Sigma-Aldrich, St. Louis, MO, USA), 0.1% Tween 20, and 0.05% Triton X-100 (Sigma-Aldrich, St. Louis, MO, USA) for 1 h at room temperature. The cells were then incubated with the MF20 monoclonal antibody (MAb) against MHC (1:40; DSHB, Iowa City, IA, USA) for 2.5 h and subsequently with an Alexa Fluor 488- or Alexa Fluor 594-conjugated secondary antibody (1:200; Invitrogen, Carlsbad, CA, USA) for 1 h at room temperature. Cells were mounted with ProLong Gold antifade reagent with DAPI (4=,6-diamidino-2-phenylin-dole; Invitrogen, Carlsbad, CA, USA).
Preparation of retrovirus and transduction of cell lines
For retrovirus production, the pcx4 [28]and pBabe vectors system were used. Human MYOD1 and MYC cDNA plasmids were purchased from Sino Biological Inc and subcloned into pcx4bleo. MYOD1 Leu122Arg mutant was generated using the QuikChange II site-directed mutagenesis kit (Agilent Technologies, La Jolla, CA, USA) and subcloned into pcx4bleo. pBabe-puro (Addgene plasmid 1764), pBabe puro HA PIK3CA H1047R (Addgene plasmid 12524) and pBabe puro HA PIK3CA E545K (Addgene plasmid 12525) were obtained from Addgene (Cambridge, MA, USA). Retroviruses were obtained by using 293T cells as packaging cells, and were infected into C2C12 and BJ cell lines and selected with 500 μg/ml Zeocin or 2 μg/ml puromycin (Invitrogen, Carlsbad, CA, USA).
Immunoblotting
Cells were lysed in M-PER lysis buffer (Pierce Biotechnology, Rockford, IL, USA). The lysates were denatured in 4 × sample buffer at 70°C for 10 min, resolved in 4–12% NuPAGE gels (Invitrogen, Carlsbad, CA, USA) and transferred onto PVDF membranes. The membranes were blocked in 5% nonfat milk in TBST buffer for 1 h at room temperature and probed with primary antibody obtained from the following sources: anti-MYOD1 monoclonal antibodies (MAb) (EMD Millipore Corporation, Billerica, MA, USA, Cat #MAB3878,); anti-GAPDH MAb (GeneTex, Irvine, CA, USA, Cat #GTX627408,); anti- CMYC polyclonal Ab (Santa Cruz Biotechnology, San Diego, CA, USA, Cat #sc-40); anti-PI3 Kinase p110α MAb (Cell Signaling Technology, Beverly, MA, USA, Cat #4249). Bound antibodies were detected with peroxidase-labeled goat antibody to mouse IgG or goat antibody to rabbit IgG, and visualized by enhanced chemiluminescence reagents (Amersham Biosciences, Piscataway, NJ, USA).
Myogenic Differentiation Assays
To induce myoblast differentiation, cells were grown to 70% confluence and then cultured in differentiation media containing DMEM supplemented with 2% horse serum (Gibco, Carlsbad, CA, USA). Differentiation media were replaced every 24 h. To quantify the differentiation and fusion phenotypes of C2C12 cells under different experimental conditions, we calculated differentiation index (DI) as: (nuclei within MHC-positive myocytes/total number of nuclei) × 100; or the fusion index (FI) as: (nuclei within MHC-positive myocytes containing > 3 nuclei/ total number of nuclei) × 100.
Soft-agar colony formation assay
Single-cell suspensions of 1×10⁴ cells were plated per 35-mm culture dish in 1.5 ml of DMEM containing 10% FBS and 0.4%Bacto Agar (BD Difco, Detroit, MI, USA.) on a layer of 1.5 ml of the same medium containing 0.6% Bacto Agar. Plates were fed weekly with 0.3 ml of DMEM/10% FBS. Four weeks after plating, colonies were stained with Trypan blue (Sigma-Aldrich, St. Louis, MO, USA), photographed, and counted.
Xenograft tumor assay
For xenograft preparation, 10,000,000 cells were injected s.c. into randomly selected 8-week-old female athymic nude mice (Harlan) together with Matrigel (BD Biosciences). The average tumor volume in each group was expressed in cubic millimeter and calculated using the formula π / 6 × (large diameter) × (small diameter)2. The tumors injections and volume measurements were performed in a blinded manner. All animal procedures were carried out according to protocols approved by the Institutional Animal Care and Use Committee at Memorial Sloan-Kettering Cancer Center.
Microarray analysis
For expression microarray analysis, RNAs were processed at MSKCC according to procedures recommended by Affymetrix (Santa Clara, CA, USA). The Affymetrix GeneChip Human Genome U133 Plus 2.0 Array (HG-U133 Plus 2.0) is comprised of 1,300,000 unique oligonucleotide features covering over 47,000 transcripts and variants, which, in turn, represent approximately 39,000 of the best characterized human genes. The GeneChip® Mouse Genome 430A 2.0 Array (Mouse 430A 2.0) is a single array comprised of over 22,600 probe sets representing over 14,500 well-substantiated mouse genes. Array hybridization and scanning were performed at the MSKCC Genomics Core Laboratory. The RMA method [29] was used to process the Affymetrix gene expression microarray data. Hierarchical clustering was used to cluster the arrays based on the expression profile of all genes on the array. Pearson correlation was used as the similarity/distance measure and the Ward function was used as the link function for the clustering. The array clustering is presented as dendrograms. Fold change greater than 2 is used to select genes that are differentially expressed between cell lines. The expression data of selected genes were displayed as heatmaps. The array analyses were done using the R software and the Bioconductor package [30]. Gene set enrichment analysis (GSEA) [14] was performed on the gene list from MYOD1 Leu122Arg transfected C2C12 cells using the preranked GSEA function and the transcription factor target gene sets within the C3: Motif Collection from the Molecular Signature Database [14]. Genes were ranked according to their differential expression scores and GSEA was run with default settings.
Affymetrix Oncoscan Analysis
For the Oncoscan FFPE Assay, DNA was extracted using Qiagen DNeasy Blood and Tissue Kit. 80ng of genomic DNA was used for each sample. Processing of samples was performed as per manufacturer (Affymetrix) guidelines. Assay data was analyzed by the combination of OncoScan Console Software and OncoScan Nexus Express Software.
Chromatin immunoprecipitation
ChIP was performed by using Magna ChIP™ A system (Millipore), and sonication was performed to obtain chromatin fragments of approximately 150 bp. Antibodies used for ChIP were rabbit IgG (Millipore), H3K27me3, H3K27Ac, H3K4me1 and H3K4me3 (Abcam). Quantitative real-time PCR (qPCR) was performed using a StepOne Plus real-time PCR system (Applied Biosystems, Foster City, CA) with SYBR Green DNA polymerase (Applied Biosystems, Warrington, UK). Data were normalized by the percent of input and expressed as fold increase relative to control. The sequences of primers are shown in Supplementary Table 8.
ChIP-Seq
ChIP fragments were sequenced for both 100 and 75 cycles on an Illumina HiSeq2500. The longer length runs were cut to 75 bp and then adapters were removed using the FASTX toolkit. Sequence alignment was performed using BWA [31] against the mouse genome assembly mm10. BWA version 0.7.5a was used and the ALN/SAMSE mode of the aligner was run. The output SAM files had readGroups added and sorted in coordinate order using the PICARD toolkit. Peaks were then called using MACS [32] version 1.4. For samples targeting histone binding factors the --nomodel option was used. For all samples MACS [32] was run in pairwise mode with a matched control sample. Differential binding analysis was performed using the DiffBind R Bioconductor package [33], using the TMM method for normalization and the edgeR method for differential analysis, employing the default settings and filtering with a mapping quality of at least 15. To define the overlap between identified peaks and 99 differentially expressed genes in the presence of ectopic expression of MYOD Leu122Arg or wild type MYOD1, for each sample, the unique genes closest to the summits of the peaks were identified and the intersection of the gene lists generated for each triplicate was used as a consensus set of unique genes. Gene set enrichment analysis was performed using hypergeometric tests, using 34,060 as the total number of genes as defined as the number of genes with nucleotide sequence data by the Mouse Genome Informatics.
Supplementary Material
Acknowledgments
This work was supported by a generous donation from M.B. Zuckerman (M.L.) and by the Virginia and Daniel K. Ludwig Trust for Cancer Research (J.A.F.). S.K. was supported in part by the Yasuda Medical Foundation and the HIROKO International Academic Exchange Foundation. F.G.B. is supported by the Intramural Research Program of the National Cancer Institute. The MSKCC Sequenom facility was supported by the Anbinder Fund. We thank Dr. Hajime Hosoi (Kyoto Prefectural University of Medicine, Kyoto, Japan), and Drs. Shinya Tanaka and Masumi Tsuda (both at Hokkaido University, Japan) for providing cell lines. Also, we thank Drs. Tsuyoshi Akagiand Ken Sasai (both at KAN Research Institute, Inc., Kobe, Japan) for providing the pcx4bleo plasmid. We are also grateful to Mr. Jeffrey Zhao (Genomics Core Laboratory, MSKCC) for technical assistance with microarray analysis, to Dr. Laetitia Borsu for assistance with Sequenom analyses, and to Dr. Elisa de Stanchina and Rudy Tieu (Antitumor Testing Core Facility, MSKCC) for the xenograft studies.
Footnotes
AUTHOR CONTRIBUTIONS
S.K., N.S., N.A. contributed equally. S.K. performed myogenic differentiation studies, individual ChIP assays, and in vivo studies. N.S. collected and analysed clinical data and performed Sequenom genotyping studies with assistance from D.L. and A.M. N.A. obtained whole exome and whole transcriptome sequencing data with assistance from A.V. and the data were processed and analyzed by M.P. and N.D.S. S.K. obtained expression microarray data with assistance from A.V. and the data were analysed by L.X.Q. T.I. generated ChIP-seq data with assistance from A.V. and the data were processed by M.P. and N.D.S. and analysed by C.K.Y.N. and J.S.R.F. L.W. generated and interpreted the Affymetrix OncoScan array data. R.S., J.B., S. S., P. M., L.H.W., F.G.B., S.D., and J. A.F. provided RMS samples or cell lines, including clinical or pathologic data. S.K., N.S., and M.L. drafted, edited and wrote the manuscript. M.L. led the project and manuscript preparation.
Data access
The array analyses were done using the R software [http://www.r-project.org/].
The ChIP-seq analyses were done using FASTX toolkit (http://hannonlab.cshl.edu/fastx_toolkit/index.html), the mouse genome assembly mm10 (full assembly from UCSC, http://genome.ucsc.edu/cgi-bin/hgGateway?hgsid=357895991) and PICARD toolkit (http://picard.sourceforge.net/).
Gene set enrichment analysis was performed using hypergeometric tests (nemates.org/MA/progs/overlap_stats.html) and the Mouse Genome Informatics (http://www.informatics.jax.org/genes.shtml, 17 Dec 2013).
The microarray data discussed in this publication have been deposited in NCBI’s Gene Expression Omnibus and are accessible through GEO Series accession number GSE56078 and GSE56079. The exome sequencing data and RNA-seq data discussed in this publication have been deposited in NCBI’s Sequence Read Archive and are accessible through SRA Series accession number SRP040425 and SRP010454.
Competing financial interests
The authors declare no competing financial interests.
References
- 1.Malempati S, Hawkins DS. Rhabdomyosarcoma: review of the Children’s Oncology Group (COG) Soft-Tissue Sarcoma Committee experience and rationale for current COG studies. Pediatr Blood Cancer. 2012;59(1):5–10. doi: 10.1002/pbc.24118. [DOI] [PMC free article] [PubMed] [Google Scholar]
- 2.Xia SJ, Pressey JG, Barr FG. Molecular pathogenesis of rhabdomyosarcoma. Cancer Biol Ther. 2002;1(2):97–104. doi: 10.4161/cbt.51. [DOI] [PubMed] [Google Scholar]
- 3.Breneman JC, et al. Prognostic factors and clinical outcomes in children and adolescents with metastatic rhabdomyosarcoma--a report from the Intergroup Rhabdomyosarcoma Study IV. J Clin Oncol. 2003;21(1):78–84. doi: 10.1200/JCO.2003.06.129. [DOI] [PubMed] [Google Scholar]
- 4.Davis RJ, et al. Fusion of PAX7 to FKHR by the variant t(1;13)(p36;q14) translocation in alveolar rhabdomyosarcoma. Cancer Res. 1994;54(11):2869–72. [PubMed] [Google Scholar]
- 5.Galili N, et al. Fusion of a fork head domain gene to PAX3 in the solid tumour alveolar rhabdomyosarcoma. Nat Genet. 1993;5(3):230–5. doi: 10.1038/ng1193-230. [DOI] [PubMed] [Google Scholar]
- 6.Barr FG, et al. Rearrangement of the PAX3 paired box gene in the paediatric solid tumour alveolar rhabdomyosarcoma. Nat Genet. 1993;3(2):113–7. doi: 10.1038/ng0293-113. [DOI] [PubMed] [Google Scholar]
- 7.Van Antwerp ME, et al. A point mutation in the MyoD basic domain imparts c-Myc-like properties. Proc Natl Acad Sci U S A. 1992;89(19):9010–4. doi: 10.1073/pnas.89.19.9010. [DOI] [PMC free article] [PubMed] [Google Scholar]
- 8.Shukla N, et al. Oncogene mutation profiling of pediatric solid tumors reveals significant subsets of embryonal rhabdomyosarcoma and neuroblastoma with mutated genes in growth signaling pathways. Clin Cancer Res. 2012;18(3):748–57. doi: 10.1158/1078-0432.CCR-11-2056. [DOI] [PMC free article] [PubMed] [Google Scholar]
- 9.Taylor JGt, et al. Identification of FGFR4-activating mutations in human rhabdomyosarcomas that promote metastasis in xenotransplanted models. J Clin Invest. 2009;119(11):3395–407. doi: 10.1172/JCI39703. [DOI] [PMC free article] [PubMed] [Google Scholar]
- 10.Ledent V, Paquet O, Vervoort M. Phylogenetic analysis of the human basic helix-loop-helix proteins. Genome Biol. 2002;3(6):RESEARCH0030. doi: 10.1186/gb-2002-3-6-research0030. [DOI] [PMC free article] [PubMed] [Google Scholar]
- 11.Nascimento AF, Fletcher CD. Spindle cell rhabdomyosarcoma in adults. Am J Surg Pathol. 2005;29(8):1106–13. [PubMed] [Google Scholar]
- 12.Carroll SJ, Nodit L. Spindle cell rhabdomyosarcoma: a brief diagnostic review and differential diagnosis. Arch Pathol Lab Med. 2013;137(8):1155–8. doi: 10.5858/arpa.2012-0465-RS. [DOI] [PubMed] [Google Scholar]
- 13.Crescenzi M, Crouch DH, Tato F. Transformation by myc prevents fusion but not biochemical differentiation of C2C12 myoblasts: mechanisms of phenotypic correction in mixed culture with normal cells. J Cell Biol. 1994;125(5):1137–45. doi: 10.1083/jcb.125.5.1137. [DOI] [PMC free article] [PubMed] [Google Scholar]
- 14.Subramanian A, et al. Gene set enrichment analysis: a knowledge-based approach for interpreting genome-wide expression profiles. Proc Natl Acad Sci U S A. 2005;102(43):15545–50. doi: 10.1073/pnas.0506580102. [DOI] [PMC free article] [PubMed] [Google Scholar]
- 15.Asp P, et al. Genome-wide remodeling of the epigenetic landscape during myogenic differentiation. Proc Natl Acad Sci U S A. 2011;108(22):E149–58. doi: 10.1073/pnas.1102223108. [DOI] [PMC free article] [PubMed] [Google Scholar]
- 16.Blum R, et al. Genome-wide identification of enhancers in skeletal muscle: the role of MyoD1. Genes Dev. 2012;26(24):2763–79. doi: 10.1101/gad.200113.112. [DOI] [PMC free article] [PubMed] [Google Scholar]
- 17.Chen X, et al. Integration of external signaling pathways with the core transcriptional network in embryonic stem cells. Cell. 2008;133(6):1106–17. doi: 10.1016/j.cell.2008.04.043. [DOI] [PubMed] [Google Scholar]
- 18.Davicioni E, et al. Molecular classification of rhabdomyosarcoma--genotypic and phenotypic determinants of diagnosis: a report from the Children’s Oncology Group. Am J Pathol. 2009;174(2):550–64. doi: 10.2353/ajpath.2009.080631. [DOI] [PMC free article] [PubMed] [Google Scholar]
- 19.Scrable HJ, et al. Rhabdomyosarcoma-associated locus and MYOD1 are syntenic but separate loci on the short arm of human chromosome 11. Proc Natl Acad Sci U S A. 1990;87(6):2182–6. doi: 10.1073/pnas.87.6.2182. [DOI] [PMC free article] [PubMed] [Google Scholar]
- 20.Stratton MR, et al. Detection of point mutations in N-ras and K-ras genes of human embryonal rhabdomyosarcomas using oligonucleotide probes and the polymerase chain reaction. Cancer Res. 1989;49(22):6324–7. [PubMed] [Google Scholar]
- 21.Calhabeu F, et al. Alveolar rhabdomyosarcoma-associated proteins PAX3/FOXO1A and PAX7/FOXO1A suppress the transcriptional activity of MyoD-target genes in muscle stem cells. Oncogene. 2013;32(5):651–62. doi: 10.1038/onc.2012.73. [DOI] [PubMed] [Google Scholar]
- 22.Cao L, et al. Genome-wide identification of PAX3-FKHR binding sites in rhabdomyosarcoma reveals candidate target genes important for development and cancer. Cancer Res. 2010;70(16):6497–508. doi: 10.1158/0008-5472.CAN-10-0582. [DOI] [PMC free article] [PubMed] [Google Scholar]
- 23.Ahn EH, et al. Identification of target genes of PAX3-FOXO1 in alveolar rhabdomyosarcoma. Oncol Rep. 2013;30(2):968–78. doi: 10.3892/or.2013.2513. [DOI] [PMC free article] [PubMed] [Google Scholar]
- 24.Davis RL, Weintraub H, Lassar AB. Expression of a single transfected cDNA converts fibroblasts to myoblasts. Cell. 1987;51(6):987–1000. doi: 10.1016/0092-8674(87)90585-x. [DOI] [PubMed] [Google Scholar]
- 25.Anand G, et al. Rhabdomyosarcomas do not contain mutations in the DNA binding domains of myogenic transcription factors. J Clin Invest. 1994;93(1):5–9. doi: 10.1172/JCI116982. [DOI] [PMC free article] [PubMed] [Google Scholar]
- 26.Zhu S, et al. Activated ALK collaborates with MYCN in neuroblastoma pathogenesis. Cancer Cell. 2012;21(3):362–73. doi: 10.1016/j.ccr.2012.02.010. [DOI] [PMC free article] [PubMed] [Google Scholar]
- 27.Berry T, et al. The ALK(F1174L) mutation potentiates the oncogenic activity of MYCN in neuroblastoma. Cancer Cell. 2012;22(1):117–30. doi: 10.1016/j.ccr.2012.06.001. [DOI] [PMC free article] [PubMed] [Google Scholar]
- 28.Akagi T, Sasai K, Hanafusa H. Refractory nature of normal human diploid fibroblasts with respect to oncogene-mediated transformation. Proc Natl Acad Sci U S A. 2003;100(23):13567–72. doi: 10.1073/pnas.1834876100. [DOI] [PMC free article] [PubMed] [Google Scholar]
- 29.Irizarry RA, et al. Exploration, normalization, and summaries of high density oligonucleotide array probe level data. Biostatistics. 2003;4(2):249–64. doi: 10.1093/biostatistics/4.2.249. [DOI] [PubMed] [Google Scholar]
- 30.Gentleman RC, et al. Bioconductor: open software development for computational biology and bioinformatics. Genome Biol. 2004;5(10):R80. doi: 10.1186/gb-2004-5-10-r80. [DOI] [PMC free article] [PubMed] [Google Scholar]
- 31.Li H, Durbin R. Fast and accurate long-read alignment with Burrows-Wheeler transform. Bioinformatics. 2010;26(5):589–95. doi: 10.1093/bioinformatics/btp698. [DOI] [PMC free article] [PubMed] [Google Scholar]
- 32.Zhang Y, et al. Model-based analysis of ChIP-Seq (MACS) Genome Biol. 2008;9(9):R137. doi: 10.1186/gb-2008-9-9-r137. [DOI] [PMC free article] [PubMed] [Google Scholar]
- 33.Ross-Innes CS, et al. Differential oestrogen receptor binding is associated with clinical outcome in breast cancer. Nature. 2012;481(7381):389–93. doi: 10.1038/nature10730. [DOI] [PMC free article] [PubMed] [Google Scholar]
Associated Data
This section collects any data citations, data availability statements, or supplementary materials included in this article.