

Abstract
Creep is the deformation that occurs under a prolonged, sustained load and can lead to permanent damage in bone. Creep in bone is a complex phenomenon and varies with type of loading and local mechanical properties. Human trabecular bone samples from proximal tibia were harvested from a 71-year old female cadaver with osteoporosis. The samples were initially subjected to one cycle load up to 1% strain to determine the creep load. Samples were then loaded in compression under a constant stress for two hours and immediately unloaded. All tests were conducted with the specimens soaked in phosphate buffered saline with proteinase inhibitors at 37°C. Steady state creep rate and final creep strain were estimated from mechanical testing and compared with published data. The steady state creep rate correlated well with values obtained from bovine tibial and human vertebral trabecular bone, and was higher for lower density samples. Tissue architecture was analyzed by micro-computed tomography (μCT) both before and after creep testing to assess creep deformation and damage accumulated. Quantitative morphometric analysis indicated that creep induced changes in trabecular separation and the structural model index. A main mode of deformation was bending of trabeculae.
Keywords: trabecular bone, creep, microscopy, micro-computed tomography
1. Introduction and background
Around 600,000 knee replacement surgeries are performed in the US annually, and such surgeries are one of the most common [1,2] and costly [3] surgical procedures. Although most recipients are older patients, in recent years the number of young people receiving implants has significantly increased. One major failure mechanism is loosening of the implant due to loss of fixation at the bone/implant interface. One possible cause of this loosening is creep deformation of the trabecular bone due to initial malalignment of the implant. Significant shear stresses can then develop at the interface, and such stresses are associated with loosening [4]. Since the internal architecture and alignment of trabecular bone in the proximal tibia varies among individuals, the optimal alignment of an implant may be patient-specific.
Creep is the deformation that occurs under a prolonged, sustained load and can lead to permanent damage in bone [5,6]. One manifestation of creep damage is the decreased stature of elderly individuals due to the creep damage of vertebrae [7,8]. Although creep failure in the trabecular bone of the knee has not been explored, loosening of hip implants has been attributed to this mechanism [9–11]. Therefore a detailed knowledge of materials and mechanical properties of bone from specific areas relevant to knee implant placement would shed light into this important cause of human disease and maladaptation.
A total knee implant typically consists of a femoral component, tibial tray and insert, and patellar component (Fig. 1a). The implant is anchored in the trabecular bone of both the femur and tibia (Fig. 1b). The integrity of the implant/bone interface depends on the age of the patient (which affects bone mineral content, trabecular architecture, and porosity) and the applied load (weight, lifestyle, and possible deformity of knee bones). The trabecular architecture (thickness of individual trabeculae, alignment, and overall density distribution) is shown in Fig. 2. Creep values vary for different trabecular architectures [7], so that many trabecular parameters may be crucial for optimal implant alignment procedure with respect to the creep behavior of the bone.
Figure 1.

(a) Total knee replacement hardware, (b) X-ray of total knee replacement, anteroposterior view.
Figure 2.
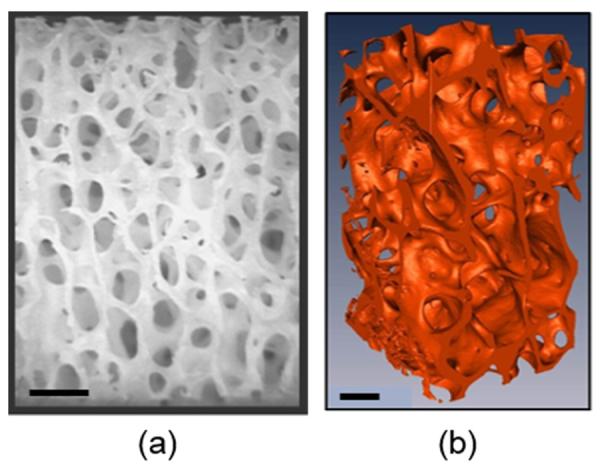
Trabecular bone images: (a) Stereo-micrograph (taken from Chen and McKittrick, [12]), (b) Micro-computed tomography isosurface image (taken from Hamed et al., [13]). Scale bars = 1 mm.
Bone is a viscoelastic material having time-dependent mechanical properties when subjected to a sustained load [14–17]. Mechanical properties of trabecular bone strongly depend of anatomical sites, and, as a result, on the density distribution for these sites [18,19]. In addition to the density, the internal architecture of trabecular bone (rods versus plates) structure also varies with anatomical location [20–22]. For example, trabeculae from vertebral areas are mostly rod-like, while in the metaphyses and epiphyses of long bones there is a more balanced mixture of plate-like and rod-like trabeculae [18,23]. Furthermore, it was shown that these cellular structures degrade differently during the progression of osteoporosis, resulting in differences in degree of anisotropy of mechanical properties [23]. All these findings highlight the complexity and importance of the internal structure of trabecular bone and the significance to the mechanical response.
The creep failure strength is much lower than the monotonic, quasi-static strength, because damage is able to accumulate over a longer period of time. Creep in bone is a complex phenomenon and varies with type of loading and local mechanical properties [19,24,25]. Creep occurs in three stages: primary, secondary and tertiary, as shown by the schematic curve in Fig. 3. Primary creep is the brief initial period during which the creep rate decreases and is accompanied with some material relaxation. In secondary creep, which is the longest and most studied regime, a steady state creep rate (dε/dt) is observed. Tertiary creep, occurring at the end of the secondary regime, is associated with an accelerated creep rate and more damage accumulation that results in eventual failure if the load is sustained. If the creep test is stopped during the secondary stage and the load removed, there is some elastic and viscoelastic strain recovery.
Figure 3.

Schematic representation of creep curve, showing primary, secondary, and tertiary creep stages. If the load is removed during secondary creep, after some elastic recovery there is a resultant permanent deformation, which is the creep damage.
For bovine tibial trabecular bone, Bowman et al. [26] found a relationship between the steady state compressive creep rate and applied stress:
| (1) |
where σcreep/Eo = normalized stress (applied creep stress/initial stiffness) and A is a fitting parameter. The specimens were cut such that the primary trabecular alignment was parallel to the applied load. This equation implies that there is a strong power law relationship between the creep rate and applied stress. It was also determined that there is a strong negative power law relationship between the creep rate and bone density, ρ:
| (2) |
Where B is a fitting parameter. Eqns. (1) and (2) indicate that the applied load and trabecular architecture are of primary importance in creep studies.
Surprisingly, there are no studies on creep deformation of trabecular bone from the human knee, and only a few studies on human vertebral trabecular bone [7,8,27,28]. In Pollintine et al., [8] it was demonstrated that under a prolonged load, microcracking of the bone matrix (and not fracture of the whole trabeculae) was the primary mode of deformation during creep. On the other hand, it was shown that even small damage, barely distinguished on radiographs, to older vertebrae accelerates creep, and leads to a visible contribution to a vertebra deformity [27]. Yamamoto et al. [28] suggested that fracture of vertebra, not related to a specific trauma, could be a result of prolonged creep deformation.
Micro-computed tomography (μCT) is a powerful imaging method that is useful for evaluating trabecular bone structure. Patel et al. [29] evaluated normal and osteoarthritic human tibial trabecular bone with μCT and found that medial and lateral regions have different microstructural parameters, associated with higher stresses in the former. Additionally, arthritic bone was found to have lower trabecular thickness (TbTh), and bone volume fraction (BV/TV = bone volume/total volume), but higher trabecular separation (TbSp) and structural model index (SMI), compared to the normal bone.
Several groups have investigated correlations between structural parameters measured by μCT and the mechanical properties of trabecular bone from different anatomical regions [22,25,30–33]. Goulet et al. [25] found strong positive correlations between BV/TV, trabecular plate number and connectivity with the modulus and ultimate strength. Ulrich et al. [22] showed that evaluation of bone mechanical properties can be improved by the combined analysis of μCT structural parameters and bone mineral density. Furthermore, it was found that BV/TV strongly positively correlates with elastic modulus values from finite element modeling and with the yield and ultimate strengths found experimentally [30].
Mittra et al., [33] found the ultimate strength did not significantly correlate with the trabeculae thickness, while it did correlate with trabecular number. Nagaraja et al., [32] used a combination of μCT analysis, specimen staining, and finite element analysis to assess damage under compressive loading. They concluded that the longitudinal trabecula failed by buckling whereas the transverse one failed by bending and shear. Experimental and finite element modeling results demonstrated that damage was localized to regions of high stress and strain, and occurred at lower values than reported values of yield stress and strain. Judex et al., [31] demonstrated that the combination of μCT imaging with material composition analysis could provide a powerful tool to assess bone quality and probability of fracture. The results support that the analysis of bone microstructure may lead to improvements for clinical applications.
The main objectives of this study were to characterize the creep properties of trabecular bone from specific areas in the human knee area, relevant to implant placement in the proximal tibia, and to evaluate the feasibility of using μCT to identify changes in trabecular architecture that may underlie creep damage behavior.
2. Materials and methods
2.1 Sample preparation
Human trabecular bone samples from proximal tibia were harvested from 71-year old female cadaver with osteoporosis. The post mortem time of the cadaver was about 10 months, during this time bone was frozen below −20°C. First, a slice, 10 mm thick, from the top part of proximal tibia (immediately below the layer of articular cartilage) was cut by hand with an electrical saw and then sectioned by a low-speed diamond saw into 17 samples, shown in Fig. 4a. The rectangular parallelepiped samples, 5 mm × 5 mm × 10 mm, were cut by a diamond blade under constant water irrigation with the surfaces maintained as parallel as possible. Keaveny and co-workers have extensively investigated sample preparation and compressive testing of trabecular bone [26,34,35]. They found that friction between the sample and platens was an unwanted artifact (end effect), concluding that sample dimensions are critical and recommending an aspect ratio of 2:1. The bone marrow was included in the test for a more realistic simulation of the in-vivo condition. After they were cut, the samples were immediately measured with digital calipers and weighed wet (with the marrow) to calculate the density.
Figure 4.

(a) Sample map for the proximal tibia. The green color corresponds to the samples with complete creep curve, the red samples fractured prematurely during the initial loading, and the blue samples underwent abnormally high deformation. (b) Variation of density and creep stress (taken at 1% strain) for the samples. Top number - density (g/cm3); bottom number - creep stress, σcreep (MPa).
2.2 Creep testing
The samples were first subjected to one preconditioning cycle up to 1% compressive strain at a strain rate equal to 10−3/sec. in a universal testing machine equipped with 500N load cell (Instron 3342 Single Column System, Norwood, MA) to determine the initial elastic (secant) modulus (Eo) and creep stress for each particular sample. Carter and Hayes, [36] observed the marrow only influenced the mechanical properties at strain rates > 10 s−1. The (constant) creep stress (σcreep) was selected at 1% strain, and varied from sample to sample due differences in density between samples. An external deflectometer SATEC model I3540 (Epsilon Technology Corp., Jackson, WY) was used to measure the small displacement; it was attached to the loading platen to eliminate the possible errors due to machine compliance. No special care was taken to secure the sample ends that are flush with the platens, therefore the strains measured maybe slightly higher than for samples prepared with end caps [26]. The samples were loaded in compression at a slower strain rate (10−6/sec.) to obtain more accurate data up to the predetermined stress level, held at constant stress for 2 hours, and immediately unloaded. All tests were conducted with the specimens soaked in a solution with proteinase inhibitors (100 mL N-ethylmaleimide, 100 mL benzamidine HCl, 4 mL 0.5M ethylenediaminetetraacetic acid, 10 mL phenylmethanesulfonylfluoride, 864.6 mL 1X phosphate buffered saline) at 37°C. The displacement as a function of time was recorded.
2.3 Micro-computed tomography (μCT)
The whole tibial slice and two samples (#9 and #17) were scanned before and after creep testing by a micro-computed tomography (μCT) scanner, Skyscan 1076 (Kontich, Belgium). Samples were wrapped in a tissue moistened with a phosphate buffer saline solution and placed in a sealed tube to prevent the specimen from drying out during scanning. Scanning was performed at 36 μm isotropic voxel sizes applying an electric potential of 70 kV and a current of 200 μA, using a 0.5 mm aluminum filter. Images and 3D rendered models were developed using Skyscan's DataViewer, CTAn, CTVox software and MIMICs software (Materialise Inc., Leuven, Belgium).
2.4 Image analysis
The opacity of the samples, amount of shadow, and surface lighting were adjusted so that the structure of the specimens was visible. Quantitative analysis of μCT images was performed by Skyscan's CTAn software. Thickness of individual trabecula (TbTh), trabecular separation (TbS), connectivity density (ConnD, which provides the information about connectedness of one trabecula to another), structure model index (SMI, which provides the information about relative shape of the trabeculae), degree of anisotropy (DA, quantification of relative anisotropy based on the geometry of trabecular structure), and total porosity were estimated for several representative samples before and after creep testing. Values for the above morphological parameters before and after testing were analyzed to acquire information about deformation mechanisms during creep loading.
Pre-load and post-load images from a selected sample were converted into 3D point clouds with MIMICs software, and aligned with a global registration algorithm (STL registration algorithm, MIMICs), which has been previously used to register both computed tomography [37] and magnetic resonance images [38]. 3D models, annotated to show the displacement of bone volume between pre-load and post-load, were created to visualize bone deformation.
3. Results and discussion
The sample deformation characteristics are shown in Fig. 4a. The green color corresponds to the samples for which a complete creep curve (primary and secondary stages) was obtained. The red samples failed prematurely during the initial creep loading. The blue samples underwent abnormally high deformation (~ 10 times that of the green samples), the possible reason for this could be different bone quality, due to osteoporosis, across the tibial cross-section. The density (bone tissue and marrow) from weight measurements of samples harvested from adjacent areas, since the trabecular structure can vary appreciably from region to region, was evaluated, and a density map (Fig. 4b) was constructed. The variation in density was found to be in a range of 0.71 g/cm3 to 0.95 g/cm3, with an average of 0.87 ± 0.08 g/cm3, which is in agreement with Carter and Hayes, [39]. These maps demonstrate the variability in properties and consequently mechanical performance across a single tibial cross-section. Fig. 4b also shows the creep stress that was applied to each sample. This information is extremely important in the area of orthopedic surgery, since it shows the complete picture of the mechanical properties for prospective implantation, and could predict the potential areas of failure.
Fig. 5 shows dependence of applied creep stress (σcreep) and initial elastic modulus (Eo) on the sample density. Only samples with complete creep curves (green samples, see Fig. 4a) were included in the analysis. Both, creep stress and initial elastic modulus, were generally found to be larger for the samples with higher density, with one exception for sample #11 (with the density = 0.92 g/cm3). Moreover, several samples with the same density, but from different locations across the knee (#2, # 13, and #17) showed different creep stress. These results clearly indicate that density of trabecular bone is not the only parameter that should be considered during the evaluation of its mechanical properties. Internal trabecular structure, including trabecular thickness, separation, geometry and connectivity as well as possible osteoporotic degradation should be taken into account.
Figure 5.

Dependence of creep stress (σcreep) and initial elastic secant modulus (Eo) on sample density.
As shown in Fig. 6, the prevailing orientation of trabeculae can be clearly observed from μCT image of the whole tibial slice. Trabeculae are mostly vertically aligned in the middle part of the slice, while they slightly curved to both medial and lateral sides. Fig. 7 shows 3D reconstructed μCT images of the faces of sample #9 (see Fig. 4a). Faces 1 and 2 before (Fig. 7a) and after (Fig. 7b) creep testing, and faces 3 and 4 before (Fig. 7c) and after (Fig. 7d) creep testing constructed by Skyscan's CTVox are shown (the faces were chosen in contrast to the internal areas of the samples due to better visual evidence of deformation). Bending (blue), fracture (green), and partial displacement of trabeculae (red) are seen on the images. The major deformation on after creep images is seen in the regions of high porosity or at the perimeter of cavities. These results establish that μCT can be employed to accurately document the location and infer the type of creep damage. These are the first images of this kind that show the architecture before and after creep testing, which allows the immediate visualization of potential damage and main deformation modes of trabecular bone after creep testing.
Figure 6.

Micro-computed tomography image of the whole tibial slice. Scale bar = 0.4 cm.
Figure 7.


3D micro-computed tomography images of faces of sample #9 (see Fig. 4a). Faces 1 and 2 before (a) and after (b) creep testing. Faces 3 and 4 before (c) and after (d) creep testing. Bending (blue), fracture (green), and partial displacement of trabeculae (red) are seen on the images. Scale bar = 1 mm.
As another example, Fig. 8 shows superimposed pre-load and post-load 3D models of sample #17, colorized to visualize bone deformation. To eliminate possible end effects, 0.25 mm was digitally removed from the top and bottom of the samples and not included in the analysis. The blue color represents the volume presented in the post-load image, but not in the pre-load image. The red color represents the volume presented in the pre-load set, but not in the post-load image. The white volume shows the intersection of both image sets. The results establish that registered and compared μCT images of pre- and post-load data sets can be used to visualize the deformation of bone tissue due to creep damage. Closer inspection of the model allows the visualization of localized damage and deformation modes that occur as a result of creep, consistent with results shown in Fig. 7.
Figure 8.

Micro-computed tomography reconstructed 3D model of a sample comparing the pre-and post-load volumes. Colorized as white: intersection between pre- and post-load images. Blue: volume in the post-load image, but not in the pre-load one. Red: volume in the pre-load image but not in the post-load one.
Fig. 9 shows representative creep curves for samples from different tibial areas. The creep strain (ε(t) − ε0) is plotted as a function of creep time (t − t0), where ε0 is the strain at the start (t0) of the application of the constant stress. The average creep rate, estimated as the slope of the steady state linear region was found to range between 0.15 με/sec to 0.38 με/sec with an average of 0.26 ± 0.09 με/sec. For analogous experiments on human vertebra of similar age, Kim et al. [7] reported creep rate equal to be 0.22 ± 0.03 με/sec., which correlate well with results from the current study, suggesting the creep mechanisms are similar. Because the vertebra consists of uniform rod/rod structures, while the tibia has a mixture of plate-like and rod-like structures, osteoporotic degradation of some tibia areas could be the reason for the larger uncertainties for the creep rate. Furthermore, similar creep rate was found for samples #1 and #2 (~0.15 με/sec.) and for samples #4 and #11 (~0.26 με/sec.). A possible explanation could be the similar internal trabecular structure, since #1 and #2 are from the perimeter of the tibial cross-section and #9 and #11 are from interior regions (see Fig. 4a). The lower creep rate from samples at the perimeter suggests that the quality of the bone was better and perhaps less affected by osteoporosis. Additionally, the creep rate has a strong dependence on the density. Samples #1 and #2 (lower creep rate) were found to have higher density (~0.95 g/cm3), while samples #4 and #11 (higher creep rate) had a lower density (~0.87 g/cm3). These results confirm that creep is highly dependent on the density in tibial knee bone. Bone adapts its structure according to Wolff's Law. However, based on the density measurements there are significant differences (25% difference between high and low values), which translate into variations in mechanical deformation.
Figure 9.

Creep curves for representative samples taken from a female proximal tibia, showing primary and secondary creep. Sample numbers are from Fig. 4a. The initial loading to the constant creep stress, start of creep curves, and the final creep strain are shown in the insert.
Fig. 10 summarizes the data on steady state creep rate and a final creep strain, calculated as the difference between the values of strain at the end of 2h and the strain at the start of the application of the constant stress (ε0), plotted against density. The data clearly show that the steady state creep rate was higher for the samples with a lower density. Accordingly, the final creep strains were found to be larger for those samples. The average final creep strain was found to be 3350 ± 1890 µε, which is in agreement with Kim et al. [7], who reported the final creep strain as 3877 ± 2158 με for human vertebra trabecular bone.
Figure 10.

Dependence of final creep strain after 2h, εf = ε2hr - ε0 and steady state creep rate on sample density.
Quantitative analysis of morphological parameters, TbTh, TbS, ConnD, SMI, DA, and total porosity, from μCT scans before (Fig. 7a,c) and after creep testing (Fig. 7b,d) was performed on two representative samples. To eliminate possible end effects, 0.25 mm was digitally removed from the top and bottom of the samples and not included in the analysis. Fig. 11 shows the change in percentage of these parameters before and after creep testing. As expected, the TbTh did not change much (~ 1%), proving that the thickness of individual trabeculae did not change during the creep progression. On the other hand, TbS shows ~3% reduction, indicating that during the creep progression the trabeculae were getting closer to each other due to bending. Another reason for TbS reduction is a possible compression of trabeculae in length during the creep test. Additionally, the total porosity and DA were found to be slightly lower after creep due to bending and partial displacements of trabeculae, while the ConnD was ~1% larger after creep, most likely due to bending of the trabeculae network (see Fig. 7b,d). Furthermore, the SMI decreased ~ 2.5%, indicating a decrease in the surface convex curvature. These data show that TbTh, ConnD, DA, and total porosity did not significantly change, while TbS and SMI can be used as markers for evaluation of creep deformation of trabecular bone. Moreover, it can be concluded that bending of the trabeculae was the prevalent deformation mode, in agreement with observations made by Nagaraja et al., [32] in the linear elastic region of bovine tibial trabecular bone. However, some fractures and small displacements of trabeculae were observed on the after test images (see Fig. 7b,d). This quantitative analysis was performed only for several representative samples from human tibia, thus the results are preliminary and future investigations are required to verify these initial data.
Figure 11.

Change in morphological parameters for samples before and after creep testing evaluated through μCT image analysis.
The normalized stress, σcreep/Eo, was calculated to be in a range 0.005 to 0.01, which correlates well with the test parameters from Bowman et al., [26]. Fig. 12 shows the dependence of steady state creep rate versus normalized stress for the present study along with published data on bovine proximal tibia [26], showing good agreement between data sets. Additionally, those data show a trend for the creep rate based on the local density, due to the correlation between ratios of creep rate and density of the samples:
| (3) |
According to this equation, corroborated with the experimental results, there is a tendency for the creep rate to increase with decreasing density, in accordance with Eqn. (2).
Figure 12.

Steady state creep rate versus normalized stress (σcreep/Eo) for the current study and published data (Bowman et al., [26]).
4. Conclusions
The compressive creep behavior of human trabecular bone from proximal tibia from a 71 year old female cadaver with osteoporosis was analyzed by compression testing for 2 hours and microcomputed tomography (before and after tests). The main findings are:
The density (with marrow) across the tibia ranged from 0.71 – 0.95 g/cm3;
The initial elastic modulus and stress at 1% strain increased with increasing density;
The steady state creep rates ranged between 0.15 με/sec. and 0.38 με/sec. with an average of 0.26 ± 0.09 με/sec.;
The creep rate was found to be larger in the internal regions (with a smaller density) of tibia compare to the perimeter regions (with a larger density);
The samples deformed an average of 3350 ± 1890 με during creep;
Micro-computed tomography can be employed to accurately document the location and type of creep damage;
Quantitative analysis of micro-computed tomography results indicate general trends for different parameters before and after creep testing; trabecular separation and structural index were found to be the markers for evaluating of creep deformation;
The main deformation mode was bending of the trabeculae.
Acknowledgements
We thank Professor Tony Keaveny (UC Berkeley) for his valuable insights and discussions, Dr. Shantanu Patil (Shiley Center for Orthopaedic Research & Education) and Matthew Wen (UCSD) for their assistance in sample preparation, and Steve Roberts (UCSD) for his help with the experimental set up. This research is funded by the National Science Foundation, Division of Materials Research, Ceramics Program (DMR 1006931) and UCSD General Campus Academic Senate Research Grant (2013).
References
- [1].National Hospital Discharge Survey (NHDS) U.S. Department of Health and Human Services, Centers for Disease Control and Prevention. National Center for Health Statistics; Hyattsville, MD: Mar, 2010. [Google Scholar]
- [2].Cram P, Lu X, Kates SL, Singh JA, Li Y, Wolf BR. Total knee arthroplasty volume, utilization, and outcomes among Medicare beneficiaries 1991–2010. JAMA. 2012;308:1227–1236. doi: 10.1001/2012.jama.11153. [DOI] [PMC free article] [PubMed] [Google Scholar]
- [3].Krummenzuer F, Wolf C, Gunther KP, Kirschner S. Clinical benefit and cost effectiveness of total knee arthroplasty in the older patient. Eur. J. Med. Res. 2009;14:76–84. doi: 10.1186/2047-783X-14-2-76. [DOI] [PMC free article] [PubMed] [Google Scholar]
- [4].Cheal EJ, Spector M, Hayes WC. Role of loads and prosthesis material properties on the mechanics of the proximal femur after total hip arthroplasty. J. Ortho. Res. 1992;10:405–422. doi: 10.1002/jor.1100100314. [DOI] [PubMed] [Google Scholar]
- [5].Fung YC. Biomechanics: Mechanical Properties of Living Tissues. Springer-Verlag; New York: 1981. [Google Scholar]
- [6].Lakes R. Viscoelastic properties of cortical bone. In: Cowin SC, editor. Bone Mechanics Handbook. CRC Press; Boca Raton: 2001. pp. 11–2. [Google Scholar]
- [7].Kim D-G, Shertok D, Tee BC, Yeni YN. Variability of tissue mineral density can determine physiological creep of human vertebral cancellous bone. J. Biomech. 2011;22:1660–1665. doi: 10.1016/j.jbiomech.2011.03.025. [DOI] [PMC free article] [PubMed] [Google Scholar]
- [8].Pollintine P, Luo J, Offa-Jones B, Dolan P, Adams MA. Bone creep can cause progressive vertebral deformity. Bone. 2009;45:466–472. doi: 10.1016/j.bone.2009.05.015. [DOI] [PubMed] [Google Scholar]
- [9].Zilch H, Rohlmann A, Bergmann G, Kolbel R. Material properties of femoral cancellous bone in axial loading. Part II: time dependent properties. Acta Orthop. Traumat. Surg. 1980;97:257–262. doi: 10.1007/BF00380706. [DOI] [PubMed] [Google Scholar]
- [10].Melnis AE, Knets IV, Moorlat PA. Deformation behavior of human compact bone tissue upon creep under tensile loading. Mekh. Komuozitnvkh Mater. 1979;5:861–867. [Google Scholar]
- [11].Schoenfeld CM, Lautenschlager EP, Meyer PR. Mechanical properties of human cancellous bone in the femoral head. Med. Biol. Eng. 1974;12:313–317. doi: 10.1007/BF02477797. [DOI] [PubMed] [Google Scholar]
- [12].Chen P-Y, McKittrick J. Compressive mechanical properties of demineralized and deproteinized cancellous bone. J. Mech. Behav. Biomed. Mater. 2011;4:961–973. doi: 10.1016/j.jmbbm.2011.02.006. [DOI] [PubMed] [Google Scholar]
- [13].Hamed E, Novitskaya E, Li J, Jasiuk I, McKittrick J. Experimentally-based multiscale model of the elastic modulus oftrabecular bone and its constituents. Acta Biomater. doi: 10.1016/j.msec.2015.02.044. submitted. [DOI] [PubMed] [Google Scholar]
- [14].Lakes RS. Viscoelastic Materials. Cambridge University Press; New York: 2009. [Google Scholar]
- [15].Sasaki N, Nakayama Y, Yoshimawa M, Enyo A. Stress relaxation function of bone and bone collagen. J. Biomech. 1993;26:1369–1376. doi: 10.1016/0021-9290(93)90088-v. [DOI] [PubMed] [Google Scholar]
- [16].Iyo T, Maki Y, Sasaki N, Nakata M. Anisotropic viscoelastic properties of cortical bone. J. Biomech. 2004;37:1433–1437. doi: 10.1016/j.jbiomech.2003.12.023. [DOI] [PubMed] [Google Scholar]
- [17].Ji B, Gao H. Mechanical properties of nanostructure of biological materials. J. Mech. Phys. Solids. 2004;52:1963–1990. [Google Scholar]
- [18].Hildebrand T, Laib A, Muller R, Dequeker J, Ruegsegger P. Direct three-dimensional morphometric analysis of human cancellous bone: microstructural data from spine, femur, iliac crest, and calcaneus. J. Bone Miner. Res. 1999;14:1167–1174. doi: 10.1359/jbmr.1999.14.7.1167. [DOI] [PubMed] [Google Scholar]
- [19].Morgan EF, Bayraytar HH, Keaveny TM. Trabecular bone modulus-density relationships depend on anatomic site. J. Biomech. 2003;36:897–904. doi: 10.1016/s0021-9290(03)00071-x. [DOI] [PubMed] [Google Scholar]
- [20].Mellish RWE, Fergusonpell MW, Cochran GVB, Lindsay R, Dempster DW. A new manual method for assessing 2-dimensional cancellous bone-structure - comparison between iliac crest and lumbar vertebra. J. Bone Miner. Res. 1991;6:689–696. doi: 10.1002/jbmr.5650060706. [DOI] [PubMed] [Google Scholar]
- [21].Dempster DW. The contribution of trabecular architecture to cancellous bone quality. J. Bone Mineral Res. 2000;15:20–23. doi: 10.1359/jbmr.2000.15.1.20. [DOI] [PubMed] [Google Scholar]
- [22].Ulrich D, van Rietbergen B, Laib A, R̈uegsegger P. The ability of three-dimensional structural indices to reflect mechanical aspects of trabecular bone. Bone. 1999;25:55–60. doi: 10.1016/s8756-3282(99)00098-8. [DOI] [PubMed] [Google Scholar]
- [23].Morita M, Ebihara A, Itoman M, Sasada T. Progression of osteoporosis in cancellous bone depending on trabecular structure. Ann. Biomed. Eng. 2004;22:532–539. doi: 10.1007/BF02367089. [DOI] [PubMed] [Google Scholar]
- [24].Ciarelli MJ, Goldstein SA, Kuhn JL, Cody DD, Brown MB. Evaluation of orthogonal mechanical properties and density of human trabecular bone from the major metaphyseal regions with materials testing and computed tomography. J. Orthop. Res. 1991;9:674–682. doi: 10.1002/jor.1100090507. [DOI] [PubMed] [Google Scholar]
- [25].Goulet RW, Goldstein SA, Ciarelli MJ, Kuhn JL, Brown MB, Feldkamp LA. The relationship between the structural and orthogonal compressive properties of trabecular bone. J. Biomech. 1994;27:375–389. doi: 10.1016/0021-9290(94)90014-0. [DOI] [PubMed] [Google Scholar]
- [26].Bowman SM, Keaveny TM, Gibson LJ, Hayes WC, McMahon TA. Compressive creep behavior of bovine trabecular bone. J. Biomech. 1994;27:301–310. doi: 10.1016/0021-9290(94)90006-x. [DOI] [PubMed] [Google Scholar]
- [27].Luo J, Pollintine P, Gomm E, Dolan P, Adams MA. Vertebral deformity arising from an accelerated “creep” mechanism. Eur. Spine J. 2012;21:1684–1691. doi: 10.1007/s00586-012-2279-y. [DOI] [PMC free article] [PubMed] [Google Scholar]
- [28].Yamamoto E, Crawford RP, Chan EE, Keaveny TM. Development of residual strains in human vertebral trabecular bone after prolonged static and cyclic loading at low load levels. J. Biomech. 2006;39:1812–1818. doi: 10.1016/j.jbiomech.2005.05.017. [DOI] [PubMed] [Google Scholar]
- [29].Patel V, Issever AS, Burghardt A, Laib A, Ries M, Majumdar S. MicroCT evaluation of normal and osteoarthritic bone structure in human knee specimens. J. Orthop. Res. 2003;21:6–13. doi: 10.1016/S0736-0266(02)00093-1. [DOI] [PubMed] [Google Scholar]
- [30].Pothuaud L, Van Rietbergen B, Mosekilde L, Beuf O, Levitz P, Benhamou CL, Majumdar S. Combination of topological parameters and bone volume fraction better predicts the mechanical properties of trabecular bone. J. Biomech. 2002;35:1091–1099. doi: 10.1016/s0021-9290(02)00060-x. [DOI] [PubMed] [Google Scholar]
- [31].Judex S, Boyd S, Qin Y-X, Miller L, Müller R, Rubin C. Combining high-resolution microcomputed tomography with material composition to define the quality of bone tissue. Curr. Osteopor. Res. 2003;1:11–19. doi: 10.1007/s11914-003-0003-x. [DOI] [PubMed] [Google Scholar]
- [32].Nagaraja S, Couse TL, Guldberg RE. Trabecular bone microdamage and microstructural stresses under uniaxial compression. J. Biomech. 2005;38:707–716. doi: 10.1016/j.jbiomech.2004.05.013. [DOI] [PubMed] [Google Scholar]
- [33].Mittra E, Rubin C, Gruber B, Qin Y-X. Evaluation of trabecular mechanical and microstructural properties in human calcaneal bone of advanced age using mechanical testing, microCT, and DXA. J. Biomech. 2008;41:368–375. doi: 10.1016/j.jbiomech.2007.09.003. [DOI] [PubMed] [Google Scholar]
- [34].Keaveny TM, Guo XE, Wachtel EF, McMahon TA, Hays WC. Trabecular bone exhibits fully linear elastic behavior and yields at low strains. J. Biomech. 1994;27:1127–1136. doi: 10.1016/0021-9290(94)90053-1. [DOI] [PubMed] [Google Scholar]
- [35].Keaveny TM. Mechanistic approaches to analysis of trabecular bone. Forma. 1997;12:267–275. [Google Scholar]
- [36].Carter DR, Hayes WC. The compressive behavior of bone as s two-phase porous structure. J. Bone Joint Surg. 1977;59-A:954–962. [PubMed] [Google Scholar]
- [37].Chan EF, Liu I, Semler EJ, Aberman HM, Simon TM, Chen AC, Truncale KG, Sah RL. Association of 3-dimensional cartilage and bone structure with articular cartilage properties in and adjacent to autologous osteochondral grafts after 6 and 12 months in a goat model. Cartilage. 2012;3:255–266. doi: 10.1177/1947603511435272. [DOI] [PMC free article] [PubMed] [Google Scholar]
- [38].Chen M, Mogul DJ. A structurally detailed finite element human head model for simulation of transcranial magnetic stimulation. J. Neurosci. Methods. 2009;179:111–120. doi: 10.1016/j.jneumeth.2009.01.010. [DOI] [PubMed] [Google Scholar]
- [39].Carter DR, Hayes WC. Bone compressive strength: the influence of density and strain rate. Science. 1976;194:1174–1176. doi: 10.1126/science.996549. [DOI] [PubMed] [Google Scholar]