

Abstract
The hip joint is one of the most frequent sites of osteoarthritis. Advances in diagnosis and clinical treatment have progressed dramatically in the last few decades; however, there are limitations associated with the lack of reliable measures for quantifying hip joint morphology. Current diagnostic measures of the hip are performed with pre-determined measures, typically lengths and angles, on 2D radiographic planes. The current measurement techniques do not utilize the inherent 3D nature of CT and MR imaging and do not necessarily quantify the relevant clinical pathologies. A valid and reliable measurement modality that measures the surface geometry of the femoral head is necessary for early diagnosis and treatment of hip disease. The purpose of this study was to establish a method to quantify femoral head morphology using a three-dimensional model. A novel measurement approach was applied to 45 cadaveric femurs (23 right; 22 left; nine female, 17 male) and their digitally reconstructed 3D CT models. The mean difference between the cadaveric and digital measures was −2.04 mm with 95% confidence limits (CI) of 13.67 mm and −17.75 mm, respectively. The digital measurement approach was found to have excellent intraobserver reliability (ICC = 0.99, CI 0.98–0.99) and interobserver reliability (ICC = 0.98, CI 0.93–0.99). This valid and reliable novel digital measurement approach enables quantification of the 3D surface geometry of the femoral head and is able to measure individual variations and potentially detect abnormalities. This method may be used to assist future studies to establish valid diagnostic measurements for femoral head and head–neck junction pathologies.
Keywords: cadaveric, hip joint, Mimics, morphology, morphometrics, reliability, three-dimensional, validity
Introduction
Osteoarthritis (OA) of the hip joint is a multifactorial disease that affects a large number of aging individuals and is associated with significant disability (Felson et al. 2000; Chegini et al. 2009). Morphological variations of the proximal femur and the acetabulum have been identified as potential factors contributing to OA (Bullough et al. 1973; Reikeras & Hoiseth, 1982; Reikeras et al. 1983; Harris-Hayes & Royer, 2011; Bonneau et al. 2012a). Altered geometry of the proximal femur, the acetabulum, or both, is thought to create abnormal loading patterns in the hip joint resulting in OA disease progression (Reikeras & Hoiseth, 1982; Reikeras et al. 1983; Gregory et al. 2007; Harris-Hayes & Royer, 2011; Bonneau et al. 2012a). However, it is not known where these morphological changes occur along the spectrum of the disease process (Reikeras & Hoiseth, 1982; Reikeras et al. 1983; Gregory et al. 2007) and specifically whether they precede disease onset. The most common locations for variations in bone geometry of the hip joint are the acetabular rim and the femoral head and neck (Bullough et al. 1973; Gregory et al. 2007).
Hip instability and femoroacetabular impingement (FAI) are two of the conditions that define morphological variations of the hip joint (Clohisy et al. 2009; Lynch et al. 2009). Acetabular dysplasia (AD) is the primary cause of atraumatic hip instability and is characterized by insufficient anterolateral femoral head coverage by the acetabulum and superolateral inclination of the acetabular surface (Wiberg, 1939; Boykin et al. 2011). AD is assessed radiographically by the centre-edge (CE) (Wiberg, 1939) angle and the vertical-centre-anterior (VCA) angle (Lequesne & De, 1961; Delaunay et al. 1997). FAI is characterized by abnormal contact between the anterosuperior-lateral femoral neck and the anterosuperior acetabular rim. One specific type of FAI is cam impingement. Cam impingement is characterized by a decreased head–neck offset of the anterosuperior or anterolateral portion of the femoral head–neck junction (Ganz et al. 2003; Lavigne et al. 2004; Beck et al. 2005; Gosvig et al. 2008). During hip flexion this cam-lesion rotates into the acetabulum and applies compressive and shear forces to the anterosuperior acetabulum, limiting range of motion (ROM) and resulting in labrum and articular cartilage damage (Ganz et al. 2003; Beck et al. 2005; Jaberi & Parvizi, 2007). Currently, cam impingement is identified using the head–neck offset ratio (Eijer et al. 2001) and the alpha angle (Notzli et al. 2002).
Although detecting and providing early treatment to patients with hip instability and FAI may slow the progression of OA, patients with symptomatic hip disease often experience a delay in diagnosis, inaccurate diagnoses, and inappropriate or ineffective treatments due to having apparently ‘normal’ anteroposterior radiographs (Notzli et al. 2002; Ganz et al. 2003; Lavigne et al. 2004; Clohisy et al. 2005; James et al. 2006; Kassarjian et al. 2007). Conversely, patients who are suspected of having FAI are often overdiagnosed and overtreated due to invalid diagnostic measurements (Sutter et al. 2012). Often, the inability accurately to diagnose early hip disease stems from limitations associated with the current two-dimensional (2D) radiographic parameters used to detect these morphological variations. For instance, Clohisy et al. (2009) evaluated the reliability of six hip specialists identifying important radiographic features of the hip on plain radiographs. The diagnostic measures for AD, CE angle and VCA angle, and the diagnostic measures for cam-FAI, head–neck offset ratio and alpha angle, were included in these radiographic features of the hip. They found that these standard radiographic parameters used to diagnose these bony variations are not reproducible (Clohisy et al. 2009). The same group conducted another study investigating the reliability of radiographic measurements of the hip by various physicians who are musculoskeletal specialists. Similarly, they found that the measurements were not reliable among observers and were limited in their ability to determine a constant radiographic diagnosis (Carlisle et al. 2011). Sutter et al. (2012) investigated the usefulness of the alpha-angle for discriminating between patients with cam-FAI and asymptomatic volunteers. They found that the alpha angle did not discriminate accurately between cam-FAI patients and asymptomatic volunteers (Sutter et al. 2012). These diagnostic measurements lack reproducibility due to inherent measurement limitations relating to defining hip geometry through the use of pre-determined measures, typically lengths and angles, from 2D radiographic planes. Projecting three-dimensional (3D) geometry onto 2D planes cannot accurately account for the entire joint morphology, and quantifying the morphology with linear measures on a 2D scan may not assess the relevant pathologies (Beaule et al. 2005; Waarsing et al. 2010). Furthermore, an isolated 2D slice chosen to quantify the 3D morphology may not be the ideal slice to visualize all relevant structures. Methods used to select the slice, such as external landmarks or subjective visual determination, may change with differences in positioning of the femur during imaging and with different observers, thus decreasing measurement reproducibility (Bonneau et al. 2012b). In addition, given the large articular surface area, 2D methods may result in visual apposition, or overlap, of the femur and acetabulum and fail to detect variations in osseous morphology that may be hidden (Audenaert et al. 2011). To accurately detect structural hip disease, a reliable set of radiographic parameters and methods are essential (Clohisy et al. 2009).
The literature indicates that measurement modalities of the hip joint are implemented and used to diagnose pathologies without first being validated or tested for reliability. Unfortunately, this has led to clinical practice relying on potentially invalid and unreliable hip metrics to plan patient interventions. In addition, these measurements rely on 2D linear measures to assess 3D geometry. The purpose of this study was to establish and test the validity and reliability of a 3D measurement approach that defines femoral head morphology. The measurement approach utilized here will quantify the 3D surface morphology of the femoral head, which would then allow better detection of all femoral head and head–neck junction pathologies, thus eliminating the errors involved with measuring in 2D planes. Measurements are taken every 30° around the sphere from the centre of the fovea to the point at which the convexity of the femoral head meets the concavity of the femoral neck. This measurement approach was selected such that measurement would be inclusive of any and all bony lesions present at the head–neck junction. The approach was applied to both cadaveric specimens and 3D digital models created from CT scans of the same specimens. It is hypothesized that the mean difference between the digital measures and the measures taken on the cadaveric specimens will be minimal. Additionally, it is hypothesized that there will be strong reliability between observers and trials.
Materials and methods
Forty-seven cadaveric femurs were obtained with permission from the Western University Body Bequeathal program. Two specimens were excluded from the study, one due to the presence of a metal prosthesis and the other because it was not possible to manually separate the femur from the pelvis due to severe degenerative disease. The 45 specimens included in the study (23 right, 22 left; and eight female, 37 male) had an average age of 77.6 ± 11.5 years (age range 51–104 years) and consisted of 19 bilateral and seven unilateral femurs. As this is primarily an evaluation of the method, bilateral femurs were included in the study and each individual femur was considered as a separate specimen.
All specimens underwent CT scanning in a GE Lightspeed VCT (GE Healthcare, WI, USA) at University Hospital, London, Ontario. The scans had a slice thickness of 0.6 mm and a matrix of 512 × 512. After scanning, the cadaveric specimens were manually dissected, stripping them of all soft tissue with the exception of articular (hyaline) cartilage.
Cadaveric measurements
In preparation for measurement, a 1.5-cm circular template consisting of 12 radiating lines, each separated by 30°, was created for each specimen (Fig. 1b). The flexible angle template was applied to the centre of the fovea and screwed into the bone for stability. Femoral mid-shaft was established while in a medial view of the fovea by measuring the diameter of the shaft 2 cm inferior to the lesser trochanter. A reference line drawn from the mid-shaft point to the fovea established the 0° angle (Fig. 1a). Linear surface measurements were performed using suture string along the surface of the femoral head from the centre of the fovea to the point where the convexity of the femoral head meets with the concavity of the femoral neck. The length of the string at each of the 12 angles, representing femoral surface dimension, was then measured with a ruler (Fig. 1b).
Figure 1.

Measurement of the femoral cadaveric specimens. (a) Establishment of the 0° angle marker. (b) Linear surface measurement of the femoral head from the centre of the fovea marker to the point where the convexity of the femoral head meets the concavity of the femoral neck using suture string. (c) Projected lines representing the 12 angle markers radiating from the centre of the fovea every 30°.
Digital measurements
The CT, digital imaging and communications in medicine (DICOM) files for all specimens were imported into the computer software mimics 14.11 (Materialise, Leuven, Belgium). Standardized image thresholding was performed to separate the bone contrast from the surrounding soft tissue contrast levels (Hounsfield threshold values: minimum – 226; maximum – 2606). Manual segmentation was performed on each file to create a digital model, which separated the femur from the pelvis. During the formation of the 3D mesh there is often a discontinuous bony surface. To measure the surface of the 3D model accurately, the digital surface mesh must be continuous and devoid of any holes; thus, each model went through a cavity-fill process. The tool used to record the digital measurements, the measure distance over surface tool, directly adheres to the model's mesh surface; thus, if there is a discontinuous surface, the measurements would be inaccurate. The cavity-fill process ensures a continuous surface; however, it does not ‘smooth’ the surface of the model or adversely affect the calculation of the surface.
To create a virtual angle template that is identical to the cadaveric angle template, a virtual 2D circle, with a 1.5-cm diameter, was applied to centre of the fovea. A 3D marker was placed on the surface of the model in the centre of the 2D circle to indicate the centre of the fovea. As with the cadaveric approach, the location of the femoral mid-shaft was established by measuring the diameter of the shaft 2 cm inferior to the lesser trochanter, while in a medial view of the fovea. A reference line extending from the femoral mid-shaft point to the fovea established the 0° angle; a 3D marker was applied to indicate the 0° angle (Fig. 2a). A 2D plane was created at the level of the fovea, which included both the centre of the fovea marker and the 0° angle marker. The remaining 11 angles were designated, using the measure angle tool, every 30° from the 0° line. 3D markers were placed to indicate each angle (Fig. 2b). Measurements were made on the 3D model using the measure distance over surface tool, from the centre of the fovea marker to the point where the convexity of the femoral head meets the concavity of the femoral neck at each of the 12 angles (Fig. 2c).
Figure 2.

Measurement of the femoral digital models. (a) Establishment of the centre of the fovea and the 0° angle marker. (b) Creation of the angle template on a 2D plane. (c) Measurement of the femoral head from the centre of the fovea marker to the point where the convexity of the femoral head meets with the concavity of the femoral neck. Measurements are taken at each of the 12 angle markers.
Statistical analysis
To assess the validity of the measurement approach, one anatomist (C.M.) performed all of the cadaveric and digital measurements. To assess intraobserver reliability, the main observer (C.M.) repeated the measurements, in a randomized order, on the entire dataset (n = 45), with a minimum of 48 h separating measurement trials. To assess interobserver reliability, a subset (n = 18) of specimens was randomly selected. Two independent blinded anatomists (C.M. and J.T.) performed all measurements on this subset in random order. The observers were not provided with any feedback while measuring and were blinded to their previous measurements and those of the other observer.
Statistical analysis was performed using spss 16 (SPSS Inc., Chicago, IL, USA) and prism 5 (GraphPad Software, Inc., La Jolla, CA). The mean difference between the methods was assessed by the Bland–Altman method. Interobserver and intraobserver reproducibility were assessed by the intra-class correlation coefficient (ICC) and the Bland–Altman method.
Results
Reliability of femoral head surface measurements
High intraobserver reliability (n = 45) was observed between the first and second cadaveric measurements with an intraclass correlation coefficient (ICC) of 0.99 [95% confidence interval (CI) 0.91–1.0]. Figure 3a displays the mean cadaveric measurements at each degree point for the first and second measures taken by observer 1 (C.M.) on a polar graph. The points on the polar graph correspond to the points measured on the femoral head (Fig. 1c). The Bland–Altman plot (Fig. 4a) illustrates the difference between the mean cadaveric measurements at each measurement point for the first and second measures. The mean difference between the two measurements was 0.94 ± 5.16 mm and the upper and lower 95%CIs were 11.05 and −9.17 mm, respectively. This represents a mean error of 1.7%. The intraobserver reliability for the first and second digital measurements (n = 45) was also observed to be high, with an intraclass correlation coefficient of 0.99 (95%CI 0.98–0.99). The polar graph (Fig. 3b) displays the mean digital measurements for the first and second measures taken by observer 1 (C.M.). The points on the polar diagram correspond to the points measured on the femoral head (Fig. 1c). The Bland–Altman plot in Fig. 4b illustrates the difference between the first and second measures at each measurement point. The mean difference between the two measurements was −0.72 ± 5.30 mm, and the upper and lower 95%CIs were 9.66 and −11.11 mm, respectively, representing a mean error of 1.3%.
Figure 3.

Polar graphs of intraobserver reliability measurements of femoral head surface. The 12 axes represent the 12° points where the measurements were taken (n = 45). The mean measurement (mm ± SD) for each degree point is plotted for the first and second measures recorded by observer 1. (a) Mean cadaveric first and second measurements. (b) Mean digital first and second measurements.
Figure 4.

Bland–Altman plot of intraobserver variability (n = 45) of the (a) femoral cadaveric measures (bias = 0.94 ± 5.16 mm) and (b) femoral digital measures (bias = −0.72 ± 5.30 mm). The x-axis plots the mean measurement between observations, recorded by observer 1, against the difference between the measures (mm) on the y-axis (first measure − second measure).
A high agreement was observed between observers (n = 18) when measuring the cadaveric specimens (ICC = 0.99, 95%CI 0.99–0.99) and when measuring the digital model measurements (ICC of 0.98, 95%CI 0.93–0.99). Polar graphs display the mean measures for each observer for cadaveric measures (Fig. 5a) and digital measures (Fig. 5b). The points on the polar diagram correspond to the points measured on the femoral head (Fig. 1c). The Bland–Altman plots illustrate the difference between the mean measures at each measurement point for the cadaveric measures (Fig. 6a) and digital measures (Fig. 6b). The mean difference between the two observers’ cadaveric measurements was −2.60 ± 5.33 mm and the upper and lower 95%CIs were 7.84 and −13.05 mm, respectively (mean error = 4.5%). For the digital measures, the mean difference between the two measurements was 1.82 ± 9.47 mm and the upper and lower 95%CIs were 16.74 and −20.39 mm, respectively (mean error = 3.0%).
Figure 5.

Polar graphs of interobserver reliability measurements of the femoral head (n = 18). The 12 axes represent the 12° points where the measurements were taken and the mean measurement (mm ± SD) for each degree point is plotted for both observers. (a) Cadaveric measures for observer 1 (C.M.) and observer 2 (J.T.). (b) Digital measures for observer 1 (C.M.) and observer 2 (J.T.).
Figure 6.
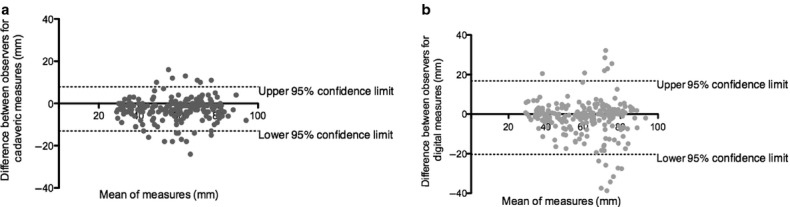
Bland–Altman Plot of interobserver variability (n = 18) of the (a) femoral cadaveric measures (bias = −2.60 ± 5.33 mm) and (b) femoral digital measures (bias = 1.82 ± 9.47 mm). The x-axis plots the mean measurement between observations against the difference between the measures (mm) on the y-axis [first observer (C.M.) − second observer (J.T.)].
Validity of femoral head surface measurements
The mean difference between the cadaveric and digital measures was −2.04 ± 8.00 mm. The upper and lower 95%CIs were 13.67 and −17.75 mm, respectively, representing a mean error of 3.7%. The polar graph (Fig. 7) displays mean femoral head measurements for both cadaveric and digital modalities at each of the 12 angle markers. The degree points on the polar graph correspond to the angle markers measured on the femoral head (Fig. 1c). This graph illustrates that the largest femoral head surfaces were found between 150° and 240°, corresponding to the anterosuperior-lateral femoral head surfaces. The smallest surface measurements were found between 330° and 30°, corresponding to the inferomedial surface of the femoral head. The Bland–Altman plot (Fig. 8) illustrates the difference between the mean cadaveric measures and the mean digital measures at each measurement point.
Figure 7.

Polar graph of mean femoral cadaveric and digital measurements (mm ± SD) (n = 45). The 12 axes represent the degree (°) points (see Fig. 1c) identifying measurement position. Mean measurements for each degree point are plotted for the cadaveric and digital measures.
Figure 8.

Bland–Altman plot of the difference between the femoral cadaveric measurements and the femoral digital measurements (n = 45; bias = −2.04 ± 8.00 mm). The x-axis plots the mean of two measurements against the difference between the measurement modalities (cadaveric − digital) on the y-axis.
Discussion
The limited reliability of current radiographic approaches used to diagnose hip instability and FAI necessitates an alternative measurement methodology for early detection of hip disease (Clohisy et al. 2009). Current hip measurement modalities define the geometry using pre-determined 2D linear measures on 2D slices. This type of measurement fails to quantify the 3D surface morphology of the femoral head and may not assess relevant clinical deviations (Waarsing et al. 2010). Thus, utilizing a technique such as the one described in the current study, more accurately and reliably accounts for the 3D surface morphology of the femoral head and may assist in early detection and treatment of hip disease.
The digital measurement approach presented was found to be reliable and valid when compared with the cadaveric measurements. The mean difference between the cadaveric and digital measurements was −2.04 mm and the digital measurement approach had excellent intraobserver reliability (ICC = 0.99, CI 0.98–0.99) and interobserver reliability (ICC = 0.98, CI 0.93–0.99). Originally, it was thought that the presence of hyaline cartilage on the cadaveric specimens, and the inability to visualize hyaline cartilage on the digital models due to the limitation of CT imaging of cartilage, would create a discrepancy in the measurements. However, in general the digital measurements tended to be slightly larger than the cadaveric measurements at most degree points, thus including hyaline cartilage in the cadaveric measurements produced minimal and unlikely clinically relevant error. The larger digital measurements may be due to an increased accuracy when using the digital measurement approach. The digital model surfaces were attained using the measure distance over surface tool, which detects minute changes in the surface morphology of the 3D model, whereas the cadaveric specimens were measured along the surface with string. The string would not account for the small indentations on the femoral head surface that would have been detected using the digital approach. Hence, it may be reasonable to suggest that the digital measure may be more accurate. A systematic difference in the observer's digital vs. cadaveric measurement approach may be another potential explanation for the tendency of digital surface measures to be slightly greater than the cadaveric surface measures.
The digital measurement approach affords visualization and measurement of the 3D articular surface of the femoral head. Typically, the largest articular surface is located anterosuperior-laterally, whereas the smallest surface is located inferolaterally (Standring, 2008; Sutter et al. 2012). The current study's measurements were consistent with normal femoral head geometry. The largest femoral head surfaces corresponded to the anterosuperior-lateral aspect of the femoral head, found between 150° and 240°, and the smallest femoral head surface measurements corresponded to the inferolateral aspect of the femoral head, found from 330° to 30°. Additionally, the anterosuperior-lateral aspect of the femoral head is the common location for cam-FAI bony abnormalities. Cam-FAI is characterized by a ‘bump’ or ‘lesion’ that decreases the head–neck offset at the anterosuperior-lateral portion of the femoral head–neck junction (Ganz et al. 2003; Lavigne et al. 2004; Beck et al. 2005; Gosvig et al. 2008). The alpha angle is considered to be the simplest and quickest method for measuring the femoral head–neck offset (Notzli et al. 2002; Kassarjian et al. 2007). The alpha angle is measured on centre-cut axial oblique view MR images and is defined as the angle between a line drawn through the centre of the long axis of the femoral neck and head, and a line drawn from the centre of the femoral head to the first point where the contour of the femoral head exceeds the radius of the head (Notzli et al. 2002). A consensus as to which alpha angle value is diagnostic of a hip with impingement does not exist in the literature and many different values are used within the literature (Notzli et al. 2002; Gosvig et al. 2007; Kassarjian et al. 2007; Sutter et al. 2012). More recently, the alpha-angle was measured on multiple radial planes through the proximal femur to assess the whole circumference (Pfirrmann et al. 2006; Sutter et al. 2012). In the more recent study, the discrimination of the alpha angle at multiple radial planes was assessed among patients with cam-FAI and asymptomatic controls (Sutter et al. 2012). Although they report that the discrimination was optimal when measured at the anterosuperior position, the position most commonly associated with cam-lesions, the alpha angle did not accurately discriminate between cam-FAI patients and controls (Sutter et al. 2012). The 3D nature of the measurement approach presented in the current study may allow quantification of the bony lesions that may be missed on 2D images. A similar study to assess the ability of this measurement approach to discriminate between cam-FAI patients and asymptomatic controls would be of value. A set of normal values and a set of values indicative of cam-lesions need to be established for this measurement approach. Furthermore, reliability is increased in the 3D approach, as the operator no longer physically selects the centre-cut axial oblique view, or the radial plane images, but utilizes the entire surface geometry of the femoral head. Due to the specimens being obtained from older individuals for this study it is possible that structural hip pathologies, including cam-lesions, may have been present. On some specimens, bony proliferations were easily visualized on both the cadaveric specimens and the digital models; these bony proliferations were included in the measurements via longer lengths measured at the anterosuperior-lateral aspect of the femoral head, illustrating that the digital measurement approach is robust, valid and reliable, regardless of variation in femoral head anatomy. Measurements of hips with suspected cam lesions compared with normal hips is the next logical step in this line of research; however, this was beyond the scope of this study. This study was designed to establish that measurements on the 3D model were equivalent to the measurements on the actual bony specimens and that the measurement approach was sensitive enough to detect differences among specimens.
The segmentation protocol used to create the 3D models may be a source of small errors due to partial-volume effects where bone meets soft tissue. Partial-volume effects occur when multiple tissue types contribute to the digital composition of a single voxel (a 3D pixel). The voxel is expressed as an average of the attenuation properties of all contributing tissues, resulting in blurred tissue boundaries (Pham et al. 2000). However, the potential for partial volume errors was minimized with thin CT slice thicknesses, 0.6 mm, as it is less likely multiple structures will occupy the same voxel. When creating the 3D models a cavity-fill process was performed to ensure a continuous surface. The cavity-fill process was done manually to ensure that deviations in the model surface were filled, yet no excess bone was added to the surface. Although the cavity-fill was performed carefully and manually, this process may have been a source of error in the digital measurements. The placement of the measurement template may also prove to be a challenge when performing these measurements. The angle template was applied to the centre of the fovea; however, a slight change in location of the template may alter the measurement results. Thus, if the placement of the template was different on a cadaveric specimen than it was on a digital model, this may have resulted in a difference between measurements. However, due to the high agreement between the cadaveric and digital measurements one would expect that the placement location of the template produced minimal error. Furthermore, the 0° marker was established by drawing a line from the centre of the fovea along the femoral mid-shaft. Due to varying degrees of anteversion, the 0° angle may not have been homologous among femora. It is known that females have a higher degree of femoral anteversion than males (Nakahara et al. 2011; Bonneau et al. 2012b); thus, in future studies when establishing normal and pathological criteria values to determine the effect of anteversion on the measurements, male and female measurements could be considered separately. Additionally, the current measurement modality does not control for femoral size, to compare accurately normal and pathological measurements the data collected would require normalization to remove the size effect. Ideally, the Bland–Altman method of analysis should be calculated on a large sample size, preferably > 50, and thus the sample of 45 in this study may have produced slightly wider 95% confidence limits (Rankin & Stokes, 1998). Additionally, another limitation to the digital measurement approach was the time required to build a 3D model and conduct the measurements. If such a measurement approach were to be introduced into clinical practice the creation of the model and the measurement approach would need to be automated for efficiency. This is certainly possibly and practical.
This new approach could be used to establish a set of normal and pathological measures. These values could then be used to determine precise normal and pathological parameters used to identify early structural hip disease. Creating pathological criteria values using a valid and reliable measurement modality may lead to early diagnoses and treatment of structural hip disease, which may lead to a decrease in morbidity associated with OA (Notzli et al. 2002; Ganz et al. 2003; Lavigne et al. 2004; James et al. 2006; Kassarjian et al. 2007). Once values for pathological criteria have been established, the measurement approach could be automated and widely available for use on imaging visualization stations. The novel digital measurement approach could also be applied to the acetabulum to assess similar morphometrics. Structural hip disease affects both the proximal femur and the acetabulum. It is important to examine the 3D morphology disarticulated for the presence of structural lesions that may be hidden when articulated (Audenaert et al. 2011); however, it would also be beneficial to assess the femoral structural lesions in relation to the acetabular structural lesions.
Conclusion
In conclusion, the current measurement approach is a valid and reliable method to measure discrete characteristics of the femoral head. This novel approach to digital measurement quantifies the 3D surface geometry of the femoral head and is able to measure individual variations and potentially detect abnormalities. The impetus to develop this measurement approach resulted from the limitations associated with the current 2D diagnostic measures. With novel approaches such as those described here, greater use of 3D imaging can be made to measure 3D femoral head geometry.
Acknowledgments
The authors wish to thank the Western University Body Bequeathal Program for the use of the cadaveric specimens; Dr C. Dunning for the use of her computer lab; K. Agarwal and G. Naboka for their assistance in preparing the cadaveric specimens; E. Bussin, T. Maciel, and M. Midgley for their assistance during data collection; Dr J. Dickey, Associate Professor, School of Kinesiology, Dr C. Romagnoli, Radiologist, LHSC-UH Division of Diagnostic Radiology, and Dr C. Lee, Associate Professor, School of Health Studies for all your guidance and support.
Author contributions
Charys M. Martin was responsible for the conception of the study idea and design. She created the measurement approach, acquired all data, analysed all data, and drafted/revised the manuscript. James G. Turgeon was involved in the acquisition of data as well as critical review of the manuscript. Charles L. Rice contributed to the study design and concept and was involved in critical review of the manuscript. Aashish Goela contributed to the study design and concept and was involved in critical review of the manuscript. Timothy D. Wilson was involved in the conception of the study idea and design and was involved in critical review of the manuscript.
References
- Audenaert E, Vigneron L, Pattyn C. A method for three-dimensional evaluation and computer aided treatment of femoroacetabular impingement. Comput Aided Surg. 2011;16:143–148. doi: 10.3109/10929088.2011.557856. [DOI] [PubMed] [Google Scholar]
- Beaule PE, Zaragoza E, Motamedi K, et al. Three-dimensional computed tomography of the hip in the assessment of femoroacetabular impingement. J Orthop Res. 2005;23:1286–1292. doi: 10.1016/j.orthres.2005.03.011.1100230608. [DOI] [PubMed] [Google Scholar]
- Beck M, Kalhor M, Leunig M, et al. Hip morphology influences the pattern of damage to the acetabular cartilage: femoroacetabular impingement as a cause of early osteoarthritis of the hip. J Bone Joint Surg Br. 2005;87:1012–1018. doi: 10.1302/0301-620X.87B7.15203. [DOI] [PubMed] [Google Scholar]
- Bonneau N, Bouhallier J, Baylac M, et al. Study of the three-dimensional orientation of the labrum: its relations with the osseous acetabular rim. J Anat. 2012a;220:504–513. doi: 10.1111/j.1469-7580.2012.01486.x. [DOI] [PMC free article] [PubMed] [Google Scholar]
- Bonneau N, Libourel P-A, Simonis C, et al. A three-dimensional axis for the study of femoral neck orientation. J Anat. 2012b;221:1–12. doi: 10.1111/j.1469-7580.2012.01565.x. [DOI] [PMC free article] [PubMed] [Google Scholar]
- Boykin RE, Anz AW, Bushnell BD, et al. Hip instability. J Am Acad Orthop Surg. 2011;19:340–349. doi: 10.5435/00124635-201106000-00004. [DOI] [PubMed] [Google Scholar]
- Bullough P, Goodfellow J, O'Conner J. The relationship between degenerative changes and load-bearing in the human hip. J Bone Joint Surg Br. 1973;55:746–758. [PubMed] [Google Scholar]
- Carlisle JC, Zebala LP, Shia DS, et al. Reliability of various observers in determining common radiographic parameters of adult hip structural anatomy. Iowa Orthop J. 2011;31:52–58. [PMC free article] [PubMed] [Google Scholar]
- Chegini S, Beck M, Ferguson SJ. The effects of impingement and dysplasia on stress distributions in the hip joint during sitting and walking: a finite element analysis. J Orthop Res. 2009;27:195–201. doi: 10.1002/jor.20747. [DOI] [PubMed] [Google Scholar]
- Clohisy JC, Keeney JA, Schoenecker PL. Preliminary assessment and treatment guidelines for hip disorders in young adults. Clin Orthop Relat Res. 2005;441:168–179. doi: 10.1097/01.blo.0000193511.91643.2a. [DOI] [PubMed] [Google Scholar]
- Clohisy JC, Carlisle JC, Trousdale R, et al. Radiographic evaluation of the hip has limited reliability. Clin Orthop Relat Res. 2009;467:666–675. doi: 10.1007/s11999-008-0626-4. [DOI] [PMC free article] [PubMed] [Google Scholar]
- Delaunay S, Dussault RG, Kaplan PA, et al. Radiographic measurements of dysplastic adult hips. Skeletal Radiol. 1997;26:75–81. doi: 10.1007/s002560050197. [DOI] [PubMed] [Google Scholar]
- Eijer H, Myers SR, Ganz R. Anterior femoroacetabular impingement after femoral neck fractures. J Orthop Trauma. 2001;15:475–481. doi: 10.1097/00005131-200109000-00003. [DOI] [PubMed] [Google Scholar]
- Felson D, Lawrence R, Dieppe P, et al. Osteoarthritis: new insights. Part 1: the disease and its risk factors. Ann Intern Med. 2000;133:635–646. doi: 10.7326/0003-4819-133-8-200010170-00016. [DOI] [PubMed] [Google Scholar]
- Ganz R, Parvizi J, Beck M, et al. Femoroacetabular impingement: a cause for osteoarthritis of the hip. Clin Orthop Relat Res. 2003;417:112–120. doi: 10.1097/01.blo.0000096804.78689.c2. [DOI] [PubMed] [Google Scholar]
- Gosvig KK, Jacobsen S, Palm H, et al. A new radiological index for assessing asphericity of the femoral head in cam impingement. J Bone Joint Surg Br. 2007;89:1309–1316. doi: 10.1302/0301-620X.89B10.19405. [DOI] [PubMed] [Google Scholar]
- Gosvig KK, Jacobsen S, Sonne-Holm S, et al. The prevalence of cam-type deformity of the hip joint: a survey of 4151 subjects of the Copenhagen Osteoarthritis Study. Acta Radiol. 2008;49:436–441. doi: 10.1080/02841850801935567. [DOI] [PubMed] [Google Scholar]
- Gregory JS, Waarsing JH, Day J, et al. Early identification of radiographic osteoarthritis of the hip using an active shape model to quantify changes in bone morphometric features: can hip shape tell us anything about the progression of osteoarthritis? Arthritis Rheum. 2007;56:3634–3643. doi: 10.1002/art.22982. [DOI] [PubMed] [Google Scholar]
- Harris-Hayes M, Royer NK. Relationship of acetabular dysplasia and femoroacetabular impingement to hip osteoarthritis: a focused review. PM R. 2011;3:1055–1067. doi: 10.1016/j.pmrj.2011.08.533. e1. [DOI] [PMC free article] [PubMed] [Google Scholar]
- Jaberi FM, Parvizi J. Hip pain in young adults: femoroacetabular impingement. J Arthroplasty. 2007;22:37–42. doi: 10.1016/j.arth.2007.05.039. [DOI] [PubMed] [Google Scholar]
- James SL, Ali K, Malara F, et al. MRI findings of femoroacetabular impingement. AJR. 2006;187:1412–1419. doi: 10.2214/AJR.05.1415. [DOI] [PubMed] [Google Scholar]
- Kassarjian A, Brisson M, Palmer WE. Femoroacetabular impingement. Eur J Radiol. 2007;63:29–35. doi: 10.1016/j.ejrad.2007.03.020. [DOI] [PubMed] [Google Scholar]
- Lavigne M, Parvizi J, Beck M, et al. Anterior femoroacetabular impingement: part I. Techniques of joint preserving surgery. Clin Orthop Relat Res. 2004;418:61–66. [PubMed] [Google Scholar]
- Lequesne M, De S. False profile of the pelvis. A new radiographic incidence for the study of the hip. Its use in dysplasias and different coxopathies. Rev Rhum Mal Osteoartic. 1961;28:643–652. [PubMed] [Google Scholar]
- Lynch JA, Parimi N, Chaganti RK, et al. The association of proximal femoral shape and incident radiographic hip OA in elderly women. Osteoarthritis Cartilage. 2009;17:1313–1318. doi: 10.1016/j.joca.2009.04.011. [DOI] [PMC free article] [PubMed] [Google Scholar]
- Nakahara I, Takao M, Sakai T, et al. Gender differences in 3D morphology and bony impingement of human hips. J Orthop Res. 2011;29:333–339. doi: 10.1002/jor.21265. [DOI] [PubMed] [Google Scholar]
- Notzli HP, Wyss TF, Stoecklin CH, et al. The contour of the femoral head–neck junction as a predictor for the risk of anterior impingement. J Bone Joint Surg Br. 2002;84:556–560. doi: 10.1302/0301-620x.84b4.12014. [DOI] [PubMed] [Google Scholar]
- Pfirrmann CW, Mengiardi B, Dora C, et al. Cam and pincer femoroacetabular impingement: characteristic MR arthrographic findings in 50 patients. Radiology. 2006;240:778–785. doi: 10.1148/radiol.2403050767. [DOI] [PubMed] [Google Scholar]
- Pham DL, Xu C, Prince JL. Current methods in medical image segmentation. Annu Rev Biomed Eng. 2000;2:315–337. doi: 10.1146/annurev.bioeng.2.1.315. [DOI] [PubMed] [Google Scholar]
- Rankin G, Stokes M. Reliability of assessment tools in rehabilitation: an illustration of appropriate statistical analyses. Clin Rehabil. 1998;12:187–199. doi: 10.1191/026921598672178340. [DOI] [PubMed] [Google Scholar]
- Reikeras O, Hoiseth A. Femoral neck angles in osteoarthritis of the hip. Acta Orthop Scand. 1982;53:781–784. doi: 10.3109/17453678208992292. [DOI] [PubMed] [Google Scholar]
- Reikeras O, Bjerkreim I, Kolbenstvedt A. Anteversion of the acetabulum and femoral neck in normals and in patients with osteoarthritis of the hip. Acta Orthop Scand. 1983;54:18–23. doi: 10.3109/17453678308992864. [DOI] [PubMed] [Google Scholar]
- Standring S. Gray's Anatomy: The Anatomical Basis of Clinical Practice. Edinburgh, Scotland: Churchill Livingstone Elsevier; 2008. [Google Scholar]
- Sutter R, Dietrich TJ, Zingg PO, et al. How useful is the alpha angle for discriminating between symptomatic patients with cam-type femoroacetabular impingement and asymptomatic volunteers? Radiology. 2012;264:514–521. doi: 10.1148/radiol.12112479. [DOI] [PubMed] [Google Scholar]
- Waarsing JH, Rozendaal RM, Verhaar JAN, et al. A statistical model of shape and density of the proximal femur in relation to radiological and clinical OA of the hip. Osteoarthritis Cartilage. 2010;18:787–794. doi: 10.1016/j.joca.2010.02.003. [DOI] [PubMed] [Google Scholar]
- Wiberg G. Studies on dysplastic acetabula and congenital subluxation of the hip joint. with special reference to the complication of osteo-arthritis. Acta Chir Scand. 1939;83:1–135. [Google Scholar]