

Abstract
Background & Purpose
We report on trends in post-stroke survival, both in the early period after stroke and over the long-term. We examine these trends by stroke sub-type.
Methods
The Minnesota Stroke Survey (MSS) is a study of all hospitalized acute stroke patients aged 30–74 years in the Minneapolis-St. Paul metropolis. Validated stroke events were sampled for survey years 1980, 1985, 1990, 1995 and 2000 and subtyped as ischemic or hemorrhagic by neuroimaging for survey years 1990, 1995 and 2000. Survival was obtained by linkage to vital statistics data through the year 2010.
Results
There were 3773 acute stroke events. Age-adjusted 10-year survival improved from 1980 to 2000 (men 29.5% to 46.5%, p < 0.0001; women 32.6% to 50.5%, p < 0.0001). Ten-year ischemic stroke survival (n = 1667) improved from 1990 to 2000 (men 35.3% to 50%, p = 0.0001; women 38% to 55.3%, p < 0.0001). Ten-year hemorrhagic stroke survival showed a trend toward improvement but this (n = 489) did not reach statistical significance, perhaps because of their smaller number (men 29.7% to 45.8%, p=0.06; women 39.2% to 49.6%, p=0.2). Markers of stroke severity including unconsciousness or major neurological deficits at admission declined from 1980 to 2000 while neuroimaging use increased.
Conclusions
These post-stroke survival trends are likely due to multiple factors including more sensitive case ascertainment shifting the case-mix toward less severe strokes, improved stroke care and risk factor management, and overall improvements in population health and longevity.
Keywords: Survival, Surveillance, Stroke hemorrhagic, Stroke Ischemic
INTRODUCTION
There have been important advances in the acute and post-acute care of stroke patients in the last three decades including risk factor modifying therapies to prevent recurrent stroke events, thrombolytic treatments shown to limit post-ischemic stroke functional disability and organized stroke unit care leading to fewer post-stroke complications. Consequently, improved post-stroke survival over this period is expected. In the United States, there are no nationwide surveillance systems tracking trends in stroke survival or other post-stroke outcomes.1 The national center for vital statistics reports annual stroke related mortality. These statistics are an estimate of the population burden of stroke related deaths for a given year coded by underlying cause of death rather than a measure of stroke outcomes. A recent statement from the American Heart Association/American Stroke Association describes a significant decline in stroke mortality in the 20th century in the United States with this trend continuing into the next decade, 2001–2010.2 This decline was attributed to declining stroke incidence and recurrence rates as well as improved case fatality (early post-stroke survival). The statement identified a need to examine these improvements in stroke outcomes by stroke subtype.
In this study we use a multi-decade hospitalized-stroke – surveillance database to examine sex-specific trends in both early and long-term post-stroke survival and whether the observed survival trends are reflected across both ischemic and hemorrhagic stroke sub-types, as well as among clinically more severe strokes whose detection is unlikely to be affected bu increasingly sensitive stroke diagnostic tools. Annual stroke mortality as reported by vital statistics data is a mix of case fatality, in-hospital and 30-day stroke related deaths, and deaths which occurred subsequently which are attributed to stroke. Deaths which occur in the early post-stroke period are more likely to be assigned stroke as the underlying cause of death on death certificates and hence improvements in early post-stroke survival can be expected to influence trends in stroke mortality. Improvements in long-term survival, especially one year or more post-stroke will likely not have on effect on the reported stroke mortality. Herein, we parsed out survival across different post-stroke time epochs.
The Minnesota Stroke Survey (MSS) is a multi-decade, stroke surveillance system designed to examine trends in hospitalized stroke rates, post-stroke survival, risk factors and treatment in the Minneapolis-St. Paul metropolitan area. Data collection started in 1970, taking place typically at 5 year intervals. Results examining trends in post-stroke survival from the 1970, 1980, 1985 and 1990 surveys have been published previously.3, 4 Herein, we report on ten-year post-stroke survival outcomes pertaining to the 1995 and 2000 surveys and contrast them to post-stroke survival from the 1980s and 1990s.
We hypothesize that advances in stroke care and secondary prevention over the last 3 decades (1980–2010) have led to improved long-term survival of patients hospitalized with stroke. Ischemic strokes form a larger proportion of all strokes worldwide, and comprise 87% of all strokes in the U.S.5 Many of the acute and post-acute care treatment trials and secondary prevention trials have therefore focused on ischemic rather than hemorrhagic strokes. We hypothesize that there has been a differential improvement in survival between ischemic vs. hemorrhagic strokes with hemorrhagic strokes showing less significant survival gains over the last 3 decades.
METHODS
Survey design
The MSS was approved by the University of Minnesota Institutional Review Board. Design of the MSS has been previously described in Lakshminarayan et al. 2009,6 Shahar et al. 1997,7 and is summarized here. The target populations of the MSS were residents of the 7-county Minneapolis-St. Paul metropolitan area, aged 30–74 years who were hospitalized with stroke. Stroke cases were identified from lists of discharge diagnoses provided by all acute care hospitals serving this metropolitan area. The following acute cerebrovascular disease discharge codes from the International Classification of Disease, 9th Revision (ICD-9) were used to construct a sampling frame for each survey year: 431 (intracerebral hemorrhage), 432 (other and unspecified intracranial hemorrhage), 434 (occlusion of cerebral arteries), 436 (acute, but ill-defined cerebrovascular disease), and 437 (other and ill-defined cerebrovascular disease). Transient cerebral ischemia (Transient Ischemic Attack, TIA) (ICD-9 code 435) and subarachnoid hemorrhage (ICD-9 code 430) were not included. (Historical reasons for exclusion of TIAs8 and subarachnoid hemorrhages are in Online Supplement).
For the 1980, 1985, 1990 and 1995 surveillance years, hospital records for 50% of the cases in the sampling frame were randomly selected for detailed abstraction. In 2000, hospital records for 100% of the cases in the sampling frame underwent detailed abstraction. A small percentage of patients (5%–10%) had multiple stroke hospitalizations. We used the first event in each survey year for each person in our sampling frame.
Data abstraction and quality control
Data were abstracted from hospital records by trained nurses using standardized data abstraction forms and a manual. The following were abstracted: demographic information, medical history including prior stroke, relevant clinical information on stroke signs and symptoms, diagnostic procedures and autopsy reports. Reliability of data abstraction was examined by reabstraction of 5% of randomly selected charts by an experienced “gold standard” reference abstractor. An interrater reliability of greater than 95% was achieved for key demographic and clinical variables used to calculate stroke rates. Photocopied neuroimaging reports were independently abstracted by a physician reviewer using a manual and standardized data collection forms.
Stroke case definitions
The MSS has traditionally used multiple diagnostic definitions to examine stroke rates6. Some of these definitions are based solely on ICD-9 codes while others use clinical features and neuroimaging findings in addition to ICD-9 codes. The reason for using multiple diagnostic definitions was to account for changes in case ascertainment sensitivity and specificity due to evolving technological (e.g. neuroimaging) advances or coding policies.
To examine post-stroke survival we used the following two case definitions: 1) World Health Organization (WHO) definition: cases with at least 1 acute cerebrovascular disease ICD-9 code (431,432,434, 436, 437) listed among hospital discharge diagnoses and meeting the WHO criteria for acute stroke: a new neurological deficit of presumed vascular origin lasting at least 24 hours or until death if death occurred within 24 hours with exclusion of non-stroke etiologies such as tumors and subdural hematomas; 2) neuroimaging definition: cases where at least 1 acute cerebrovascular disease ICD-9 code is listed among hospital discharge diagnoses and identified as experiencing definite, probable or possible acute strokes by neuroimaging. Strokes identified by neuroimaging were sub-typed into ischemic and hemorrhagic strokes in order to examine post-stroke survival by subtype.
The WHO definition was applied to survey years 1980, 1985, 1990, 1995 and 2000. The neuroimaging definition was applied to survey years 1990, 1995 and 2000 when neuroimaging was used more frequently.
Post-stroke survival
Post-stroke death and death date were identified for all cases by linkage of the MSS to the Minnesota Department of Health vital statistics data. Personal identifiers enabling this linkage were available for 100% of the patients in survey years 1980, 1985, 1990 and 1995 and for 97% of the patients in the year 2000. Cases were tracked for death through 2010. We had multi-decade survival for the early survey years but less for more recent cohorts. That is, stroke cases hospitalized in 1980 were tracked for 30 years through 2010 whereas cases hospitalized in the year 2000 while also tracked through 2010 had only 10 years of post-stroke survival data.
Statistical analysis
Patient characteristics were tested for an overall trend across survey years. The Cochran-Armitage Trend test was used for comparing categorical variables and the Generalized Linear Model, (PROC GLM; SAS version 9.2 software, SAS Institute, Inc., Cary North Carolina) linear trend estimate was used for comparing the means of continuous variables.
To compare survival across survey years, sex-specific, age-adjusted (to the year 2000 US Census), short-term (in-hospital, 28-day) and long-term (1-year, 5 year, 10-year) survival post-stroke was calculated for each survey year for cases identified by the WHO definition and tested for an overall trend across the survey years. Survival trends following ischemic and hemorrhagic strokes identified by the neuroimaging definition were similarly examined.
In order to tease apart the effects of more sensitive case ascertainment leading to milder strokes in the case-mix and hence apparent improved survival vs. actual survival gains, we examined age-adjusted survival trends in subsets of patients who were admitted with severe strokes, i.e. those who were unconscious or had a major neurological deficit at admission.
RESULTS
A total of 6032 stroke patients were sampled among the 5 survey cohorts (Table 1). Of all the acute strokes identified by discharge ICD-9 codes in the sampling frame, 55–70% were validated as acute strokes by the WHO definition of stroke and 45–59% were classified as strokes by neuroimaging criteria. Ischemic strokes formed 4/5 (75–81%) of all neuroimaging validated strokes. The percentage of neuroimaging strokes that did not meet the WHO definition increased from 13% in 1990 to 22% in 2000.
Table 1.
Numbers of Hospitalized Acute Stroke Events in the Minneapolis-St. Paul, Minnesota Metropolitan Area across Survey Years. Age Range 30–74 Years.
| Survey year | |||||
|---|---|---|---|---|---|
|
| |||||
| Sampling frame* |
1980 N (%) |
1985 N (%) |
1990 N (%) |
1995 N (%) |
2000 N (%) |
| ICD-9 431, 432, 434, 436 or 437 | 1040 | 899 | 1000 | 1024 | 2069 |
| WHO stroke definition** | 567 (55) | 602 (67) | 695 (70) | 660 (65) | 1249 (60) |
| Stroke by neuroimaging** | 489 (49) | 457 (45) | 1210 (59) | ||
| Ischemic stroke*** | 397 (81) | 360 (79) | 910 (75) | ||
| Hemorrhagic stroke*** | 92 (19) | 97 (21) | 300 (25) | ||
Abbreviations: ICD-9 = International Classification of Diseases, 9th edition. WHO = World Health Organization. The ICD-9 based rates represent events in the entire sampling frame. See Methods for WHO and neuroimaging definitions.
Fifty percent of eligible acute stroke hospitalizations were sampled in 1980–1995 and 100 of eligible acute stroke hospitalizations were sampled in 2000 – hence the substantially larger number of events in the year 2000 compared to prior cohort years.
Percent of events meeting the given definition out of all ICD coded strokes in the sampling frame.
Percent of events ischemic or hemorrhagic strokes respectively meeting the neuroimaging definition of stroke.
Table 2 summarizes trends in demographic and clinical characteristics for events satisfying the WHO stroke definition. The mean ages of stroke patients declined from 64 years in 1980 to 62 years in 2000 (p=0.0002); there was a significant decline in the median age as well (66 and 65 years respectively, p<0.0001). Consonant with temporal changes in the demographics of the metropolitan area, the proportion of patients categorized as non-caucasian increased over time. Prevalence of a history of stroke, transient ischemic attack and atrial fibrillation fluctuated across the survey years without clear rising or declining trends. Prior history of myocardial infarction declined across the survey years while history of pre-stroke hypertension showed a rising trend. Neuroimaging use increased significantly with almost all cases undergoing some type of neuroimaging from 1990 onward. Use of brain MRI increased from 18% in the 1990 survey to 60% in the year 2000. The proportion of patients unconscious at admission declined in the year 2000 compared to survey patients from previous decades. The proportion of patients admitted with major neurological deficits also declined in the later survey years. Length of hospital stay declined significantly with a big drop from 1980 (median LOS = 12 days) to 1985 (median LOS = 8).
Table 2.
Patient Population Characteristics across Survey Years for WHO Stroke Events Age Range 30–74 Years in Minneapolis-St. Paul, Minnesota Metropolitan Area.
| Variable |
1980 n=567 |
1985 n=602 |
1990 n=695 |
1995 n=660 |
2000 n=1249 |
p-trend |
|---|---|---|---|---|---|---|
| Sex, Female, % | 44 | 46 | 47 | 45 | 47 | 0.36 |
| Mean age, years | 64 | 64 | 64 | 63 | 62 | 0.0002 |
| Median Age, years | 66 | 66 | 67 | 66 | 65 | <0.0001 |
| Race, % | ||||||
| White | 87 | 92 | 91 | 82 | 74 | <0.0001 |
| Black | 5 | 3 | 5 | 9 | 7 | |
| Asian | 1 | 1 | 1 | 1 | 5 | |
| Hispanic | 0 | 0 | 0 | 0 | 2 | |
| Native American/other | 1 | 1 | 1 | 3 | 1 | |
| Missing | 5 | 3 | 1 | 5 | 11 | |
| Preadmission history, % | ||||||
| History of stroke | 21 | 25 | 27 | 28 | 25 | 0.12 |
| History of TIA | 10 | 15 | 10 | 18 | 10 | 0.77 |
| History of MI | – | 20 | 19 | 16 | 16 | 0.006 |
| History of atrial fibrillation | 14 | 15 | 19 | 17 | 14 | 0.78 |
| History of hypertension | 53 | 58 | 63 | 67 | 68 | <0.0001 |
| History of diabetes mellitus | – | – | 31 | 32 | 28 | 0.11 |
| Clinical Variables, % | ||||||
| Level of consciousness | ||||||
| Unconscious | 16 | 14 | 17 | 13 | 10 | <0.0001 |
| Conscious | 79 | 85 | 81 | 86 | 90 | |
| Missing | 5 | 1 | 2 | 1 | 0 | |
| Neurologic deficit, % | ||||||
| Major deficit (aphasia*, coma, visual field cut*, motor* or sensory* deficits in 2 of 3 body parts (face, arm, leg) | 78 | 82 | 77 | 73 | 72 | <0.0001 |
| Minor deficit (slurred speech, apraxia, limited motor or sensory deficit, gait difficulties) | 22 | 18 | 23 | 27 | 28 | |
| Median LOS (IQR), days | 12 (19) | 8 (8) | 7 (7) | 5 (5) | 5 (5) | <0.0001 |
| Neuroimaging present (CT or MRI), % | 75 | 88 | 96 | 98 | 98 | <0.0001 |
| MRI present, % | 18 | 30 | 60 | <0.0001 | ||
| Diffusion Weighted Imaging, % | 35 |
Abbreviations: CT= computed tomography. IQR = inter-quartile range. LOS = length of stay. MI = myocardial infarction. MRI = magnetic resonance imaging. TIA = transient ischemic attack. WHO=World Health Organization. LOS excludes patients who died in-hospital, n=487.
= excludes events who were unconscious during the first examination, (n = 498).
There were substantial gains in both early and long-term age-adjusted post-stroke survival for men and women between 1980 and 2000 (Figure 1, Table 3). Early stroke survival assessed at 30-days, improved between 1980 and 1985 with little improvement across subsequent survey years for men and women. Over the long-term (Figure 1), there was little improvement in men at 1 year post-stroke between 1980 and 1985 and then a clear improvement across subsequent survey years. For women, the pattern was not monotonic but there were clear improvements in survival between 1980 and 1985, a slowing in 1990 and then a clear separation of the survival curves in subsequent surveys. Ten year survival improved in both men and women. The improved survival persisted after excluding patients who died in the first year post-stroke.
Figure 1.
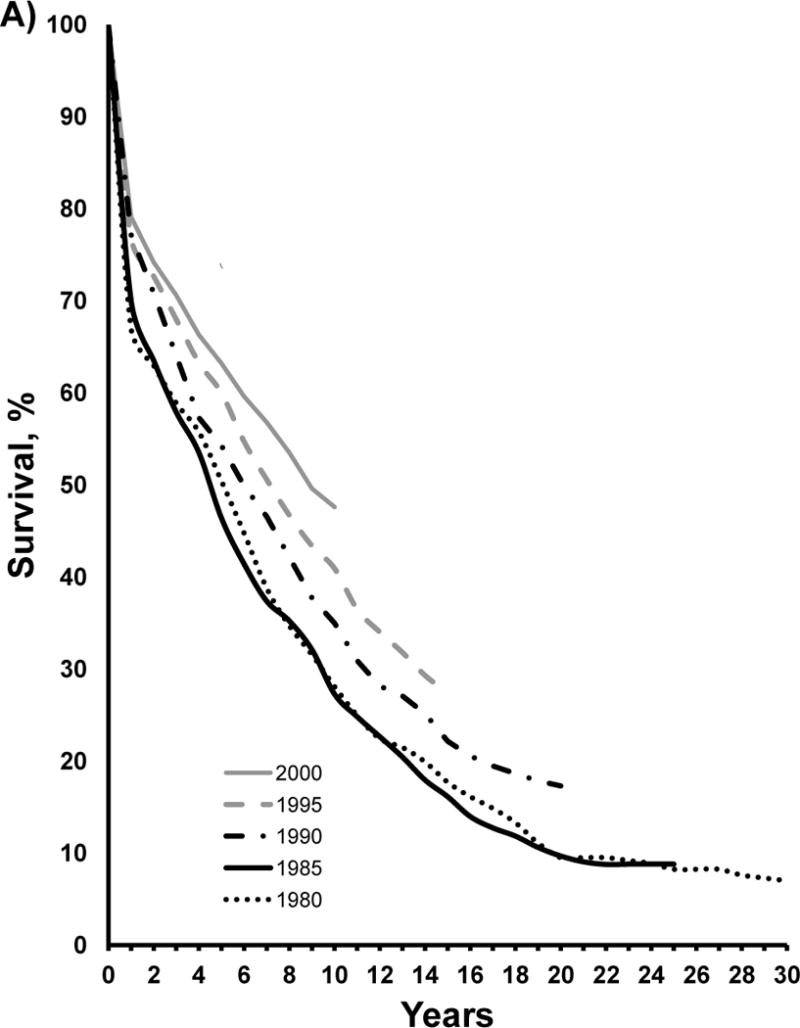

Multi-decade survival trends after stroke in men (A) and women (B) aged 30–74 years in the Minneapolis St. Paul metropolitan area acute care hospitals from 1980 to 2000 for cases determined according to the World Health Organization definition of stroke. Refer to Methods for this definition.
Table 3.
Age Adjusted Survival Across Survey Years for Stroke Events Defined by the WHO Stroke Definition Among Men and Women Aged 30–74 Years in Minneapolis-St. Paul, Minnesota Metropolitan Area.
| Age Adjusted Survival, % | ||||||
|---|---|---|---|---|---|---|
| 1980 | 1985 | 1990 | 1995 | 2000 | P-trend | |
| Men, n | 318 | 325 | 368 | 361 | 637 | |
| 30-day | 77.9 | 82.9 | 87.9 | 84.6 | 85.7 | 0.0026 |
| 1-year | 67.5 | 70.8 | 77.7 | 77.0 | 78.7 | <0.0001 |
| 5-years | 51.4 | 47.7 | 55.5 | 60.4 | 62.3 | <0.0001 |
| 10-years | 29.5 | 29.0 | 36.8 | 41.5 | 46.5 | <0.0001 |
| 1-year among 30-day survivors | 86.5 | 85.3 | 88.5 | 91.0 | 91.9 | 0.0022 |
| 10-years among 1 year survivors | 43.1 | 40.4 | 47.6 | 54.3 | 59.0 | <0.0001 |
| Women, n | 249 | 277 | 327 | 299 | 576 | |
| 30-day | 79.1 | 85.1 | 84.4 | 86.8 | 88.1 | 0.0013 |
| 1-year | 64.3 | 74.6 | 72.2 | 75.5 | 79.6 | <0.0001 |
| 5-years | 47.8 | 58.8 | 53.2 | 57.8 | 64.6 | <0.0001 |
| 10-years | 32.6 | 41.8 | 38.2 | 41.6 | 50.5 | <0.0001 |
| 1-year among 30-day survivors | 81.2 | 87.6 | 85.5 | 87.0 | 90.4 | 0.0049 |
| 10-years among 1 year survivors | 50.1 | 55.8 | 53.1 | 54.6 | 63.8 | 0.0074 |
Survival trends by stroke subtype – ischemic versus hemorrhagic – became available in 1990 due to advances in imaging technology. Early (30-day) ischemic stroke survival did not show significant improvement between 1990 and 2000 for men or women (Table 4). There was a significant increase in one year survival among women (74% vs. 83%, p=−0.02); the increase in one year survival among men did not reach significance (78% vs. 83%, p=0.12). Long term ischemic stroke survival over 10 years improved significantly in both men and women in the year 2000 compared to earlier surveys. In men, 10 year ischemic stroke survival was 35% in 1990 and 50% in 2000, (p = 0.0001). In women, the corresponding stroke survival was 38% in 1990 and 55% in 2000 (p=<0.0001). The improvement in long-term 10 year survival persisted even when the observations were limited to those who survived their first post-stroke year.
Table 4.
Age Adjusted Survival Across Survey Years for Ischemic and Hemorrhagic Stroke Events Defined by Neuroimaging Definition Among Men and Women Aged 30–74 Years in Minneapolis-St. Paul, Minnesota Metropolitan Area.
| Age Adjusted Survival, % | ||||
|---|---|---|---|---|
| 1990 | 1995 | 2000 | P-trend | |
| Ischemic Strokes | ||||
|
| ||||
| Men, n | 229 | 201 | 480 | |
| 30-day | 88.3 | 83.3 | 89.8 | 0.56 |
| 1-year | 77.6 | 77.2 | 82.6 | 0.12 |
| 5-years | 51.2 | 60.7 | 66.6 | <0.0001 |
| 10-years | 35.3 | 41.3 | 50.0 | 0.0001 |
| 1-year among 30-day survivors | 87.8 | 92.4 | 91.9 | 0.09 |
| 10-years among 1-year survivors | 45.1 | 53.2 | 60.9 | 0.0002 |
| Women, n | 168 | 159 | 401 | |
| 30-day | 86.6 | 85.1 | 91.6 | 0.08 |
| 1-year | 73.6 | 75.7 | 82.5 | 0.02 |
| 5-years | 51.9 | 59.0 | 69.1 | <0.0001 |
| 10-years | 38.0 | 39.1 | 55.3 | <0.0001 |
| 1-year among 30-day survivors | 84.9 | 88.9 | 90.2 | 0.09 |
| 10-years among 1 year survivors | 51.3 | 51.2 | 67.3 | 0.0011 |
|
| ||||
| Hemorrhagic Strokes | ||||
|
| ||||
| Men, n | 41 | 54 | 122 | |
| 30-day | 61.4 | 66.7 | 68.7 | 0.39 |
| 1-year | 47.1 | 53.7 | 62.9 | 0.08 |
| 5-years | 41.2 | 46.2 | 53.4 | 0.17 |
| 10-years | 29.7 | 33.3 | 45.8 | 0.06 |
| 1-year among 30-day survivors | 76.5 | 80.5 | 91.5 | 0.06 |
| 10-years among 1 year survivors | 59.0 | 62.6 | 73.6 | 0.18 |
| Women, n | 51 | 43 | 174 | |
| 30-day | 62.8 | 70.4 | 69.4 | 0.38 |
| 1-year | 53.3 | 65.9 | 65.2 | 0.12 |
| 5-years | 50.3 | 59.3 | 57.4 | 0.38 |
| 10-years | 39.2 | 52.6 | 49.6 | 0.20 |
| 1-year among 30-day survivors | 84.6 | 93.6 | 94.0 | 0.09 |
| 10-years among 1 year survivors | 74.5 | 80.0 | 75.9 | 0.88 |
Hemorrhagic stroke survival was substantially worse than ischemic stroke survival (Table 4). Early deaths were considerable in 1990 (30-day survival was 61% in men and 63% in women) and remained substantial in 2000 (69% 30-day survival in men and women). Early hemorrhagic stroke mortality was more than three times early ischemic stroke mortality. One year survival after hemorrhagic stroke improved between 1990 and 2000 (47% to 63% in men and 53% to 65% in women) but was not statistically significant probably because of the small number of hemorrhagic strokes. Ten year survival after hemorrhagic strokes improved from 29% in 1990 to 48% in 2000 (p=0.06) in men and from 39% in 1990 to 49% in 2000 (p=0.1973) in women. While not-significant, long-term hemorrhagic stroke survival showed a pattern of improvement similar to ischemic stroke though the numbers and power were small. To verify this, we examined age-adjusted hemorrhagic stroke survival trends after combining men and women (Online Table I). In this combined analysis, 1-year survival improved from 50% in 1990 to 64% in 2000 (p=0.02), and 10-year survival improved from 35% in 1990 to 48% in 2000 (p=0.03), this improvement was largely due to improved 1 year survival.
Survival trends were examined separately in patients with severe strokes i.e. those admitted unconscious or with major neurological deficits, Table 5. Early survival did not improve for those admitted unconscious, (30-day survival 34% in 1980; 36% in 2000; p=0.79). Long-term survival showed some gains but we could not demonstrate significance, perhaps due to small sample size and consequent limited power (1 year survival 21% in in 1980 and 29% in 2000; p = 0.14; 10-year survival 9% in 1980 and 16% in 2000; p=0.12). For those admitted with major neurological deficits, both early survival (79% in 1980, 91% in 2000; p < 0.0001) and long-term survival (10-year survival 33% in 1980, 51% in 2000, p < 0.0001) improved.
Table 5.
Age Adjusted Survival Across Survey Years for Stroke Events Defined by the WHO Stroke Definition Among Men and Women (Combined) Aged 30–74 Years Hospitalized in Minneapolis-St. Paul, Minnesota Metropolitan Area. Survival shown for Patients who were Unconscious or with Major Neurological Deficits at Admission. Table 2 Defines Major Neurological Deficits.
| Age Adjusted Survival, % | ||||||
|---|---|---|---|---|---|---|
| 1980 | 1985 | 1990 | 1995 | 2000 | P-trend | |
| Unconscious, n | 90 | 85 | 115 | 85 | 120 | |
| 30-day | 33.7 | 35.4 | 36.3 | 35.3 | 35.8 | 0.79 |
| 1-year | 21.4 | 23.5 | 24.0 | 28.3 | 29.2 | 0.14 |
| 5-years | 17.0 | 14.2 | 16.3 | 18.8 | 19.1 | 0.46 |
| 10-years | 9.2 | 9.5 | 9.3 | 11.7 | 15.8 | 0.12 |
|
| ||||||
| Major Deficit, n | 440 | 491 | 535 | 479 | 872 | |
| 30-day | 79.2 | 81.1 | 84.2 | 89.7 | 91.2 | <0.0001 |
| 1-year | 66.2 | 69.9 | 72.3 | 80.1 | 83.2 | <0.0001 |
| 5-years | 49.8 | 51.0 | 53.8 | 62.9 | 66.7 | <0.0001 |
| 10-years | 32.7 | 33.3 | 37.9 | 43.2 | 50.6 | <0.0001 |
DISCUSSION
This large multi-decade study of hospitalized stroke patients showed improved survival from 1980 to 2000. Early stroke survival improved between 1980 and 1985 with little improvement across subsequent survey years for men and women. Long-term survival over 1-year and 10-years after stroke improved in both men and women. The conditional rates of 1 year survival among 30-day survivors and 10-year survival among 1 year survivors indicate that the gains are due to improved long-term survival with a more limited contribution from improvements in early survival. When survey years were restricted to 1990–2000 and survival by sub-type was examined, long-term survival improved significantly for ischemic strokes. Hemorrhagic stroke survival improved as well but due to the smaller numbers of hemorrhagic stroke, the trends in improvement did not reach statistical significance. When men and women were analyzed together, 1-year and 10-year hemorrhagic stroke survival showed significant improvement between 1990 and 2000.
We are aware of no regional studies that have monitored stroke mortality trends over the long-term in the 1980–2000 as we are reporting. There are however reports of comparable trends in 30-day mortality from other regional studies. The Framingham cohort study9, 10 reports a 30-day mortality of 20% and 21% in men and women for overall stroke during 1978–1989. The MSS mortality rate ranged between 17–22% for men and 15–21% for women during the 1980 and1985 surveys with the lower mortality pertaining to the 1985 survey. For a later time period spanning 1990–2004, Framingham reported a 30-day mortality rate of 14% in men and 20% in women. The MSS mortality rate spanned 12–15% for men and 12–16% for women for 1990, 1995 and 2000 surveys. The Atherosclerosis Risk in Community (ARIC) study11 examined 30-day mortality for ischemic and hemorrhagic strokes hospitalized between 1987 and 1995, a period overlapping with our study, and found 30-day mortality rates of 7–8% for ischemic strokes and 30–35% for hemorrhagic strokes. Although ARIC and MSS hemorrhagic stroke mortality rates are comparable, ischemic stroke mortality rates were higher (range 12–17%) in the MSS for some survey years. When comparing MSS and GCNKSS (Greater Cincinnati Northern Kentucky Stroke Study) hemorrhagic stroke death rates, MSS rates were somewhat lower (47–53% in 1990; 35–37% in 2000) than those reported by the GCNKSS (59% in 1988; 53% during 1998–2003)12.
Our data provides circumstantial evidence on factors which could underlie the observed trends in post-stroke survival. The improvement in early survival could be due to the detection of less severe events or due to improved care. As we argued in an earlier report6 several markers of stroke severity appear to have declined between 1980 and 2000 though some of this could be artifactual. For example, the median length of stay declined, with the steepest change between 1980 and 1985. The reliability of length of stay as a marker for severity, however, is reduced because it was coincident with the introduction of diagnosis-related group-based reimbursement in the early 1980s.13 The proportion of cases admitted with a major neurological deficit declined. The proportion of unconscious cases at admission declined as well but this could be due to the influence of neuroimaging on discharge coding, i.e. unconsciousness at admission is often not due to stroke and the increased use of neuroimaging likely helped increase the specificity of discharge coding.6
It is also likely that the case-mix has shifted toward less severe events due to the more sensitive case ascertainment facilitated by newer technology such as MRI and diffusion weighted imaging which can detect small strokes. The re-classification of some TIA as strokes based on neuroimaging evidence of stroke is also a factor in the shift toward less severe events as the use of imaging has increased. Supporting this, we note that the proportion of neuroimaging strokes which did not meet the WHO criteria of a focal deficit of presumed vascular origin lasting at least 24 hours increased from 13% in 1990 to 22% in 2000.
While the preceding observations indicate a change in the case-mix toward less severe events in later survey years, we note that survival has also improved in severe strokes especially in those admitted with major deficits (Table 5). Both early and long-term survival improved in those admitted with major deficits. While there was a clear lack of improvement in early survival in those unconscious at admission, there was a trend toward improved long-term survival even in this sub-group.
The observed improvement in long-term survival between is likely a reflection of increased use of secondary preventive therapies and especially improved hypertension awareness and treatment.2 This improved awareness and management of hypertension is true for our Minnesota population,14 as well as nationwide.15 We note that the history of hypertension in stroke patients (Table 2) has increased. The Minnesota Heart Survey, a parallel study to the Minnesota Stroke Survey found declining rates of hypertension in the general Minneapolis-St. Paul population but an increase in the proportion of patients who were aware of their diagnosis of hypertension.14 The NHANES study also found increased awareness, detection and treatment of hypertension at a national level in the United States.15 Hence, we argue that it is likely that there is likely improved hypertension management that has contributed to fewer recurrent vascular events and improved survival. There is also greater evidence for secondary preventive therapies in stroke including trials of anti-thrombotic agents such as anticoagulation for atrial fibrillation patients with stroke which have also driven down stroke recurrence rates and presumably improved survival. There is some indication that the overall patient population is trending toward a healthier profile. The lower prevalence of a history of myocardial infarction in subsequent survey years supports this.
Finally, we note that the overall life-expectancy in the general population has increased over the time-period of the study. Hence, this could also contribute to improved stroke survival in synergy with specific improvements in post-stroke treatments and care. For example, the median life-expectancy in the 7-county metro area covered by the MSS increased 6.0 years in men (72.3 years in 1980 vs. 78.3 years in 2005) and 2.3 years in women (80 years in 1980 vs. 82.3 years in 2005) during the time period of our study.16 Based on the above observations, we believe that the improvement in post-stroke survival is likely due to multiple trends including shifts in the case-mix toward less severe strokes mediated by more sensitive case ascertainment and re-classification of TIA as strokes in later surveys, improved acute and post-acute treatments (e.g. stroke unit care) as evidenced by improved early survival even in those with severe strokes, improved evidence for and increased use of secondary preventive therapies and treatment of risk factors such as hypertension which have driven down recurrence of stroke and other vascular events, and finally a shift in the patient population toward a healthier profile and increased longevity in the general population as a whole.
Strengths of our study include our use of algorithmic clinical and neuroimaging based stroke definitions across survey years and rather than pure ICD-9 based stroke metrics. These clinical and neuroimaging based algorithms enable consistent case definitions and allow for comparison of outcomes across multiple surveys. Also, a unique aspect of the MSS is the availability of multi-decade survival data. One weakness is that since the MSS is by design a study of hospitalized strokes, it cannot be used to examine non-hospitalized strokes. Data from other studies such as the NOMAS17 suggest that between 6–7% of strokes are missed by hospital surveillance alone. While we include all metro area hospitals in our surveillance, a small proportion of strokes including nursing home strokes, and strokes which did not come to medical attention, could have well been missed by our surveillance system. The population under-surveillance is the Minneapolis-St. Paul metro area and we excluded patients residing in zip codes outside the metro area from our surveillance. Minneapolis-St. Paul residents hospitalized outside the metro area were also missed; however, we believe this number to be small since most of the large hospitals are within the metro area. Therefore, the MSS is very close to a population sample of strokes. The age range of our hospitalized stroke patients is limited to 30–74 years. Hence, we are unable to comment on the survival of those younger than 30 or older than 75 years of age. The Global Burden of Disease study18 found that in high income countries (which would be comparable to the MSS setting) stroke mortality has declined in all age groups including the very young (< 20 years old), young and middle aged (21–64 years old), older (65–74 years) and in the very old (≥ 75 years) for both ischemic and hemorrhagic strokes. While stroke mortality as obtained from the death certificate data reflects post-stroke survival, it is incomplete because as strokes become more remote in time from death the likelihood that they will be documented as contributing cause of death declines. The current study, based on propspective case identification, prolonged observation and complete ascertainment of mortality status supports the Global Burden of Disease study results. By extrapolation, it is likely that the findings of improvement in mortality in the young and the very old by the Global Burden of Disease study is valid as well.
In conclusion, 10-year post-stroke survival has shown significant gains between 1980 and 2000. Most of the survival gains appear to be due to improved long-term survival with a more limited contribution from short-term improvement. The observed improvements in post-stroke survival is likely multi-factorial and due to more sensitive case ascertainment identifying less severe strokes, overall improvements in population health and longevity, and better secondary preventive therapies after stroke.
Supplementary Material
Acknowledgments
SOURCES OF FUNDING
This research was supported by the National Institute of Neurological Disorders and Stroke (NINDS)/National Institutes of Health (NIH) (grant R01NS39028). K. L. was supported by an NINDS/NIH career development award (grant K23NS051377).
Footnotes
DISCLOSURES
None
References
- 1.Goff DC, Jr, Brass L, Braun LT, Croft JB, Flesch JD, Fowkes FG, et al. Essential features of a surveillance system to support the prevention and management of heart disease and stroke: a scientific statement from the American Heart Association Councils on Epidemiology and Prevention, Stroke, and Cardiovascular Nursing and the Interdisciplinary Working Groups on Quality of Care and Outcomes Research and Atherosclerotic Peripheral Vascular Disease. Circulation. 2007;115:127–155. doi: 10.1161/CIRCULATIONAHA.106.179904. [DOI] [PubMed] [Google Scholar]
- 2.Lackland DT, Roccella EJ, Deutsch AF, Fornage M, George MG, Howard G, et al. Factors influencing the decline in stroke mortality: a statement from the American Heart Association/American Stroke Association. Stroke. 2014;45:315–353. doi: 10.1161/01.str.0000437068.30550.cf. [DOI] [PMC free article] [PubMed] [Google Scholar]
- 3.Shahar E, McGovern PG, Pankow JS, Doliszny KM, Smith MA, Blackburn H, et al. improved survival of stroke patients during the 1980s. The Minnesota Stroke Survey. Stroke. 1995;26:1–6. doi: 10.1161/01.str.26.1.1. [DOI] [PubMed] [Google Scholar]
- 4.McGovern PG, Pankow JS, Burke GL, Shahar E, Sprafka JM, Folsom AR, et al. Trends in survival of hospitalized stroke patients between 1970 and 1985. The Minnesota Heart Survey. Stroke. 1993;24:1640–1648. doi: 10.1161/01.str.24.11.1640. [DOI] [PubMed] [Google Scholar]
- 5.Go AS, Mozaffarian D, Roger VL, Benjamin EJ, Berry JD, Borden WB, et al. Heart Disease and Stroke Statistics–2013 Update: A Report From the American Heart Association. Circulation. 2013;127:e6–e245. doi: 10.1161/CIR.0b013e31828124ad. [DOI] [PMC free article] [PubMed] [Google Scholar]
- 6.Lakshminarayan K, Anderson DC, Jacobs DR, Jr, Barber CA, Luepker RV. Stroke rates: 1980–2000: the Minnesota Stroke Survey. Am J Epidemiol. 2009;169:1070–1078. doi: 10.1093/aje/kwp029. [DOI] [PMC free article] [PubMed] [Google Scholar]
- 7.Shahar E, McGovern PG, Pankow JS, Doliszny KM, Smith MA, Blackburn H, et al. Stroke rates during the 1980s. The Minnesota Stroke Survey. Stroke. 1997;28:275–279. doi: 10.1161/01.str.28.2.275. [DOI] [PubMed] [Google Scholar]
- 8.Kim JS. Symptoms of transient ischemic attack. Front Neurol Neurosci. 2014;33:82–102. doi: 10.1159/000351905. [DOI] [PubMed] [Google Scholar]
- 9.Carandang R, Seshadri S, Beiser A, Kelly-Hayes M, Kase CS, Kannel WB, et al. Trends in incidence, lifetime risk, severity, and 30-day mortality of stroke over the past 50 years. JAMA. 2006;296:2939–2946. doi: 10.1001/jama.296.24.2939. [DOI] [PubMed] [Google Scholar]
- 10.Sacco RL, Wolf PA, Kannel WB, McNamara PM. Survival and recurrence following stroke. The Framingham study. Stroke. 1982;13:290–295. doi: 10.1161/01.str.13.3.290. [DOI] [PubMed] [Google Scholar]
- 11.Rosamond WD, Folsom AR, Chambless LE, Wang CH, McGovern PG, Howard G, et al. Stroke incidence and survival among middle-aged adults: 9-year follow-up of the Atherosclerosis Risk in Communities (ARIC) cohort. Stroke. 1999;30:736–743. doi: 10.1161/01.str.30.4.736. [DOI] [PubMed] [Google Scholar]
- 12.Flaherty ML, Haverbusch M, Sekar P, Kissela B, Kleindorfer D, Moomaw CJ, et al. Long-term mortality after intracerebral hemorrhage. Neurology. 2006;66:1182–1186. doi: 10.1212/01.wnl.0000208400.08722.7c. [DOI] [PubMed] [Google Scholar]
- 13.Diagnosis Related Groups (DRGs) and the Medicare program. Implications for medical technology—a technical memorandum. Washington D.C.: US Congress, Office of Technology Assessment; 1983. (Publication OTA-TM-H-17). 1983. [Google Scholar]
- 14.Luepker RV, Arnett DK, Jacobs DR, Jr, Duval SJ, Folsom AR, Armstrong C, et al. Trends in blood pressure, hypertension control, and stroke mortality: the Minnesota Heart Survey. Am J Med. 2006;119:42–49. doi: 10.1016/j.amjmed.2005.08.051. [DOI] [PubMed] [Google Scholar]
- 15.Hajjar I, Kotchen TA. Trends in prevalence, awareness, treatment, and control of hypertension in the United States, 1988–2000. JAMA. 2003;290:199–206. doi: 10.1001/jama.290.2.199. [DOI] [PubMed] [Google Scholar]
- 16.McMurry M. Life expectancy in Minnesota by Region. State Demographic Website. Available at: http://www.demography.state.mn.us/documents/LifeExpectancyVariesbyRegion%20.pdf. Accessed July, 2009.
- 17.Sacco RL, Boden-Albala B, Gan R, Chen X, Kargman DE, Shea S, et al. Stroke incidence among white, black, and Hispanic residents of an urban community: the Northern Manhattan Stroke Study. Am J Epidemiol. 1998;147:259–268. doi: 10.1093/oxfordjournals.aje.a009445. [DOI] [PubMed] [Google Scholar]
- 18.Feigin VL, Forouzanfar MH, Krishnamurthi R, Mensah GA, Connor M, Bennett DA, et al. Global and regional burden of stroke during 1990–2010: findings from the Global Burden of Disease Study 2010. Lancet. 2014;383:245–254. doi: 10.1016/s0140-6736(13)61953-4. [DOI] [PMC free article] [PubMed] [Google Scholar]
Associated Data
This section collects any data citations, data availability statements, or supplementary materials included in this article.