

Abstract
The dynamics of nitrate (NO−3), a major nitrogen (N) source for natural plants, has been studied mostly through experimental N addition, enzymatic assay, isotope labeling, and genetic expression. However, artificial N supply may not reasonably reflect the N strategies in natural plants because NO−3 uptake and reduction may vary with external N availability. Due to abrupt application and short operation time, field N addition, and isotopic labeling hinder the elucidation of in situ NO−3-use mechanisms. The concentration and natural isotopes of tissue NO−3 can offer insights into the plant NO−3 sources and dynamics in a natural context. Furthermore, they facilitate the exploration of plant NO−3 utilization and its interaction with N pollution and ecosystem N cycles without disturbing the N pools. The present study was conducted to review the application of the denitrifier method for concentration and isotope analyses of NO−3 in plants. Moreover, this study highlights the utility and advantages of these parameters in interpreting NO−3 sources and dynamics in natural plants. We summarize the major sources and reduction processes of NO−3 in plants, and discuss the implications of NO−3 concentration in plant tissues based on existing data. Particular emphasis was laid on the regulation of soil NO−3 and plant ecophysiological functions in interspecific and intra-plant NO−3 variations. We introduce N and O isotope systematics of NO−3 in plants and discuss the principles and feasibilities of using isotopic enrichment and fractionation factors; the correlation between concentration and isotopes (N and O isotopes: δ18O and Δ17O); and isotope mass-balance calculations to constrain sources and reduction of NO−3 in possible scenarios for natural plants are deliberated. Finally, we offer a preliminary framework of intraplant δ18O-NO−3 variation, and summarize the uncertainties in using tissue NO−3 parameters to interpret plant NO−3 utilization.
Keywords: atmospheric nitrate, denitrifier method, isotopic enrichment, isotopic fractionation, nitrate reductase, oxygen isotope, plant nitrate, soil nitrogen availability
Plant nitrate (NO−3) in a natural context
Nitrogen (N) is a key factor in the control of the primary productivity in terrestrial plant ecosystems (Vitousek and Howarth, 1991; LeBauer and Treseder, 2008). Among the N species available to plants, ammonium (NH+4) is dominant in the inorganic N of unfertilized soils (Schimel and Bennett, 2004) and atmospheric N deposition (Stevens et al., 2011). Some plants prefer NH+4 (Britto and Kronzucker, 2013) while the roots of a few plants directly absorb organic N (Chapin et al., 1993; Näsholm et al., 2009; Hill et al., 2013). However, nitrate (NO−3) is an important N source for all plants because of its versatile functions in both plant nutrition and physiological regulations (Raven, 2003; Wang et al., 2012). The utilization of NO−3 (mainly uptake and reduction/assimilation) has been investigated intensively in plants through characterization of related enzymes including nitrate reductase (NR) and nitrite reductase (NiR) and their activities (NRA and NiRA, respectively) in response to different environmental conditions (Beevers and Hageman, 1969; Atkin et al., 1993; Kronzucker et al., 1995; Campbell, 1999). The framework of plant NO−3 studies has expanded in the past few decades due to the availability of molecular techniques. A few model plants have been used in understanding the transporters responsible for NO−3 uptake and transportation (Wang et al., 2012). Besides its function in nutrient supply, plant NO−3 and its metabolism contain unique information related to the mediation of plant physiology, diversity, and the ecosystem N cycle (Crawford, 1995; Tischner, 2000). However, evolution has yielded diverse strategies by which plants acquire N and NO−3 from natural environments to adapt to changes in ecosystem N availability (Chapin, 1980; Raven and Yin, 1998; Nacry et al., 2013). Therefore, there are considerable uncertainties in assessing the utilization of NO−3 by plants in natural habitats, which cannot be explained fully by laboratory-based mechanisms because of methodological constraints. Consequently, a great need exists for a straightforward estimation of plant NO−3 availability and a mechanistic understanding of the processes controlling plant NO−3 uptake and reduction. These can enhance our understanding of the role of plant NO−3 utilization in the ecosystem N cycle and the changes of plant growth and diversity with ecosystem N status (Lambers et al., 2008; Bloom et al., 2010; Boudsocq et al., 2012).
Denitrifier method for NO−3 in natural plants
Natural abundance of stable isotopes in natural plants can integrate the information related to N sources and physiological processes (Högberg, 1997; Robinson, 2001; Craine et al., 2009). The stable isotopes include δ15N, δ18O, and δ17O for NO−3; 15N:14N, 18O:16O, and 17O:16O ratios expressed relative to atmospheric N2 and standardized mean ocean water (VSMOW), respectively (Coplen, 2011). These isotopes have been broadly used for studying plant N strategies and enzymatic dynamics in natural settings (Evans, 2001; Tcherkez and Farquhar, 2006; Granger et al., 2010). Nevertheless, it is difficult to measure the concentration and isotopes (δ15N and δ18O) of NO−3 in plant tissues precisely using traditional methods (Liu et al., 2012a). The use of the denitrifier method for measuring low (sub-nanomole) concentrations of NO−3 ([NO−3]) started during the mid-1980s (Lensi et al., 1985). The method has high sensitivity and is especially applicable for samples with low [NO−3] but with high dissolved organic carbon (DOC) (Christensen and Tiedje, 1988; Binnerup and Sørensen, 1992; Aakra et al., 2000). The denitrifier method developed for both δ15N and δ18O analysis is based on the isotopic analysis of nitrous oxide (N2O). The N2O is converted from sample NO−3 by cultured denitrifying bacteria (Pseudomonas aureofaciens; ATCC 13985) that lack N2O reductase activity (Sigman et al., 2001; Casciotti et al., 2002). The method was initially performed on seawater with 20–50 nmol NO−3. Since then, the application has been expanded widely to accommodate isotopic analysis of NO−3 in fresh water (e.g., groundwater, stream water, precipitation), soil and sediment water, soil extracts, as well as dissolved organic N (DON) in seawater and DON bound to diatoms as described by Koba et al. (2010a) and McIlvin and Casciotti (2011), respectively. This method has recently been used for measurements of NO−3 in natural plants and crops (Liu et al., 2012a, 2013a; Laursen et al., 2013; Bloom et al., 2014; Mihailova et al., 2014). The established protocol facilitates the Δ17O (Δ17O = [1 + δ17O] / [1 + δ18O]0.5247 − 1; Kaiser et al., 2007) analysis of leaf NO−3 to diagnose atmosphere-derived NO−3 in leaf uptake (Mukotaka, 2014).
The denitrifier method enables more precise measurements of subnanomole amounts of NO−3 (Binnerup and Sørensen, 1992; Højberg et al., 1994) as compared to traditional methods that use flow injection analysis, ion chromatography, high-performance liquid chromatography, and Kjeldahl distillation. Thus, the denitrifier method overcomes the difficulties in determining NO−3 in plant, soil, and sediment samples (Norwitz and Keliher, 1986; Anderson and Case, 1999; Alves et al., 2000). Moreover, it greatly simplifies the pretreatment procedures and reduces the risk of contamination during plant NO−3 isotopic analysis (see the old δ15N protocol in Volk et al., 1979 and Evans et al., 1996). The denitrifier method especially avoids the influence of DOC in plant extracts (Haberhauer and Blochberger, 1999) on the δ18O of NO−3 (Figure 1) that was previously measured as carbon monoxide with TC/EA-IRMS (Michalski, 2010).
Figure 1.
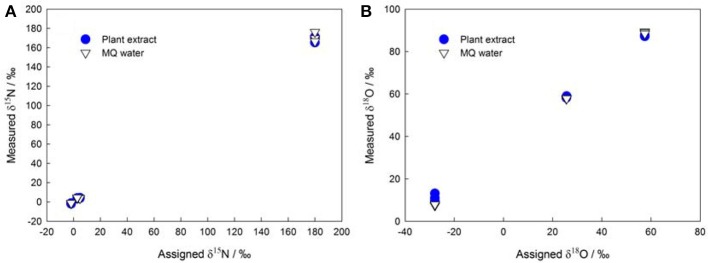
Assigned isotopic ratios (A: δ15N; B: δ18O) of NO−3 standards (IAEA NO3, USGS-32, USGS-34, and USGS-35) shown against corresponding isotope values measured in MQ (Millipore) water and in plant extracts (the initial NO−3 in plant extracts was removed using the same protocol as that described in Liu et al., 2012a).
Compared with NRA assays, concentrations and isotopic signatures of tissue NO−3 provide more authentic evidence related to NO−3 uptake and reduction under in situ N availability. In vitro and in vivo NRA measurements (Stewart et al., 1992, 1993) do not reflect the in situ ability of plant NO−3 reduction. This is because firstly, the added amount of NO−3 (often at the micromolar level) during NRA assays is uniform. Moreover it is much higher than normal NO−3 availability and the endogenous NO−3 in natural plants. The synthesis of the NR enzyme or the activation of NRA, however, is substrate-inducible (Beevers and Hageman, 1969; Somers et al., 1983; Campbell, 1999). Secondly, the reagents used in the assay can affect the estimation of NRA. Different analytical settings (e.g., with or without ethanol) can alter the fluxes of NO−3 and photosynthate, resulting in different estimations (Ferrari and Varner, 1970; Aslam, 1981). Thirdly, NRA might be altered by pH adjustment and vacuum infiltration during the NRA analysis. High DOC concentrations in the plant extract also easily destroy the precision of the colorimetric determination of NO−3 or nitrite (NO−2) (Alves et al., 2000).
Since natural isotope analysis does not require artificial N addition, it presents no risk of changing the soil N pools and plant N-uptake kinetics (Liu et al., 2012b). The natural abundance approach does not disturb the N pools in plants and provides information related to the NO−3 behavior in plant tissues based on isotopic compositions and fractionations. In fact, the field application of 15NO−3 tracer is advantageous in terms of the total and short-term incorporation of NO−3 into plants (e.g., McKane et al., 2002; Wanek and Zotz, 2011). However, the added tracer cannot bypass the influence of soil microbial activity, which can greatly change the picture of N uptake and preference over time (Harrison et al., 2007). Measurements of cytosolic and vacuolar NO−3 concentrations have been conducted to explore factors controlling uptake, intracellular transport and assimilation. However, related techniques such as compartmental radiotracer (e.g., 13N; Kronzucker et al., 1995), efflux analysis, nuclear magnetic resonance, cell fractionation, and NO−3-selective microelectrodes showed high cost and low field operability (Zhen et al., 1991; Miller and Smith, 1996). The calculated [NO−3] is especially sensitive to the small error of the estimation of cytosolic and vacuolar volumes, the precisions of which are difficult to ascertain.
Major sources and processes of NO−3 in natural plants
Root NO−3 uptake from the soil is achieved by active transportation (Wang et al., 2012). The extracellular NO−3 enters the cytosol of plant cells where it is either reduced by NR to NO−2 or stored in the vacuoles (Figure 2). The NO−2 will be transported into plastids (in root) or chloroplasts (in leaf) and reduced further by NiR to reduced N (Figure 2). Both NRA and NiRA are well known to be substrate-inducible, meaning that the de novo synthesis of the enzyme results from the presence and increase of the NO−3 in plants (Beevers and Hageman, 1969; Campbell, 1999). The induction of NRA by both soil and airborne NO−3 is an important mechanism to elucidate the interactions among NO−3 uptake, translocation/allocation, and reduction dynamics (Norby et al., 1989; Scheible et al., 1997a; Tischner, 2000).
Figure 2.
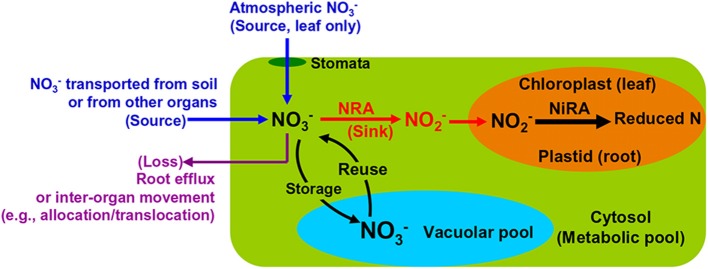
Schematic map showing major NO−3 sources and processes in leaves and roots of natural plants.
The NO−3 transported by the xylem flow, either directly from soil or partially processed by root NR, is the initial NO−3 reaching leaves and shoots (Peuke et al., 2013). This is especially true for plants growing at some pristine sites (e.g., arctic tundra) where the atmospheric NO−3 availability is negligible. However, in regions with substantial NO−3 deposition, both atmospheric NOx and NO−3 serve as potential sources of NO−3 in leaves (Wellburn, 1990; Raven and Yin, 1998; Sparks et al., 2001), especially for non-vascular plants such as mosses, which rely more on atmospheric nutrients (Liu et al., 2012c). Leaf NO−3 acquisition from the atmosphere is conducted through passive diffusion mechanisms wherein uptake through the stomata is dominant (Wellburn, 1990; Raven et al., 1992; Gessler et al., 2002) (Figure 2). The leaf-accessible NO−3 in the atmosphere includes an array of inorganic and organic ions and compounds (Wellburn, 1998; Teklemariam and Sparks, 2004; Vallano and Sparks, 2008). Although, previous tracer studies have described their incorporation into leaves (Hanson and Garten, 1992; Yoneyama et al., 2003; Lockwood et al., 2008), it is rather difficult to apply the natural abundance method for estimating field contributions of atmospheric NO−3. This can be attributed to the heterogeneity in chemical and deposition forms, and temporal and spatial distributions (Sievering et al., 2007; Sparks, 2009).
Concentration levels and implications of NO−3 in natural plants
Nitrate cannot be produced in photoautotrophic plants, except in a few legumes (Hipkin et al., 2004). The presence of NO−3 in any part of a plant constitutes evidence of NO−3 uptake by the plant and reflects that external NO−3 is available; and that the rate of uptake is higher than the rate of reduction. The NO−3 that is extractable from a plant organ is often a sum of the amounts from the extracellular pool, cytosolic pool, and vacuolar pool (Figure 2). These pool sizes and turnover rates are regulated by both environmental and physiological factors (Zhen et al., 1991; Miller and Smith, 1996), which determine the isotopic signatures of the extracted NO−3. Generally, the concentration level and distribution of NO−3 in vascular plants and the variations among species is a complex result of two important factors: external availability (previously often evaluated through NO−3 concentration and net nitrification rate in soil) and physiological strategies (mainly including uptake, translocation, and reduction dynamics). Moreover, the external factors also consider the availability of NO−3 relative to NH+4 or other N sources because it can influence both plant NO−3 uptake and assimilation (Boudsocq et al., 2012; Liu et al., 2012c; Britto and Kronzucker, 2013) while the physiological factors include the affinity of plants to different soil NO−3 levels (Wang et al., 2012; Kalcsits and Guy, 2013).
First, the distribution of organ-specific NO−3 concentrations among plants under different growing conditions (Figures 3, 4A) showed that plants growing in natural soils might also have a high NO−3 accumulation. In natural forests, leaf NO−3 concentrations of some species can be as high as 1000–10000 μ g-N g−1 dw (Figure 4A; Gebauer et al., 1988; Koyama et al., 2013), which was even higher than those of some crops (e.g., Bloom et al., 2014) and N-polluted natural plants (Figure 3). Plant NO−3 concentrations are indicators or predictors of the soil N cycle (e.g., soil nitrification and soil NO−3) and forest N pollution (Stams and Schipholt, 1990; Aber et al., 1998; Fenn and Poth, 1998; Koba et al., 2003). Such concentrations show higher sensitivities than bulk N and NRA parameters in revealing species-level responses to N enrichment (Fenn et al., 1996; Jones et al., 2008; Tang et al., 2012). The increase in NO−3 concentration in roots and or leaves with external NO−3 was observed under both natural soil conditions and experimental N addition (e.g., Stewart et al., 1993; Lexa and Cheeseman, 1997; Wang and Schjoerring, 2012). However, the level of leaf NO−3 and its response to soil NO−3 variation differ among species with distinct uptake or accumulation rates. For example, the NO−3 concentrations in plants (mostly as mosses) we recently investigated (Liu et al., 2012a,c, 2013a) were much lower than those reported by Gebauer et al. (1988) or Koyama et al. (2013) on vascular plants (Figure 4A) when compared within a similar soil [NO−3] range (e.g., 0–15 mg-N kg−1 soil, dw). Besides, the correlation between leaf NO−3 and soil NO−3 is apparent for plants with low NO−3 concentrations (Figure 4A). However, synthesis or extrapolation to different plants with distinct NO−3 accumulation abilities should be done carefully when evaluating soil N enrichment or N saturation.
Figure 3.
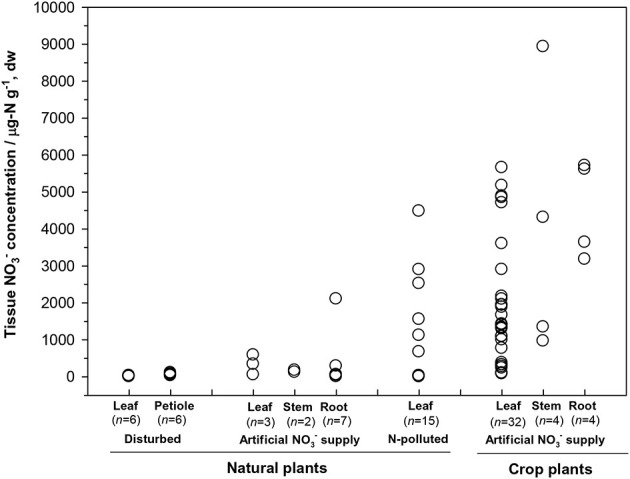
Tissue NO−3 concentrations in natural plants growing under disturbed conditions (acidic irrigation and liming; Gebauer et al., 1988), in N-polluted forest plants (Stams and Schipholt, 1990), in natural and crop plants with artificial NO−3 supply (data of natural plants were cited from Gebauer et al., 1984; Stadler and Gebauer, 1992; Robe et al., 1994; Simon et al., 2014. Data of crop plants were cited from Evans et al., 1996; Yoneyama and Tanaka, 1999; Prasad and Chetty, 2008 and references cited therein).
Figure 4.

(A) Relation between NO−3 concentrations in soil and natural plants. Plant NO−3 data in the left panel are shown for individual samples in Guiyang, southwestern China and western Tokyo, Japan reported by Liu et al. (2012a, 2013a). Plant NO−3 data in the right panel show organ-specific and whole-plant concentrations (averages of different species) in ecosystems of Central Europe (see details in Gebauer et al., 1988), and leaf NO−3 of different species (H. hirta, P. japonica, L. stellipilum, L. triloba) in a temperate forest of central Japan (Koyama et al., 2013). (B) Relations between total N, C/N, and tissue NO−3 concentration in natural plants. Mosses include different species in different habitats of Guiyang, Southwestern China, and Western Tokyo, Japan (cited from Liu et al., 2012a,c). Vascular leaves I, petioles and roots were reported for a coniferous and a broadleaved plant in western Tokyo, Japan (cited from Liu et al., 2013a). Vascular leaves II included fern, oak, and pine species at the Camp Paivika and Camp Osceola forest sites in the San Bernardino Mountains of southern California, USA (cited from Fenn et al., 1996).
Second, considerable differences (up to 4–5 orders) exist in the level of NO−3 among plant organs and species (Figures 3, 4A). The organ-specific patterns of NO−3 accumulation among coexisting plants can differ with soil N availability and the plant growing stage (Gebauer et al., 1984; Stewart et al., 1993; Liu et al., 2013a). However, this has complicated the use and selection of proper organs and species to evaluate ecosystem N availability based on tissue NO−3 analysis. McKane et al. (2002) used 15N tracers in the field to show that NO−3 uptake in the tundra plants did not passively follow external availability, but depended on specific ecophysiological traits. NO−3 preference in Carex was determined by the appearance of 15N tracer in Carex biomass, which showed that the NO−3 preference might reflect only the 15NO−3-acquiring efficiency associated with root traits, but not NO−3 assimilation given significantly lower NRA in Carex than in other species (Nadelhoffer et al., 1996). Therefore, additional studies should be conducted to determine the extent of organ-specific and species-specific variability of NO−3 concentration that reflects plant NO−3 strategy, and the heterogeneity of NO−3 available to roots. The available data for natural plants revealed a clear increase in NO−3 concentration with bulk N while a decrease with C/N (a clear turning at the C/N of 20–30) in different organs or tissue types (Figure 4B). Similarly, Zhen and Leigh (1990) reported that shoot NO−3 accumulated as a linear function of bulk N in wheat plants once a threshold N was exceeded. These results reflected the regulation of overall physiological N demand on the NO−3 utilization in natural plants (Imsande and Touraine, 1994). The regulation might be unidirectional because the contribution of NO−3 to bulk N assimilation appears to be much lower than that for other N forms in plants (portrayed in Figure 4B). The complexity of the mutual regulations behind the inverse relation between NO−3 and C/N might be comparable with the multi-scale inverse relation prevailing between NO−3 and organic C observed in different ecosystems (Taylor and Townsend, 2010). So far, little direct and simple evidence has been obtained for the driving mechanisms of C and N metabolism on NO−3 uptake, allocation, and accumulation in natural plants. A clearer relation is that even when external NO−3 is uniform, the NO−3 concentration is often higher in organs (especially for growing leaves) of species with higher NRA than in those with lower NRA (Gebauer et al., 1988; Cruz et al., 1991; Widmann et al., 1993; Min et al., 1998). Mutual induction between the maintenance of high NO−3 concentration and that of NR synthesis or NRA activation were elucidated in view of C metabolism and N demand in response to availability and growing conditions (Stewart et al., 1993; Scheible et al., 1997a,b; Scheurwater et al., 2002). The lower NO−3 concentration and NRA might be associated with lower N metabolism and demand in organs and plants with higher C/N and vice versa. Therefore, except regulation by soil NO−3 concentration, the uptake and distribution of NO−3 in a plant might follow the regime of organ-specific or whole-plant metabolic activities.
Other factors such as light and water regimes might also influence plant NO−3 accumulation through the pathway of photosynthetic regulation (Widmann et al., 1993; Simon et al., 2014). Cárdenas-Navarro et al. (1999) found concurrent and linearly correlated changes in whole-plant NO−3 and water content during the day–night cycle, reflecting a homoeostasis effect of endogenous NO−3 concentration. Besides, as discussed above, the heterogeneity of soil NO−3 available to roots of coexisting species should not be excluded considering the differences in root morphology and spatial distribution. Given the difficulties in determining rhizospheric soil NO−3 concentration and flux, it would be promising to measure NO−3 concentrations in roots to evaluate NO−3 availability to the whole plant or aboveground organs.
Isotopic systematics of NO−3 in plants
Stable isotopes of NO−3 in plants are controlled mainly by NO−3 sources and isotopic effects involved in NO−3 acquisition and reduction processes (Robinson et al., 1998; Comstock, 2001; Evans, 2001; Cernusak et al., 2009).
The δ15N of NO−3 in soil is reported mostly within −10 to +10‰ however, the δ15N of newly-produced NO−3 in soil is usually low because of strong isotopic effects of nitrification, on the other hand, the values can be elevated at sites with marked denitrification (Mariotti et al., 1981; Högberg, 1997; Koba et al., 1998, 2003, 2010b; Houlton et al., 2006; Takebayashi et al., 2010). Atmospheric NO−3 has a wider δ15N range (−15 – +15‰) because of its complex production pathways and sources (Heaton, 1990; Felix et al., 2012; Altieri et al., 2013). The δ15N of NO−3 is generally lower in wet than in dry deposition (Heaton et al., 1997; Elliott et al., 2009), but both often show a δ15N range overlapping with that of soil NO−3. The δ18O of initial NO−3 produced in soil is usually estimated using the δ18O of in situ H2O (normally −25 – 4‰) and atmospheric O2 (ca. 23.5‰) in a 2:1 ratio, assuming no exchange and fractionation of oxygen (O) isotopes occurs during nitrification and the NO−3 is produced solely through chemolithoautotrophic nitrification (Amberger and Schmidt, 1987). However, kinetic isotopic fractionation and O exchange between NO−2 and H2O often occur during nitrification, which can eliminate the isotopic signal of O2 effecting lower δ18O than the predicted values (Fang et al., 2012). The O of NO−3 in atmospheric deposition is derived mainly from O2 and O3, which have distinctly higher δ18O and Δ17O signatures than those of soil NO−3. In contrast to the overlapping δ15N for different NO−3 sources, δ18O and or Δ17O provide a clear separation between soil and atmospheric NO−3 sources. The δ18O of soil NO−3 produced by nitrification is distinctly lower (mean = −4.0‰ −7.3 to −0.9‰ Fang et al., 2012) than that of atmospheric NO−3 (60 − 100‰). The latter has high Δ17O values (around 25‰) in contrast to 0‰ of soil-derived NO−3 (Kendall et al., 2007; Michalski, 2010; Costa et al., 2011) (Figure 5).
Figure 5.
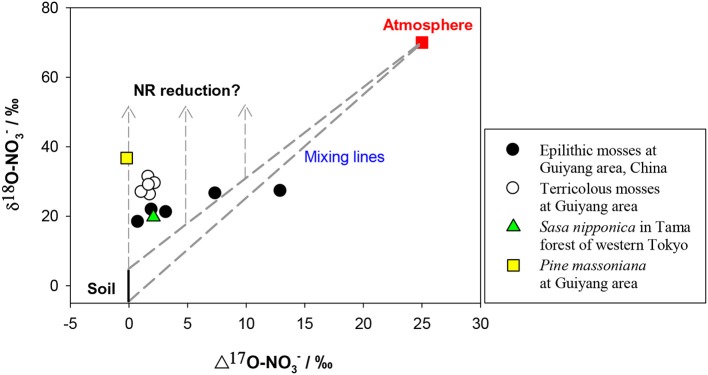
Preliminary relation between δ18O and Δ17O values of NO−3 in mosses and vascular plants. The δ18O and Δ17O values were considered respectively, as −5 to 5‰ and 0‰ for soil NO−3 (black and solid line), 70 and 25‰ for atmospheric NO−3 (red square). Dashed lines show the isotopic range of mixing between atmospheric and soil sources. Dashed lines with arrows show the vectors of δ18O enrichments because of NR reduction.
The process of NO−3 entry into root cells and subsequent transport processes within plants per se cause no isotope effect because of the lack of bond breakage. However, the acquisition of NO−3 through mycorrhizae to root cells potentially causes an isotopic difference between tissue NO−3 in roots and NO−3 in soil. Root NO−3 may be enriched in heavier isotopes relative to soil NO−3 if the NO−3 has experienced reduction during the N assimilation of mycorrhizae associated with the roots. Mycorrhizal fungi have substantial NO−3 reduction capacity (Ho and Trappe, 1975), but the fungal NR is present only in the presence of NO−3 and absence of NH+4 (Cove, 1966). So far, the isotopic effect of NO−3 acquisition through mycorrhizae on tissue NO−3 in natural plants has not been estimated or differentiated. Pate et al. (1993) demonstrated that the bulk δ15N differences between non-mycorrhizal and mycorrhizal species (with significant NO−3 storage and NRA) reflected the utilization of different N sources. There appears to be little or no isotopic discrimination within the plant during or subsequent to uptake of NO−3. Mycorrhizal fungi are expected to show higher bulk δ15N than available N sources [potentially including NO−3, NH+4, and DON (at least amino acids)] in soil and bulk N of host plants. However, the isotopic mechanism differed from that of tissue NO−3 and the isotope effect differed among mycorrhizal types (Högberg, 1997; Craine et al., 2009; Hobbie and Högberg, 2012). Högberg et al. (1999) showed that the ECM fungus had higher bulk δ15N relative to the Pinus sylvestris plant, and the fractionation against 15N was smaller when NO−3 was the source than when NH+4. It caused a marginal decrease in δ15N of the N passing from the substrate through the fungus to the host, which is explained by the small size of the fungal N pool relative to the total N of the plant, i.e., the high efficiency of transfer (Emmerton et al., 2001; Hobbie and Högberg, 2012). The significant shift in δ15N of fungal species was a function of fungal physiology; thus, it is difficult to constrain the N sources (using bulk δ15N) by mycorrhizal fungi or their plant partners in natural conditions (Emmerton et al., 2001).
The efflux of NO−3 from root to soil or the subsequent transport of NO−3 within plants is not expected to discriminate 15N as with the entry of soil NO−3 into root cells (Mariotti et al., 1982; Shearer et al., 1991). This can be attributed to that the diffusion of NO−3 through the membrane carriers of plant cells does not cause bonding breakage or consumption (Werner and Schmidt, 2002; Granger et al., 2004; Needoba et al., 2004). However, isotopic differences can occur between organs if partial NO−3 reduction occurs in roots before transportation. The transport of NR-processed NO−3 from roots to leaves might be misunderstood as isotopic fractionations of NO−3 transport or NO−3 reduction in shoots. So far, isotopic fractionations (ε = (lk/hk − 1) × 1000, where lk and hk respectively stand for the reaction rate constants for lighter and heavier isotopes) during the reduction of NO−3 by NR in leaves were reported as 15‰ for both N in spinach (Ledgard et al., 1985; Tcherkez and Farquhar, 2006) and O in wheat (Olleros-Izard, 1983) (Table 1). Direct measurement of endogenous NO−3 reduction in mosses after N deprivation showed similar values (Liu et al., 2012b) (Table 1). Although, NR isotopic fractionations have not been directly measured in roots, predictions can be made about the net enrichment of NO−3 isotopes in roots relative to those of soil NO−3 (Δroot; expressed as δroot − δsoil). These values should be either negligible if substantial NO−3 reduction did not occur (Scenario 1; Δroot = δroot − δsoil ≈ 0), or be close to the reported ε values of NRA in leaves (εNR) (0 − 27‰ Table 1) if NO−3 reduction occurred in the root (Scenario 2; Δroot = δroot − δsoil ≈ εNR > 0) (Figure 6). However, if the modification of soil NO−3 isotopes by soil microbial activities such as denitrification occurred later than root uptake, the observed isotopic values of root NO−3 can also be slightly lower than those of soil NO−3 despite reduction in roots (e.g., in the fine roots of a conifer investigated in Liu et al., 2013a). Furthermore, the variation of NO−3 isotopes with soil depth directly caused isotopic differences in initial NO−3 sources available to co-existing plants with different root depths. Therefore, considering this fact, soil reference samples should be collected corresponding to root distribution for characterizing the soil NO−3 isotopes available to specific plants.
Table 1.
Isotopic effects reported for NO−3 reduction (*) or net NO−3 assimilation in different biota.
| Biota | 15ε / ‰ | 18ε / ‰ | References |
|---|---|---|---|
| Eukaryotic NR enzymes (from fungus and marine diatoms) | 26.6* | 24.9* | Karsh et al., 2012 |
| Moss | 12.1* | 14.4* | Liu et al., 2012b |
| Strains of prokaryotic plankton | 0.4–8.6 | 0.9–8.1 | Granger et al., 2010 |
| Spinach and wheat | 15.0* | 15.0* | Olleros-Izard, 1983; Ledgard et al., 1985; Tcherkez and Farquhar, 2006 |
| Eukaryotic algae | 5.6–20.4 | 5.1–21.0 | Granger et al., 2004 |
| Marine phytoplankton | 2.7–15.2 | – | Needoba and Harrison, 2004 |
| 4–9 (field) 2.2–6.2 (lab) | – | Needoba et al., 2003 | |
| Tomato | 11.3–12.9 | – | Evans et al., 1996 |
| Leafy vegetable | 14.2–18.1 | – | Yoneyama and Kaneko, 1989; Yoneyama et al., 2003 |
| Grasses | 0.0–3.3 | – | Mariotti et al., 1982 |
| Pearl Millet and soybeans | 0.0-9.5 | – | Mariotti et al., 1980, 1982; Bergersen et al., 1988 |
| Red clover | 1.7–6.5 | – | Kohl and Shearer, 1980 |
Figure 6.

Schematic showing δ18O-NO−3 variations in plants under different uptake (from soil and or atmospheric sources: distinct in the δ18O value), translocation (from soil and or root to shoot), and reduction (potentially inducible by increasing [NO−3] or no reduction and no isotopic enrichment with NO−3 accumulation, depending on species). Long and short solid lines with arrows respectively show the vectors of δ18O-NO−3 and [NO−3] variations. Dashed lines with arrows show the uptake, transportation, and translocation of NO−3 from the soil to roots and or to leaves, from atmosphere to leaves, during which isotope effects were regarded as negligible. Shaded areas (gray for roots, green for leaves) show isotopic enrichment during the mixing of different sources (the δ18O-NO−3 in plants should be distributed between the δ18O values of sources, depending on the fraction of each source) and or the occurrence of NR reduction activities (the δ18O-NO−3 in plants would be higher than the δ18O of sources but the magnitude of enrichment depends on in situ NR dynamics; presumably less than that presented in Table 1). For scenarios that occurred, leaf uptake of atmospheric NO−3 was assumed to be homogeneous. The shaded area, the spatial distance, and length of lines had no quantitative implications. S1–S12 correspond to scenarios 1–12 in the main text. Briefly, S1, no occurrence of NO−3 reduction in roots; S2, (inducible) root NO−3 reduction; S3, no NO−3 was transported from soil to leaves and leaf NO−3 was derived from the atmosphere, but no reduction occurred; S4, no NO−3 was transported from soil to leaves and leaf NO−3 was from atmosphere and (inducible) reduction occurred; S5, leaf NO−3 was taken up directly from the soil, but no reduction occurred; S6, leaf NO−3 was taken up from the soil and reduction occurred therein; S7, leaf NO−3 is completely or partially transported from the root where it has experienced reduction, but no further reduction in the leaf; S8, leaf NO−3 is completely or partially transported from the root where it has experienced reduction, and is further reduced in the leaf; S9, leaf NO−3 was from both atmosphere and soil but no reduction occurred in the leaf; S10, leaf NO−3 was from both atmosphere and soil, and reduction occurred in the leaf; S11, leaf NO−3 is a mixture of atm-NO−3 and root NO−3 but no reduction occurred; S12, leaf NO−3 is a mixture of atm-NO−3 and root NO−3, and reduction occurred in the leaf; S13, leaf NO−3 is a mixture of soil NO−3, atm-NO−3, and root NO−3, but no reduction occurred in the leaf; S14, leaf NO−3 is a mixture of soil NO−3, atm-NO−3, and root NO−3, and reduction occurred in the leaf. The δ18O differences between S13 and S11, between S12 and S14 depend on the fraction of soil NO−3 in the mixed pool of leaves.
In a closed system, isotopic enrichment occurs with the enzymatic consumption of substrate NO−3 and εNR is expressed as Δ/ln[NO−3]remaining fitted to the Rayleigh isotope fractionation model, where Δ represents the isotopic difference of remaining NO−3 from the initial NO−3 (δremaining − δinitial) (e.g., Granger et al., 2004, 2010). Isotopic enrichment also takes place for NO−3 remaining in plants after deprivation of NO−3 or N supply, because the tissue NO−3 pool is only changed by the NRA in a closed system (e.g., Liu et al., 2012b). Thus far, no experimental work has been done to explain the variability of 18εNR in and among vascular plants. In NO−3-supply studies, shoots tend to have higher δ15N values because of the allocation of root NR-processed NO−3 from roots to shoots (Kalcsits and Guy, 2013) or significantly higher 15εNR (by 3.3–6.9‰) than roots (Yoneyama and Kaneko, 1989; Evans et al., 1996; Yoneyama et al., 2001). Evidence from marine biota showed that both 15εNR and 18εNR can vary with growing conditions and that significantly different ε values exist among species (Table 1). In field conditions, NO−3 in an organ is more likely to be an open system with continuous source inputs (uptake), sinks (reduction), and outputs (translocation) (Figure 2). The uptake and allocation often occur according to the reduction ability and the distribution of NR, for example, a higher concentration and more NR are likely to exist in growing leaves (Gebauer et al., 1988; Cruz et al., 1991; Widmann et al., 1993). Passive or high accumulation as in mosses (Liu et al., 2012c) can happen in some organs such as conifer roots that are unable to reduce it (Liu et al., 2013a). Therefore, δ values of tissue NO−3 might not always follow the normal “Rayleigh type” relation, instead might increase with the increase in tissue [NO−3] or show a non-significant correlation with [NO−3] in the tissues (Liu et al., 2012c, 2013a). In fact, experimental studies have also shown the interplay of plant NO−3 uptake and reduction activity. The 15N discrimination during NO−3 assimilation in several higher plants was positively correlated with the supplied and tissue NO−3 concentrations, and negatively correlated with plant age (Kohl and Shearer, 1980; Mariotti et al., 1980, 1982; Bergersen et al., 1988; Liu et al., 2013a). Accordingly, the Rayleigh relation between NO−3 and its isotopes is not always applicable to examine εNR values and NO−3 reduction in organs of natural plants.
For some plants, NO−3 is not available in soil substrates. It can only be acquired from deposition (e.g., non-vascular plants or epiphytes). Alternatively, it is not available in deposition but can only be taken up from the soil (e.g., plants growing in arctic pristine ecosystems with negligible NO−3 deposition). In these plants, it is also feasible to diagnose leaf NO−3 reduction using Δleaf (the net enrichment of NO−3 isotopes in leaves relative to those of source NO−3) (Scenarios 3–6; Figure 6).
Scenario 3: If no NO−3 was transported from soil to leaves, and leaf NO−3 if any, was completely derived from atmosphere, but no reduction occurred, then:
Scenario 4: If no NO−3 was transported from soil to leaves and leaf NO−3 was acquired from atmosphere; and reduction occurred, then:
Scenario 5: If all leaf NO−3 was taken up directly from the soil and no reduction occurred in roots or leaves, then:
Scenario 6: If leaf NO−3 was transported completely from the soil and reduction occurred only in the leaves, then
The induction of NR by atmospheric-derived NO−3 has been shown in plants exposed to airborne N oxides (e.g., Norby et al., 1989; Wellburn, 1990). Scenarios 3–4 are expected to be true for mosses because atmospheric NO−3 has been assumed as the sole source (Liu et al., 2012a). Nevertheless, isotopic partitioning of N sources (Liu et al., 2013b) and further Δ17O analysis (Figure 5) suggests that moss NO−3, even at epilithic habitats, is actually a mixture of atmospheric NO−3 and soil-derived NO−3. Thus, it is becoming clear that mosses can acquire substantial N from substrates; and moss NO−3 is a valid atmospheric bio-monitor only for species growing on rare N-free substrates. Scenarios 5–6 demonstrated NO−3 dynamics of vascular plants in the tundra of northern Alaska, where the Δ17O of NO−3 in plants with surprisingly high [NO−3] was found as 0‰ (e.g., Polygonum bistorta). However, examining only Δleaf seems insufficient to determine NO−3 reduction location, since, isotopic enrichments of leaf NO−3 might result from root reduction activities before moving up to leaves (Scenario 7).
Scenario 7: If the leaf NO−3 is completely or partly transported from the root where it has experienced reduction, but no reduction has occurred in the leaf; then an isotope mass-balance calculation can be conducted to quantify the amount of leaf NO−3 accumulated directly from soil and indirectly from roots:
The reduction of NO−3 that has experienced reduction in roots can further increase the isotopic enrichment of leaf NO−3 relative to soil NO−3 (Scenario 8) (Figure 6). This has been demonstrated by the δ15N difference between roots and leaves in plants growing with NO−3 with known δ15N values (Yoneyama and Kaneko, 1989; Evans et al., 1996; Yoneyama et al., 2001). This NO3 reduction occurs especially in plants that are capable of reducing NO−3 in both shoots and roots (Stewart et al., 1992).
Scenario 8: If the leaf NO−3 is completely or partially transported from roots where it has experienced reduction; and if it is further reduced in the leaf. In this case, a partitioning similar to scenario 7 can be done by considering the Δleaf in the isotope mass-balance calculation:
Plant NO−3 in scenarios 1–8 was derived either from the soil or atmosphere (Figure 6). A supplemental diagnosis of NR dynamics was to examine the covariance of Δδ18O:Δδ15N ratios (Δ is the isotopic enrichment of plant NO−3 relative to source NO−3; Δ = δplant − δsource). This diagnosis helped determine whether the N–O bond breakage attributable to NO−3 reduction was the single process driving NO−3 15N and 18O enrichments. Theoretically, the dissociation of an O atom from NO−3 predicted that NO−3 isotopes would be fractionated in an O-to-N ratio of ca. 0.6 (Brown and Drury, 1967). However, the NR often had the same O-to-N isotopic imprint on substrate NO−3 in experimental studies. Consequently, the 1:1 trend was considered ubiquitous for biological NO−3 reduction (Granger et al., 2004, 2010). However, for leaves of vascular plants that acquire NO−3 from both atmosphere and soil, it is difficult to constrain leaf NO−3 reduction based only on the Δleaf (δleaf − δsource) and εNR, because the mixing of atmospheric NO−3 can raise the δ values (especially δ18O). Liu et al. (2013a) observed that the δ18O:δ15N ratios in roots of a conifer generally followed the 1:1 rule; although leaf NO−3 showed distinctly higher δ18O:δ15N ratios (2.5:1) because of the mixing of atmospheric NO−3.
As described above, the fraction of atmospheric-derived NO−3 (Fatm) in leaves can be estimated using Δ17O mass-balance calculation (Fatm = Δ17Oleaf / Δ17Oatm < 1). Thereafter, the leaf NO−3 sources and NR dynamics can be further constrained.
Scenario 9: If leaf NO−3 was absorbed from both the atmosphere and soil, but no reduction occurred in the leaf, then the fraction of atmospheric-derived NO−3 calculated using δ18O or δ15N (fatm) is expected to be similar to Fatm, as
Scenario 10: If leaf NO−3 was absorbed from both the atmosphere and soil, and reduction occurred in the leaf, then:
Scenario 11: If leaf NO−3 is a mixture of atm-NO−3 and root NO−3, but no reduction occurred, then:
Scenario 12: If leaf NO−3 is a mixture of atm-NO−3 and root NO−3; and if the reduction occurred in the leaf, then:
Scenario 13: If leaf NO−3 is a mixture of soil NO−3, atm-NO−3, and root NO−3, but no reduction occurred in the leaf, then:
Scenario 14: If leaf NO−3 is a mixture of soil NO−3, atm-NO−3, and root NO−3, and if reduction occurred in the leaf, then:
The parameters in the scenarios 9–14 (fatm, Fatm, Δroot, Δleaf) above, provide theoretical constraints on possible NO−3 sources and reduction dynamics in leaves of field plants. As explained above, δ15N values of NO−3 often overlapped for soil and atmospheric sources, although δ18O and or Δ17O can provide a clear differentiation between them (Kendall et al., 2007; Michalski, 2010). Consequently, the scenarios above are better suited to the δ18O (depicted in Figure 6) than δ15N analysis, particularly when leaf NO−3 was a mixing pool for different sources. The other solution to diagnose atmospheric NO−3 mixing and reduction is the Δ17O-δ18O correlation, which has been used to trace NO−3 sources and dynamics in aquatic environments (Tsunogai et al., 2011). Although preliminary, the Δ17O values in mosses showed clearly higher Fatm than vascular plants, especially in epilithic mosses. Although, the Δ17O in terricolous mosses and vascular leaf samples was as low as 0.0–2.2‰, even at high NO−3 concentration levels (Figure 5), suggesting a 0.0–8.8% of atmospheric contribution to leaf NO−3 pool. The NRA should be responsible for δ18O enrichment relative to the mixing values if plant-absorbed NO−3 has not been influenced by denitrification in soil. Such characterization cannot be warranted by correlation between δ15N and δ18O, or between tissue [NO−3] and isotopes (e.g., Liu et al., 2012c).
Uncertainties in tissue NO−3-isotope methods and future works
Although, the sampling time of plant materials can be controlled, diurnal and seasonal variations in tissue NO−3 and its isotopes should be verified in future works. Until now, no experimental work has directly examined NR enzymatic isotope kinetics in roots and leaves of higher plants. Moreover, it is difficult to mimic in situ NR isotope effects in field conditions. Isotope effects associated with NO−3 uptake and efflux remain unverified for roots. They were measured recently as 1–3‰ in growing cells of marine diatoms, and different O and N fractionations for both uptake and efflux were thought to cause the net 18ε:15ε of NO−3 assimilation above 1 (Karsh et al., 2014). The routes of transformation and entry of inorganic and organic NO−3 sources from the atmosphere into leaf cells and subsequent cellular actions have not been clarified, especially for non-aqueous processes. Consequently, the sources and supply rates of atmospheric NO−3 and their isotope signals should be explored further. Thus far, the Δ17O information of leaf NO−3 was sparse, and is mostly available for leaves with high NO−3 levels. It should be verified whether the atmospheric contribution is higher in low-[NO−3] leaves or not. It is promising to measure NO−3 isotopes in xylem flow and twig samples for NO−3 transportation and translocation. Results of such studies can potentially provide useful insights into intraplant NO−3 transportation and translocation, although the sampling methods of xylem flow are mostly destructive and in-twig NO−3 might be very low. For these reasons, more field works on tissue NO−3 at the organ, stand, and species levels should be done along with source isotope analysis. The scenarios proposed above provide the first conceptual constraint for both sources and NO−3 isotope effects in field plants. In conclusion, the concentration and isotopic analyses of NO−3 in plant tissues together provide new insights for elucidating plant NO−3 sources and strategies. These strategies will be valuable for exploring the communication of plant N utilization with environmental N pollution and altering ecosystem N cycles.
Conflict of interest statement
The authors declare that the research was conducted in the absence of any commercial or financial relationships that could be construed as a potential conflict of interest.
Acknowledgments
This work was supported by a Grant for Projects for the Protection, Preservation and Restoration of Cultural Properties in Japan by the Sumitomo Foundation, Grants-in-Aid for Creative Scientific Research (Nos. 21310008), the Program to Create an Independent Research Environment for Young Researchers from the Ministry of Education, Culture, Sports, Science and Technology, Japan, the NEXT Program (GS008) from the Japan Society for the Promotion of Science (JSPS), and JSPS KAKENHI Grant Number 26252020. Xue-Yan Liu was also supported by the National Natural Science Foundation of China (No. 41021062, 41273026) and the JSPS postdoctoral program for foreign researchers (No. 09F09316). We appreciate Drs. Muenoki Yoh, Lina Koyama, and Arata Mukotaka for the fruitful discussions.
References
- Aakra Å., Hesselsøe M., Bakken L. R. (2000). Surface attachment of ammonia-oxidizing bacteria in soil. Microbial. Ecol. 39, 222–235 10.1007/s002480000006 [DOI] [PubMed] [Google Scholar]
- Aber J., McDowell W., Nadelhoffer K., Magill A., Berntson G., Kamakea M., et al. (1998). Nitrogen saturation in temperate forest ecosystems: hypotheses revisited. Bioscience 48, 921–934 10.2307/1313296 [DOI] [Google Scholar]
- Altieri K., Hastings M., Gobel A., Peters A., Sigman D. (2013). Isotopic composition of rainwater nitrate at Bermuda: the influence of air mass source and chemistry in the marine boundary layer. J. Geophys. Res. Atmos. 118, 304–311 10.1002/jgrd.50829 [DOI] [Google Scholar]
- Alves B. J. R., Zotarelli L., Resende A. S., Polidoro J. C., Urquiaga S., Boddey R. M. (2000). Rapid and sensitive determination of nitrate in plant tissue using flow injection analysis. Commun. Soil Sci. Plant Anal. 31, 2739–2750 10.1080/00103620009370623 [DOI] [Google Scholar]
- Amberger A., Schmidt H.-L. (1987). Natiirliche Isotopengehalte yon Nitrat als Indikatoren fiir dessen Herkunft. Geochim. Cosmochim. Acta. 51, 2699–2705 10.1016/0016-7037(87)90150-5 [DOI] [Google Scholar]
- Anderson K. A., Case T. E. (1999). Evaluation of plant nitrate extraction techniques and effect on commonly used analytical methods of detection. Commun. Soil. Sci. Plant Anal. 30, 1479–1495 10.1080/00103629909370301 [DOI] [Google Scholar]
- Aslam M. (1981). Reevaluation of anaerobic nitrite production as an index for the measurement of metabolic pool of nitrate. Plant Physiol. 68, 305–308 10.1104/pp.68.2.305 [DOI] [PMC free article] [PubMed] [Google Scholar]
- Atkin O. K., Villar R., Cummings W. R. (1993). The ability of several high arctic plant species to use nitrate nitrogen under field conditions. Oecologia 96, 239–245 10.1007/BF00317737 [DOI] [PubMed] [Google Scholar]
- Beevers L., Hageman R. H. (1969). Nitrate reduction in higher plants. Annu. Rev. Plant Physiol. 20, 495–522 10.1146/annurev.pp.20.060169.002431 [DOI] [Google Scholar]
- Bergersen F. J., Peoples M. B., Turner G. L. (1988). Isotopic discriminations during the accumulation of nitrogen by soybeans. Aust. J. Plant Physiol. 15, 407–420 10.1071/PP9880407 [DOI] [Google Scholar]
- Binnerup S. J., Sørensen J. (1992). Nitrate and nitrite microgradients in barley rhizosphere as detected using a highly sensitive denitrification bioassay. Appl. Environ. Microb. 58, 2375–2380 [DOI] [PMC free article] [PubMed] [Google Scholar]
- Bloom A. J., Burger M., Asensio J. S. R., Cousins A. B. (2010). Carbon dioxide enrichment inhibits nitrate assimilation in wheat and Arabidopsis. Science 328, 899–903 10.1126/science.1186440 [DOI] [PubMed] [Google Scholar]
- Bloom A. J., Burger M., Kimball B. A., Pinter P. J., Jr. (2014). Nitrate assimilation is inhibited by elevated CO_2 in field-grown wheat. Nat. Clim. Change 4, 477–480 10.1038/nclimate2183 [DOI] [Google Scholar]
- Boudsocq S., Niboyet A., Lata J. C., Raynaud X., Loeuille N., Mathieu J., et al. (2012). Plant preference for ammonium versus nitrate: a neglected determinant of ecosystem functioning? Am. Nat. 180, 60–69 10.1086/665997 [DOI] [PubMed] [Google Scholar]
- Britto D. T., Kronzucker H. J. (2013). Ecological significance and complexity of N-source preference in plants. Ann. Bot. 112, 957–963 10.1093/aob/mct157 [DOI] [PMC free article] [PubMed] [Google Scholar]
- Brown L. L., Drury J. S. (1967). Nitrogen-isotope effects in the reduction of nitrate, nitrite, and hydroxylamine to ammonia. I In sodium hydroxide solution with Fe(II). J. Chem. Phys. 46, 2833–2837 10.1063/1.1841123 [DOI] [Google Scholar]
- Campbell W. H. (1999). Nitrate reductase structure, function and regulation: bridging the gap between biochemistry and physiology. Annu. Rev. Plant Physiol. 50, 277–303 10.1146/annurev.arplant.50.1.277 [DOI] [PubMed] [Google Scholar]
- Cárdenas-Navarro R., Adamowicz S., Robin P. (1999). Nitrate accumulation in plants: a role for water. J. Exp. Bot. 50, 613–624 10.1093/jxb/50.334.613 [DOI] [Google Scholar]
- Casciotti K. L., Sigman D. M., Hasting G. M., Böhlke J. K., Hilkert A. (2002). Measurement of the oxygen isotopic composition of nitrate in seawater and freshwater using the denitrifier method. Anal. Chem. 74, 4905–4912 10.1021/ac020113w [DOI] [PubMed] [Google Scholar]
- Cernusak L. A., Winter K., Turner B. L. (2009). Plant δ 15N correlates with the transpiration efficiency of nitrogen acquisition in tropical trees. Plant Physiol. 151, 1667–1676 10.1104/pp.109.145870 [DOI] [PMC free article] [PubMed] [Google Scholar]
- Chapin F. S., III. (1980). The mineral nutrition of wild plants. Annu. Rev. Ecol. Syst. 11, 233–260 10.1146/annurev.es.11.110180.001313 [DOI] [Google Scholar]
- Chapin F. S., III., Moilanen L., Kielland K. (1993). Preferential use of organic nitrogen for growth by a non-mycorrhizal arctic sedge. Nature 361, 150–153 10.1038/361150a0 [DOI] [Google Scholar]
- Christensen S., Tiedje J. M. (1988). Sub-parts-per-billion nitrate methods: use of an N_2O-producing denitrifier to convert NO_3− or 15NO−3 to N_2O. Appl. Environ. Microbiol. 54, 1409–1413 Available online at: http://aem.asm.org/content/54/6/1409.abstract [DOI] [PMC free article] [PubMed] [Google Scholar]
- Comstock J. (2001). Steady-state isotopic fractionation in branched pathways using plant uptake of NO−3 as an example. Planta 214, 220–234 10.1007/s004250100602 [DOI] [PubMed] [Google Scholar]
- Coplen T. B. (2011). Guidelines and recommended terms for expression of stable-isotope-ratio and gas-ratio measurement results. Rapid. Commun. Mass Spectrom. 25, 2538–2560 10.1002/rcm.5129 [DOI] [PubMed] [Google Scholar]
- Costa A. W., Michalski G., Alexander B., Shepson P. B. (2011). Analysis of atmospheric inputs of nitrate to a temperate forest ecosystem from Δ 17O isotope ratio measurements. Geophys. Res. Lett. 38, L15805 10.1029/2011GL047539 [DOI] [Google Scholar]
- Cove D. J. (1966). The induction and repression of nitrate reductase in the fungus Aspergillus nidulans. Biochim. Biophys. Acta. 113, 51–56 10.1016/S0926-6593(66)80120-0 [DOI] [PubMed] [Google Scholar]
- Craine J. M., Elmore A. J., Aidar M. P. M., Bustamante M., Dawson T. E., Hobbie E. A., et al. (2009). Global patterns of foliar nitrogen isotopes and their relationships with climate, mycorrhizal fungi, foliar nutrient concentrations, and nitrogen availability. New Phytol. 183, 980–992 10.1111/j.1469-8137.2009.02917.x [DOI] [PubMed] [Google Scholar]
- Crawford N. M. (1995). Nitrate: Nutrient and signal for plant growth. Plant Cell 7, 859–868 10.1105/tpc.7.7.859 [DOI] [PMC free article] [PubMed] [Google Scholar]
- Cruz C. M., Soares M. I. M., Martins-Loução M. A., Lips S. H. (1991). Nitrate reduction in seedlings of carob (Ceratonia siliqua L.). New Phytol. 119, 413–419 10.1111/j.1469-8137.1991.tb00041.x [DOI] [Google Scholar]
- Elliott E. M., Kendall C., Boyer E. W., Burns D. A., Lear G., Golden H. E., et al. (2009). Dual nitrate isotopes in actively and passively collected dry deposition: utility for partitioning NOx sources contributing to landscape nitrogen deposition. J. Geophys. Res. Biogeosci. 114:G04020 10.1029/2008JG000889 [DOI] [Google Scholar]
- Emmerton K. S., Callaghan T. V., Jones H. E., Leake J. R., Michelsen A., Read D. J. (2001). Assimilation and isotopic fractionation of nitrogen by mycorrhizal fungi. New Phytol. 151, 503–511 10.1046/j.1469-8137.2001.00178.x15446705 [DOI] [Google Scholar]
- Evans R. D. (2001). Physiological mechanisms influencing plant nitrogen isotope composition. Trends Plant Sci. 6, 121–126 10.1016/S1360-1385(01)01889-1 [DOI] [PubMed] [Google Scholar]
- Evans R. D., Bloom A. J., Sukrapanna S. S., Ehleringer J. R. (1996). Nitrogen isotope composition of tomato (Lycopersicon esculentum Mill. cv. T-5) grown under ammonium or nitrate nutrition. Plant Cell Environ. 19, 1317–1323 10.1111/j.1365-3040.1996.tb00010.x [DOI] [Google Scholar]
- Fang Y. T., Koba K., Makabe A., Zhu F. F., Fan S. Y., Liu X. Y., et al. (2012). Low δ 18O values of nitrate produced from nitrification in temperate forest soils. Environ. Sci. Technol. 46, 8723–8730 10.1021/es300510r [DOI] [PubMed] [Google Scholar]
- Felix J. D., Elliott E. M., Shaw S. (2012). The nitrogen isotopic composition of coal-fired power plant NOx: the influence of emission controls and implications for global emission inventories. Environ. Sci. Technol. 46, 3528–3535 10.1021/es203355v [DOI] [PubMed] [Google Scholar]
- Fenn M. E., Poth M. A. (1998). Indicators of nitrogen status in California forests, in Proceedings of the International Symposium on Air Pollution and Climate Change Effects on Forest Ecosystems, eds Bytnerowicz A., Arbaugh M., Schilling S. (Riverside, CA: GTR-166; ). [Google Scholar]
- Fenn M. E., Poth M. A., Johnson D. W. (1996). Evidence for nitrogen saturation in the San Bernardino Mountains in southern California. For. Ecol. Manage. 82, 211–230 10.1016/0378-1127(95)03668-712805811 [DOI] [Google Scholar]
- Ferrari T. E., Varner J. E. (1970). Control of nitrate reductase activity in barley aleurone layers. Proc. Natl. Acad. Sci. U.S.A. 65, 3, 729–736 10.1073/pnas.65.3.729 [DOI] [PMC free article] [PubMed] [Google Scholar]
- Gebauer G., Melzer A., Rehder H. (1984). Nitrate content in Rumex obtusifolius L. I. Differences in organs and diurnal changes. Oecologia 63, 136–142 10.1007/BF00379795 [DOI] [PubMed] [Google Scholar]
- Gebauer G., Rehder H., Wollenweber B. (1988). Nitrate, nitrate reduction and organic nitrogen in plants from different ecological and taxonomic groups of Central Europe. Oecologia 75, 371–385 10.1007/BF00376940 [DOI] [PubMed] [Google Scholar]
- Gessler A., Rienks M., Rennenberg H. (2002). Stomatal uptake and cuticular adsorption contribute to dry deposition of NH3 and NO2 to needles of adult spruce (Picea abies) trees. New Phytol. 156, 179–194 10.1046/j.1469-8137.2002.00509.x [DOI] [PubMed] [Google Scholar]
- Granger J., Sigman D. M., Needoba J. A., Harrison P. J. (2004). Coupled nitrogen and oxygen isotope fractionation of nitrate during assimilation by cultures of marine phytoplankton. Limnol. Oceanogr. 49, 1763–1773 10.4319/lo.2004.49.5.176322534036 [DOI] [Google Scholar]
- Granger J., Sigman D. M., Rohde M. M., Maldonado M. T., Tortell P. D. (2010). N and O isotope effects during nitrate assimilation by unicellular prokaryotic and eukaryotic plankton cultures. Geochim. Cosmochim. Acta 74, 1030–1040 10.1016/j.gca.2009.10.044 [DOI] [Google Scholar]
- Haberhauer G., Blochberger K. (1999). A simple cleanup method for the isolation of nitrate from natural water samples for O isotope analysis. Anal. Chem. 71, 3587–3590 10.1021/ac9814243 [DOI] [PubMed] [Google Scholar]
- Hanson P. J., Garten C. T. (1992). Deposition of H15NO3 vapour to white oak, red maple and loblolly pine foliage: experimental observations and a generalized model. New Phytol. 122, 329–337 10.1111/j.1469-8137.1992.tb04238.x [DOI] [PubMed] [Google Scholar]
- Harrison K. A., Bol R., Bardgett R. D. (2007). Preferences for different nitrogen forms by coexisting plant species and soil microbes. Ecology 88, 989–999 10.1890/06-1018 [DOI] [PubMed] [Google Scholar]
- Heaton T. H. E. (1990). 15N/14N ratios of NOx from vehicle engines and coal-fired power stations. Tellus 42, 304–307 10.1034/j.1600-0889.1990.00007.x-i1 [DOI] [Google Scholar]
- Heaton T. H. E., Spiro B., Roberston S. M. C. (1997). Potential canopy influences on the isotopic composition of nitrogen and sulphur in atmospheric deposition. Oecologia 109, 600–660 10.1007/s004420050122 [DOI] [PubMed] [Google Scholar]
- Hill P. W., Marsden K. A., Jones D. L. (2013). How significant to plant N nutrition is the direct consumption of soil microbes by roots? New Phytol. 199, 948–955 10.1111/nph.12320 [DOI] [PMC free article] [PubMed] [Google Scholar]
- Hipkin C. R., Simpson D. J., Wainwright S. J., Salem M. A. (2004). Nitrification by plants that also fix nitrogen. Nature 430, 98–101 10.1038/nature02635 [DOI] [PubMed] [Google Scholar]
- Ho I., Trappe J. M. (1975). Nitrate reducing capacity of two vesicular-arbuscular mycorrhizal fungi. Mycologia 67, 886–888 10.2307/3758349 [DOI] [PubMed] [Google Scholar]
- Hobbie E. A., Högberg P. (2012). Nitrogen isotopes link mycorrhizal fungi and plants to nitrogen dynamics. New Phytol. 196, 367–382 10.1111/j.1469-8137.2012.04300.x [DOI] [PubMed] [Google Scholar]
- Högberg P. (1997). 15N natural abundance in soil-plant systems. New Phytol. 137, 179–203 10.1046/j.1469-8137.1997.00808.x [DOI] [PubMed] [Google Scholar]
- Högberg P., Högberg M. N., Quist M. E., Ekblad A., Näsholm T. (1999). Nitrogen isotope fractionation during nitrogen uptake by ectomycorrhizal and non-mycorrhizal Pinus sylvestris. New Phytol. 142, 569–576 10.1046/j.1469-8137.1999.00404.x [DOI] [Google Scholar]
- Højberg O., Johansen H. S., Sørensen J. (1994). Determination of 15N abundance in nanogram pools of NO−3 and NO−2 by denitrification bioassay and mass spectrometry. Appl. Environ. Microb. 60, 2467–2472 [DOI] [PMC free article] [PubMed] [Google Scholar]
- Houlton B., Sigman D., Hedin L. (2006). Isotopic evidence for large gaseous nitrogen losses from tropical rainforests. Proc. Natl. Acad. Sci. U.S.A. 103, 8745–8750 10.1073/pnas.0510185103 [DOI] [PMC free article] [PubMed] [Google Scholar]
- Imsande J., Touraine B. (1994). N demand and the regulation of nitrate uptake. Plant Physiol. 105, 3–7 [DOI] [PMC free article] [PubMed] [Google Scholar]
- Jones M. E., Paine T. D., Fenn M. E. (2008). The effect of nitrogen additions on oak foliage and herbivore communities at sites with high and low atmospheric pollution. Environ. Pollut. 151, 434–442 10.1016/j.envpol.2007.04.020 [DOI] [PubMed] [Google Scholar]
- Kaiser J., Hastings M. G., Houlton B. Z., Rockmann T., Sigman D. M. (2007). Triple oxygen isotope analysis of nitrate using the denitrifier method and thermal decomposition of N2O. Anal. Chem. 79, 599–607 10.1021/ac061022s [DOI] [PubMed] [Google Scholar]
- Kalcsits L. A., Guy R. D. (2013). Whole-plant and organ-level nitrogen isotope discrimination indicates modification of partitioning of assimilation, fluxes and allocation of nitrogen in knockout lines of Arabidopsis thaliana. Phys. Plant. 149, 249–259 10.1111/ppl.12038 [DOI] [PubMed] [Google Scholar]
- Karsh K. L., Granger J., Kritee K., Sigman D. M. (2012). Eukaryotic assimilatory nitrate reductase fractionates N and O isotopes with a ratio near unity. Environ. Sci. Technol. 46, 5727-5735 10.1021/es204593q [DOI] [PubMed] [Google Scholar]
- Karsh K. L., Trull T. W., Sigman D. M., Thompson P. A., Granger J. (2014). The contributions of nitrate uptake and efflux to isotope fractionation during algal nitrate assimilation. Geochim. Cosmochim. Acta 132, 391-412 10.1016/j.gca.2013.09.030 [DOI] [Google Scholar]
- Kendall C., Elliott E. M., Wankel S. D. (2007). Tracing anthropogenic inputs of nitrogen to ecosystems, in Stable Isotopes in Ecology and Environmental Science, 2nd Edn., eds Michener R. M., Lajtha K. (Oxford: Blackwell; Oxford Press; ), 375–449 10.1002/9780470691854.ch12 [DOI] [Google Scholar]
- Koba K., Hirobe M., Koyama L., Kohzu A., Tokuchi N., Nadelhoffer K., et al. (2003). Natural N-15 abundance of plants and soil N in a temperate coniferous forest. Ecosystems 6, 457–469 10.1007/s10021-002-0132-6 [DOI] [Google Scholar]
- Koba K., Inagaki K., Sasaki Y., Takebayashi Y., Yoh M. (2010a). Nitrogen isotopic analysis of dissolved inorganic and organic nitrogen in soil extracts, in Earth, Life and Isotopes, eds Ohkouchi N., Tayasu I., Koba K. (Kyoto: Kyoto University Press; ), 17–37 [Google Scholar]
- Koba K., Isobe K., Takebayashi Y., Fang Y. T., Sasaki Y., Saito W., et al. (2010b). δ 15N of soil N and plants in a N-saturated, subtropical forest of southern China. Rapid Commun. Mass Spectrom. 24, 2499–2506 10.1002/rcm.4648 [DOI] [PubMed] [Google Scholar]
- Koba K., Tokuchi N., Yoshioka T., Hobbie E., Iwatsubo G. (1998). Natural abundance of nitrogen-15 in a forest soil. Soil Sci. Soc. Amer. J. 62, 778–781 10.2136/sssaj1998.03615995006200030034x24085637 [DOI] [Google Scholar]
- Kohl D. H., Shearer G. (1980). Isotopic fractionation associated with symbiotic N2 fixation and uptake of NO−3 by plants. Plant Physiol. 66, 51–56 10.1104/pp.66.1.51 [DOI] [PMC free article] [PubMed] [Google Scholar]
- Koyama L., Hirobe M., Koba K., Tokuchi N. (2013). Nitrate-use traits of understory plants as potential regulators of vegetation distribution on a slope in a Japanese cedar plantation. Plant Soil 362, 119–134 10.1007/s11104-012-1257-9 [DOI] [Google Scholar]
- Kronzucker H. J., Glass A. D. M., Siddiqi M. Y. (1995). Nitrate induction in spruce: an approach using compartmental analysis. Planta 196, 683–690 10.1007/BF01106761 [DOI] [Google Scholar]
- Lambers H., Raven J. A., Shaver G. R., Smith S. E. (2008). Plant nutrient-acquisition strategies change with soil age. Trends Ecol. Evolut. 23, 95–103 10.1016/j.tree.2007.10.008 [DOI] [PubMed] [Google Scholar]
- Laursen K. H., Mihailova A., Kelly S. D., Epov V. N., Bérail S., Schjoerring J. K., et al. (2013). Is it really organic? Multi-isotopic analysis as a tool to discriminate between organic and conventional plants. Food Chem. 141, 2812–2820 10.1016/j.foodchem.2013.05.068 [DOI] [PubMed] [Google Scholar]
- LeBauer D. S., Treseder K. K. (2008). Nitrogen limitation of net primary productivity in terrestrial ecosystems is globally distributed. Ecology 89, 371–379 10.1890/06-2057.1 [DOI] [PubMed] [Google Scholar]
- Ledgard S. F., Woo K. C., Bergersen F. J. (1985). Isotopic fractionation during reduction of nitrate and nitrite by extracts of spinach leaves. Aust. J. Plant Physiol. 12, 631–640 10.1071/PP9850631 [DOI] [Google Scholar]
- Lensi R., Gourbiere F., Josserand A. (1985). Measurement of small amounts of nitrate in an acid soil by N2O production. Soil Biol. Biochem. 17, 733–734 10.1016/0038-0717(85)90056-2 [DOI] [Google Scholar]
- Lexa M., Cheeseman J. M. (1997). Growth and nitrogen relations in reciprocal grafts of wild-type and nitrate reductase-deficient mutants of pea (Pisum sativum L. var. Juneau). J. Exp. Bot. 48, 1241–1250 10.1093/jxb/48.6.1241 [DOI] [Google Scholar]
- Liu X. Y., Koba K., Liu C. Q., Li X. D., Yoh M. (2012c). Pitfalls and new mechanisms in moss isotopic bio-monitoring of atmospheric nitrogen deposition. Environ. Sci. Technol. 46, 12557–12566 10.1021/es300779h [DOI] [PubMed] [Google Scholar]
- Liu X. Y., Koba K., Makabe A., Li X. D., Yoh M., Liu C. Q. (2013b). Ammonium first: natural mosses prefer atmospheric ammonium but vary utilization of dissolved organic nitrogen depending on habitat and nitrogen deposition. New Phytol. 199, 407–419 10.1111/nph.12284 [DOI] [PubMed] [Google Scholar]
- Liu X. Y., Koba K., Takebayashi Y., Liu C. Q., Fang Y. T., Yoh M. (2012a). Preliminary insights into δ 15N and δ 18O of nitrate in natural mosses: A new application of the denitrifier method. Environ. Pollut. 162, 48–55 10.1016/j.envpol.2011.09.029 [DOI] [PubMed] [Google Scholar]
- Liu X. Y., Koba K., Takebayashi Y., Liu C. Q., Fang Y. T., Yoh M. (2013a). Dual N and O isotopes of nitrate in natural plants: first insights into individual variability and organ-specific pattern. Biogeochemistry 114, 399–411 10.1007/s10533-012-9721-4 [DOI] [Google Scholar]
- Liu X. Y., Koba K., Yoh M., Liu C. Q. (2012b). Nitrogen and oxygen isotope effects of tissue nitrate associated with nitrate acquisition and utilization in the moss Hypnum plumaeforme. Funct. Plant Biol. 39, 598–608 10.1071/FP12014 [DOI] [PubMed] [Google Scholar]
- Lockwood A. L., Filley T. R., Rhodes D., Shepson P. B. (2008). Foliar uptake of atmospheric organic nitrates. Geophys. Res. Lett. 35:L15809 10.1029/2008GL03471420628880 [DOI] [Google Scholar]
- Mariotti A., Germon J. C., Hubert P., Kaiser P., Letolle R., Tardieux A., et al. (1981). Experimental determination of nitrogen kinetic isotope fractionation: some principles; illustration for the denitrification and nitrification processes. Plant Soil 62, 413–430 10.1007/BF02374138 [DOI] [Google Scholar]
- Mariotti A., Mariotti F., Amarger N., Pizelle G., Ngambi J., Champigny M. L., et al. (1980). Eractionnements i.sotopiques de I'azoie lors des processus d'absorption des nitrates el de fixation de I'azote atmospherique par les plantes. Phvsiologie Vegetale 18, 163–181 [Google Scholar]
- Mariotti A., Mariotti F., Champigny M. L., Amarger N., Moyse A. (1982). Nitrogen isotope fractionation associated with nitrate reductase-activity and uptake of NO−3 by pearl millet. Plant Physiol. 69, 880–884 10.1104/pp.69.4.880 [DOI] [PMC free article] [PubMed] [Google Scholar]
- McIlvin M. R., Casciotti K. L. (2011). Technical updates to the bacterial method for nitrate isotopic analyses. Anal. Chem. 83, 1850–1856 10.1021/ac1028984 [DOI] [PubMed] [Google Scholar]
- McKane R. B., Johnson L. C., Shaver G. R., Nadelhoffer K. J., Rastetter E. B., Fry B., et al. (2002). Resource-based niches provide a basis for plant species diversity and dominance in arctic tundra. Nature 415, 68–71 10.1038/415068a [DOI] [PubMed] [Google Scholar]
- Michalski G. (2010). Purification procedure for δ 15N, δ 18O, Δ 17O analysis of nitrate. Int. J. Environ. Anal. Chem. 90, 586–590 10.1080/03067310902783593 [DOI] [Google Scholar]
- Mihailova A., Pedentchouk N., Kelly S. D. (2014). Stable isotope analysis of plant-derived nitrate – novel method for discrimination between organically and conventionally grown vegetables. Food Chem. 154, 238–245 10.1016/j.foodchem.2014.01.020 [DOI] [PubMed] [Google Scholar]
- Miller A. J., Smith S. J. (1996). Nitrate transport and compartmentation in cereal root cells, J. Exp. Bot. 47, 843–854 10.1093/jxb/47.7.84316866965 [DOI] [Google Scholar]
- Min X., Siddiqi M. Y., Guy R. D., Glass A. D. M., Kronzucker H. J. (1998). Induction of nitrate uptake and nitrate reductase activity in trembling aspen and lodgepole pine. Plant Cell Environ. 21, 1039–1046 10.1046/j.1365-3040.1998.00340.x [DOI] [Google Scholar]
- Mukotaka A. (2014). A Study of Nitrogen Oxides Dynamics Between Urban Atmosphere and the Phyllosphere Using Triple Oxygen Isotopes. Ph. D. Dissertation, Tokyo Institute of Technology, Tokyo, 2–47 [Google Scholar]
- Nacry P., Bouguyon E., Gojon A. (2013). Nitrogen acquisition by roots: physiological and developmental mechanisms ensuring plant adaptation to a fluctuating resource. Plant Soil 370, 1–29 10.1007/s11104-013-1645-9 [DOI] [Google Scholar]
- Nadelhoffer K. J., Shaver G., Fry B., Johnson L., McKane R. (1996). 15N natural abundances and N use by tundra plants. Oecologia 107, 386–394 10.1007/BF00328456 [DOI] [PubMed] [Google Scholar]
- Näsholm T., Kielland K., Ganeteg U. (2009). Uptake of organic nitrogen by plants. New Phytol. 182, 31–48 10.1111/j.1469-8137.2008.02751.x [DOI] [PubMed] [Google Scholar]
- Needoba J. A., Harrison P. J. (2004). Influence of low light and a light:dark cycle on NO−3 uptake, intracellular NO−3, and nitrogen isotope fractionation by marine phytoplankton. J. Phycol. 40, 505–516 10.1111/j.1529-8817.2004.03171.x [DOI] [Google Scholar]
- Needoba J. A., Sigman D. M., Harrison P. J. (2004). The mechanism of isotope fractionation during algal nitrate assimilation as illuminated by the 15N/14N of intracellular nitrate. J. Phycol. 40, 517–522 10.1111/j.1529-8817.2004.03172.x [DOI] [Google Scholar]
- Needoba J. A., Waser N. A., Harrison P. J., Calvert S. E. (2003). Nitrogen isotope fractionation in 12 species of marine phytoplankton during growth on nitrate. Mar. Ecol. Prog. Ser. 255, 81–91 10.3354/meps255081 [DOI] [Google Scholar]
- Norby R. J., Weerasuriya Y., Hanson P. J. (1989). Induction of nitrate reductase activity in red spruce needles by NO2 and HNO3 vapor. Can. J. For. Res. 19, 889–896 10.1139/x89-135 [DOI] [Google Scholar]
- Norwitz G., Keliher P. N. (1986). Study of organic interferences in the spectrophotometric determination of nitrite using composite diazotization-coupling reagents: Analyst 111, 1033–1037 10.1039/an9861101033 [DOI] [PubMed] [Google Scholar]
- Olleros-Izard T. (1983). Kinetische Isotopeneffekte der Arginase und Nitratreduktase Reaktion: ein Betrag zur Aufklarung der entsprechenden Reaktionmechanismen. Ph. D. thesis, Technischen Universität München, Freising-Weihenstephan [Google Scholar]
- Pate J. S., Stewart G. R., Unkovich M. (1993). 15N natural abundance of plant and soil components of a Banksia woodland ecosystem in relation to nitrate utilization, life form, mycorrhizal status and Ns-fixing abilities of component species. Plant Cell Environ. 16, 365–373 10.1111/j.1365-3040.1993.tb00882.x [DOI] [Google Scholar]
- Peuke A. D., Gessler A., Tcherkez G. (2013). Experimental evidence for diel δ 15N-patterns in different tissues, xylem and phloem saps of castor bean (Ricinus communis L.). Plant Cell Environ. 36, 2219–2228 10.1111/pce.12132 [DOI] [PubMed] [Google Scholar]
- Prasad S., Chetty A. A. (2008). Nitrate-N determination in leafy vegetables: Study of the effects of cooking and freezing. Food Chem. 106, 772–780 10.1016/j.foodchem.2007.06.005 [DOI] [Google Scholar]
- Raven J. A. (2003). Can plants rely on nitrate? Trends Plant Sci. 8, 314–315 10.1016/S1360-1385(03)00125-0 [DOI] [PubMed] [Google Scholar]
- Raven J. A., Wollenweber B., Handley L. L. (1992). A comparison of ammonium and nitrate as nitrogen sources for photolithotrophs. New Phytol. 121, 19–32 10.1111/j.1469-8137.1992.tb01088.x18034773 [DOI] [Google Scholar]
- Raven J. A., Yin Z. H. (1998). The past, present and future of nitrogenous compounds in the atmosphere, and their interactions with plants. New Phytol. 139, 205–219 10.1046/j.1469-8137.1998.00168.x [DOI] [Google Scholar]
- Robe W. E., Griffiths H., Sleep D., Quarmby C. (1994). Nitrogen partitioning and assimilation: methods for the extraction, separation and mass spectrometric analysis of nitrate, amino acid and soluble protein pools from individual plants following 15N labelling. Plant Cell Environ. 17, 1073–1079 10.1111/j.1365-3040.1994.tb02031.x [DOI] [Google Scholar]
- Robinson D. (2001). δ 15N as an integrator of the nitrogen cycle. Trends Ecol. Evolut. 16, 153–162 10.1016/S0169-5347(00)02098-X [DOI] [PubMed] [Google Scholar]
- Robinson D., Handley L. L., Scrimgeour C. M. (1998). A theory for 15N/14N fractionation in nitrate-grown vascular plants. Planta 205, 397–406 10.1007/s004250050336 [DOI] [Google Scholar]
- Scheible W. R., Gonzalez-Fontes A., Morcuende R., Lauerer M., Muller-Rober B., Michel Caboche M., et al. (1997b). Nitrate acts as a signal to induce organic acid metabolism and repress starch metabolism in tobacco. Plant Cell. 9, 783–798 10.1105/tpc.9.5.783 [DOI] [PMC free article] [PubMed] [Google Scholar]
- Scheible W. R., Lauerer M., Schulze E. D., Caboche M., Stitt M. (1997a). Accumulation of nitrate in the shoot acts as signal to regulate shoot-root allocation in tobacco. Plant J. 11, 671–691 10.1046/j.1365-313X.1997.11040671.x [DOI] [Google Scholar]
- Scheurwater I., Koren M., Lambers H., Atkin O. K. (2002). The contribution of roots and shoots to whole plant nitrate reduction in fast- and slow-growing grass species. J. Exp. Bot. 53, 1635–1642 10.1093/jxb/erf008 [DOI] [PubMed] [Google Scholar]
- Schimel J. P., Bennett J. (2004). Nitrogen mineralization: challenges of a changing paradigm. Ecology 85, 591–602 10.1890/03-8002 [DOI] [Google Scholar]
- Shearer G., Schneider J. D., Kohl D. H. (1991). Separating the efflux and influx components of net nitrate uptake by Synechococcus-R2 under steady-state conditions. J. Gen. Microbiol. 137, 1179–1184 10.1099/00221287-137-5-1179 [DOI] [Google Scholar]
- Sievering H., Tomasewski T., Torizzo J. (2007). Canopy uptake of atmospheric N deposition at a conifer forest: part I -canopy N budget, photosynthetic efficiency and net ecosystem exchange. Tellus B 59, 483–492 10.1111/j.1600-0889.2007.00264.x [DOI] [Google Scholar]
- Sigman D. M., Casciotti K. L., Andreani M., Barford C., Galanter M., Böhlke J. K. (2001). A bacterial method for the nitrogen isotopic analysis of nitrate in seawater and freshwater. Anal Chem. 73, 4145–4153 10.1021/ac010088e [DOI] [PubMed] [Google Scholar]
- Simon J., Li X. Y., Rennenberg H. (2014). Competition for nitrogen between European beech and sycamore maple shifts in favour of beech with decreasing light availability. Tree Physiol. 34, 49–60 10.1093/treephys/tpt112 [DOI] [PubMed] [Google Scholar]
- Somers D. A., Kuo T. M., Kleinhofs A., Warner R. L., Oaks A. (1983). Synthesis and degradation of barley nitrate reductase. Plant Physiol. 72, 949–952 10.1104/pp.72.4.949 [DOI] [PMC free article] [PubMed] [Google Scholar]
- Sparks J. P. (2009). Ecological ramifications of the direct foliar uptake of nitrogen. Oecologia 159, 1–13 10.1007/s00442-008-1188-6 [DOI] [PubMed] [Google Scholar]
- Sparks J. P., Monson R. K., Sparks K. L., Lerdau M. T. (2001). Leaf uptake of nitrogen dioxide (NO2) in a tropical wet forest: implications for tropospheric chemistry. Oecologia 127, 214–221 10.1007/s004420000594 [DOI] [PubMed] [Google Scholar]
- Stadler J., Gebauer G. (1992). Nitrate reduction and nitrate content in ash trees (Fraxinus excelsior L.): distribution between compartments, site comparison and seasonal variation. Trees 6, 236–240 10.1007/BF00224342 [DOI] [Google Scholar]
- Stams A. J. M., Schipholt I. J. L. (1990). Nitrate accumulation in leaves of vegetation of a forested ecosystem receiving high amounts of atmospheric ammonium sulfate. Plant Soil 125, 143–145 10.1007/BF00010754 [DOI] [Google Scholar]
- Stevens C. J., Manning P., van den Berg L. J. L., de Graaf M. C. C., Wamelink G. W. W., Boxman A. W., et al. (2011). Ecosystem responses to reduced and oxidised nitrogen inputs in European terrestrial habitats. Environ. Pollut. 159, 665–676 10.1016/j.envpol.2010.12.008 [DOI] [PubMed] [Google Scholar]
- Stewart G. R., Joly C. A., Smirnoff N. (1992). Partitioning of inorganic nitrogen assimilation between the roots and shoots of cerrado and forest trees of contrasting plant communities of South East Brasil. Oecologia 91, 511–517 10.1007/BF00650324 [DOI] [PubMed] [Google Scholar]
- Stewart G. R., Pate G. S., Unkovich M. (1993). Characteristics of inorganic nitrogen assimilation of plants in fire-prone Mediterranean-type vegetation. Plant Cell Environ. 16, 351–363 10.1111/j.1365-3040.1993.tb00881.x [DOI] [Google Scholar]
- Takebayashi Y., Koba K., Sasaki Y., Fang Y. T., Yoh M. (2010). The natural abundance of 15N in plant and soil-available N indicates a shift of main plant N resources to NO3 from NH4 along the N leaching gradient. Rapid Commun. Mass Spectrom. 24, 1001–1008 10.1002/rcm.4469 [DOI] [PubMed] [Google Scholar]
- Tang M. H., Porder S., Lovett G. M. (2012). Species differences in nitrate reductase activity are unaffected by nitrogen enrichment in northeastern US forests. For. Ecol. Manage. 275, 52–59 10.1016/j.foreco.2012.03.006 [DOI] [Google Scholar]
- Taylor P. G., Townsend A. R. (2010). Stoichiometric control of organic carbon-nitrate relationships from soils to the sea. Nature 464, 1178–1181 10.1038/nature08985 [DOI] [PubMed] [Google Scholar]
- Tcherkez G., Farquhar G. D. (2006). Viewpoint: Isotopic fractionation by plant nitrate reductase, twenty years later. Funct. Plant Biol. 33, 531–537 10.1071/FP05284 [DOI] [PubMed] [Google Scholar]
- Teklemariam T. A., Sparks J. P. (2004). Gaseous fluxes of peroxyacetyl nitrate (PAN) into plant leaves. Plant Cell Environ. 27, 1149–1158 10.1111/j.1365-3040.2004.01220.x [DOI] [Google Scholar]
- Tischner R. (2000). Nitrate uptake and reduction in higher and lower plants. Plant Cell Environ. 23, 1005–1024 10.1046/j.1365-3040.2000.00595.x [DOI] [Google Scholar]
- Tsunogai U., Daita S., Komatsu D. D., Nakagawa F., Tanaka A. (2011). Quantifying nitrate dynamics in an oligotrophic lake using Δ17O. Biogeosciences 8, 687–702 10.5194/bg-8-687-2011 [DOI] [Google Scholar]
- Vallano D. M., Sparks J. P. (2008). Quantifying foliar uptake of gaseous nitrogen dioxide using enriched foliar δ15N values. New Phytol. 177, 946–955 10.1111/j.1469-8137.2007.02311.x [DOI] [PubMed] [Google Scholar]
- Vitousek P. M., Howarth R. W. (1991). Nitrogen limitation on land and in the Sea: How can it occur? Biogeochemistry. 13, 87–115 10.1007/BF00002772 [DOI] [Google Scholar]
- Volk R. J., Pearson C. J., Jackson W. A. (1979). Reduction of plant tissue nitrate to nitric oxide for mass spectrometric N analysis. Anal. Biochem. 97, 131–135 10.1016/0003-2697(79)90336-1 [DOI] [PubMed] [Google Scholar]
- Wanek W., Zotz G. (2011). Are vascular epiphytes nitrogen or phosphorus limited? A study of plant 15N fractionation and foliar N:P stoichiometry with the tank bromeliad Vriesea sanguinolenta. New Phytol. 192, 462–470 10.1111/j.1469-8137.2011.03812.x [DOI] [PubMed] [Google Scholar]
- Wang L., Schjoerring J. K. (2012). Seasonal variation in nitrogen pools and 15N/13C natural abundances in different tissues of grassland plants. Biogeosciences 9, 1583–1595 10.5194/bg-9-1583-2012 [DOI] [Google Scholar]
- Wang Y. Y., Hsu P. K., Tsay Y. F. (2012). Uptake, allocation and signaling of nitrate. Trends Plant Sci. 17, 458–467 10.1016/j.tplants.2012.04.006 [DOI] [PubMed] [Google Scholar]
- Wellburn A. R. (1990). Why are atmospheric oxides of nitrogen usually phytotoxic and not alternative fertilizers? New Phytol. 115, 395–429 10.1111/j.1469-8137.1990.tb00467.x [DOI] [PubMed] [Google Scholar]
- Wellburn A. R. (1998). Atmospheric nitrogenous compounds and ozone - is NO_x fixation by plants a possible solution? New Phytol. 139, 5–9 10.1046/j.1469-8137.1998.00178.x [DOI] [Google Scholar]
- Werner R. A., Schmidt H. L. (2002). The in vivo nitrogen isotope discrimination among organic plant compounds. Phytochemistry 61, 465–484 10.1016/S0031-9422(02)00204-2 [DOI] [PubMed] [Google Scholar]
- Widmann K., Gebauer G., Rehder H., Ziegler H. (1993). Fluctuations in nitrate reductase activity, and nitrate and organic nitrogen concentrations of succulent plants under different nitrogen and water regimes. Oecologia 94, 146–152 10.1007/BF00317316 [DOI] [PubMed] [Google Scholar]
- Yoneyama T., Ito O., Engelaar W. M. H. G. (2003). Uptake, metabolism and distribution of nitrogen in crop plants traced by enriched and natural 15N: progress over the last 30 years. Phytochem. Rev. 2, 121–132 10.1023/B:PHYT.0000004198.95836.ad [DOI] [Google Scholar]
- Yoneyama T., Kaneko A. (1989). Variations in the natural abundance of 15N in nitrogenous fractions of komatsuna plants supplied with nitraie. Plant Cell Physiol. 30, 957–962 [Google Scholar]
- Yoneyama T., Matsumaru T., Usui K., Engelaar W. M. H. G. (2001). Discrimination of nitrogen isotopes during absorption of ammonium and nitrate at different nitrogen concentrations by rice Oryza sativa L. plants. Plant Cell Environ. 24, 133–139 10.1046/j.1365-3040.2001.00663.x [DOI] [Google Scholar]
- Yoneyama T., Tanaka F. (1999). Natural abundance of 15N in nitrate, ureides, and amino acids from plant tissues. Soil Sci. Plant Nutr. 45, 751–755 10.1080/00380768.1999.10415840 [DOI] [Google Scholar]
- Zhen R. G., Koyro H. W., Leigh R. A., Tomos A. D., Miller A. J. (1991). Compartmental nitrate concentrations in barley root cells measured with nitrate-selective microelectrodes and by single-cell sap sampling. Planta 185, 356–361 10.1007/BF00201056 [DOI] [PubMed] [Google Scholar]
- Zhen R. G., Leigh R. A. (1990). Nitrate accumulation by wheat (Triticum aestivum) in relation to growth and tissue concentrations. Plant Soil 124, 157–160 10.1007/BF00009253 [DOI] [Google Scholar]