

Abstract
Faldaprevir is a potent hepatitis C virus (HCV) NS3/4A protease inhibitor with negligible urinary excretion. We assessed the pharmacokinetics and safety of a single oral dose of faldaprevir (480 mg) in 32 HCV-negative subjects with renal impairment or normal renal function. Compared with subjects with normal renal function, the adjusted geometric mean ratios (90% confidence intervals in parentheses) for overall exposure area under the concentration-time curve from zero to infinity (AUC0–∞) were 113.6% (41.6 to 310.2%), 178.3% (85.2 to 373.0%), and 169.2% (73.2 to 391.2%) for subjects with mild, moderate, and severe renal impairment, respectively. Overall, 5/8 (63%) subjects with normal renal function and 20/24 (83%) subjects with renal impairment reported adverse events, with gastrointestinal events being the most common. No severe or serious adverse events or deaths were reported. These results suggest that moderate or severe renal impairment can result in a modest increase in faldaprevir exposure. The increase in exposure may be related to decrease in the activity of the liver uptake transporter OATP1B1 as a result of renal impairment. Given this relatively slight increase in exposure, a dose adjustment in HCV patients with renal impairment is not warranted. (This study has been registered at ClinicalTrials.gov under registration number NCT01957657.)
INTRODUCTION
Chronic hepatitis C virus (HCV) infection is a cause of renal dysfunction and associated with a number of comorbidities that can affect renal function (1, 2).
As impaired renal function may influence drug metabolism and pharmacokinetics (PK) (3, 4), dose adjustments might be required in this patient population to avoid excess drug accumulation, which can impact drug efficacy and safety. While the introduction of the NS3/4A protease inhibitors telaprevir and boceprevir represented a significant advance in the management of patients with chronic HCV genotype 1 (GT-1) infection, their use is associated with some disadvantages (5). In addition to being associated with a number of significant serious side effects (including rash, anemia, and gastrointestinal symptoms), these protease inhibitors require three times daily dosing due to short half-lives, have a complex drug-drug interaction profile (limiting coadministration with other agents), and are associated with a marked decline in renal function (6–8).
In order to improve the safety, efficacy, and convenience of HCV treatments, a number of second-generation direct-acting antivirals (DAAs) for the treatment of patients infected with HCV GT-1 are in clinical development or have recently been approved (9–11). Faldaprevir is a potent HCV NS3/4A protease inhibitor (12), which, in combination with pegylated alpha-2a interferon and ribavirin (RBV) (PR), has been shown to be highly effective for the treatment of chronic HCV GT-1 infection (13–16). In the phase III STARTVerso1 trial, once-daily (QD) faldaprevir (120 mg) plus PR achieved sustained virologic response rates 12 weeks after completion of treatment (SVR12) of 79% of treatment-naive patients with HCV GT-1 infection (16). Faldaprevir (120 mg QD) plus PR was well tolerated, with a safety profile similar to that of PR alone and a low rate of adverse events (AEs) leading to discontinuations. High SVRs have also been achieved with faldaprevir in phase II interferon-free combinations with deleobuvir (a nonnucleoside NS5B inhibitor) and ribavirin (SOUND-C3) and with PPI-668 (an NS5A inhibitor), deleobuvir, and RBV in patients infected with GT-1a or GT-1b (17, 18).
The pharmacokinetic profile of faldaprevir supports QD administration (19). Phase Ib pharmacokinetic data showed that following administration of faldaprevir (20 to 240 mg QD), concentrations of the drug in plasma peaked at 2 to 6 h and increased supraproportionally with dose (19). In addition, the half-life of faldaprevir in HCV-infected patients was approximately 20 to 30 h (19). Although urinary excretion is not an important metabolic pathway for faldaprevir, with approximately 0.1% excreted through this route (20), it is currently unknown if altered renal function influences faldaprevir distribution or metabolism. Therefore, the aim of this study was to examine the effects of mild, moderate, or severe renal impairment on the pharmacokinetics and safety of faldaprevir.
Boehringer Ingelheim (BI) has recently decided not to pursue the development of faldaprevir, since there was no longer deemed to be an unmet need for faldaprevir interferon-based HCV treatment. Nonetheless, this study provides important information on the potential effect of renal impairment on the activities of liver transporters, in particular, liver uptake transporters (OATP1B1) in HCV therapies, and, together with safety and efficacy data from phase II and III studies, may help us understand the effect of renal impairment on the treatment of HCV infection.
MATERIALS AND METHODS
Study design.
This study (registered at ClinicalTrials.gov under registration number NCT01957657) was a nonrandomized, open-label, single-dose, parallel-group phase I study, designed in accordance with the FDA guideline on pharmacokinetics in patients with reduced renal function (21). Thirty-two male and female subjects were assigned to one of four renal function groups (8 in each group), according to their estimated glomerular filtration rate (eGFR), calculated using the modification of diet in renal disease (MDRD) formula (22), yielding the following groups: normal renal function (eGFR ≥ 90 ml/min/1.73 m2), mild renal impairment (eGFR = 60 to 89 ml/min/1.73 m2), moderate renal impairment (eGFR = 30 to 59 ml/min/1.73 m2), and severe renal impairment (eGFR = 15 to 29 ml/min/1.73 m2).
Following a 10-hour overnight fast, subjects were administered a single, 480-mg oral dose of faldaprevir (Fig. 1). This is equivalent to the initial loading dose of faldaprevir given to treatment-experienced patients and twice the initial loading dose given to treatment-naive patients in the faldaprevir phase III clinical trials.
FIG 1.
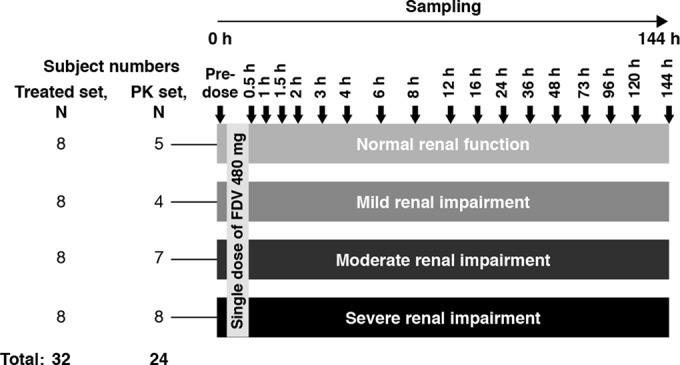
Study design. FDV, faldaprevir; h, hour; PK, pharmacokinetic.
Subjects.
This study was conducted at CRS Clinical Research Services Kiel GmbH (Kiel, Germany) following approval by the Independent Ethics Committee (IEC; Ethikkommission bei der Ärztekammer Schleswig-Holstein, Bad Segeberg, Germany). The clinical trial application was also reviewed by the German Competent Authority (Bundesinstitut für Arzneimittel und Medizinprodukte [BfArM], Bonn, Germany). The trial was carried out in compliance with the protocol and principles laid down in the Declaration of Helsinki (1996 version), and in accordance with applicable regulatory requirements. All subjects provided written informed consent prior to participation.
Nonsmoking male and female subjects, 18 to 75 years of age (up to 79 years for subjects with severe renal impairment), with body mass index (BMI) of ≥18.5 to ≤34 kg/m2 were eligible for inclusion. Female subjects were required not to be pregnant or nursing and had agreed to use adequate contraception for the duration of the trial. Subjects were included if in generally good health, as judged by medical history, physical examinations, and clinical laboratory data. Subjects were excluded if they presented with clinically abnormal laboratory results or evidence of existing diseases; these included positive serology test for HIV, hepatitis B virus, or HCV. Conditions that could potentially interfere with the pharmacokinetics or tolerability of faldaprevir were also criteria for exclusion; these include histories of photosensitivity or recurrent rash, gastrointestinal surgery, smoking, consumption of alcohol, drug abuse, intake of a long-half-life drug prior to administration of the study drug, participation in a multiple-dose trial within 2 months or a single-dose trial within 1 month prior to this trial, or recent blood donation. Subjects could be withdrawn from the study at any time due to violation of inclusion/exclusion criteria, failure to show for the study, AEs, withdrawal of consent, use of concomitant drugs interfering with the study medication, onset of an illness, or other medical reasons (e.g., surgery).
Blood sample collection.
For quantification of faldaprevir concentrations in plasma, blood was collected into an EDTA-anticoagulant blood drawing tube at the following time points: on day 1, 0 h (predosing), and 0.5, 1, 1.5, 2, 3, 4, 6, 8, 12, and 16 h postdosing; on days 2 to 7, 24, 36, 48, 72, 96, 120, and 144 h postdosing (Fig. 1).
Bioanalytical methods.
Faldaprevir concentrations in plasma were determined by a validated high-performance liquid chromatography-tandem mass spectrometry (HPLC-MS/MS; Tandem Laboratories, Salt Lake City, UT, USA) assay, with a lower limit of quantification of 10 ng/ml. LC-MS/MS used electrospray ionization and positive ion mode as the detection method. The extraction method used was the solid-phase extraction method. The internal standard was [D7]-BI00201335ZW. Linear calibration curves were obtained over the range from 10 to 10,000 ng/ml. The assay accuracy precision (% coefficient of variation [CV%]) was in the range of 2.9 to 4.0%. The assay inaccuracy deviation was in the range of −1.5 to 0.5%.
The extent of faldaprevir protein binding was determined using equilibrium dialysis. Ten plasma samples from each of the 32 subjects were pooled, providing 32 pooled samples. Teflon dialysis cells (Spectrum) and dialysis membranes (Spectra/Por) with a 12,000 to 14,000 molecular weight cutoff were used. After assembling the dialysis cells and membranes, the pooled plasma from each subject was adjusted to pH 7.4, and 1 ml was added to the donor side of the dialysis cell. The receiver side of each dialysis cell was filled with 1 ml of 0.1 M sodium phosphate buffer (pH 7.4). For each subject, three individual dialysis cells were prepared and rotated at 20 rpm for 4 h (the equilibrium time previously determined) using a Spectrum dialysis cell rotator in a water bath maintained at approximately 37°C. At the end of the incubation period, the contents of each side were transferred to a tared scintillation vial. Volumes were determined by weighing each vial. Concentrations of faldaprevir were measured by a validated LC-MS/MS, which qualified for the concentration range of 0.50 to 5,000 ng/ml, with a lower limit of quantitation of 0.50 ng/ml. The assay for buffer was qualified for the concentration range of 0.01 to 50.0 ng/ml, with a lower limit of quantitation of 0.01 ng/ml.
Safety assessment.
All subjects who received at least one dose of trial medication were included in the safety evaluation. Safety was evaluated on the basis of AEs, physical (medical) examinations, and laboratory tests (serum chemistry, hematology, urinalysis, lipid profile, drug and virus screening, and pregnancy test for female subjects). Measurement of vital signs and 12-lead electrocardiograms (ECGs) were also conducted. All safety assessments were performed at screening, before the first-dose drug administration, at follow-up visits, and at the end of the study (within 7 to 14 days after dosing). All clinically significant abnormal values, including laboratory parameters other than for renal function tests, or deviation of clinical laboratory values other than those related to renal impairment, were followed up using the appropriate tests until a return to baseline values or a medically acceptable level was achieved.
AEs and their severity, duration, and potential relationship to the study drug were assessed by the investigator throughout the study. AEs persisting after trial completion were followed up until they normalized or were sufficiently characterized.
Pharmacokinetic data analysis.
Concentration in plasma-time data were analyzed by a noncompartmental approach using WinNonlin (version 5.2; Pharsight, Sunnyvale, CA, USA). Maximum concentration of drug in plasma, Cmax (ng/ml) was obtained directly from the observed data for each subject; peak time, tmax (h), was the time at which Cmax was attained. The terminal elimination rate constant, λz (h−1), was calculated by linear regression using the terminal log-linear portion of the concentration-time curve. The elimination half-life (t1/2 [h]) was estimated as ln 2/λz. Area under the concentration-time curve from 0 h to infinity (AUC0–∞) was calculated using the linear up/log down algorithm, and the last predicted concentration was used for extrapolation of AUC. Oral clearance (CL/F [ml/min]) was calculated as dose/AUC0–∞, and volume of distribution (V/F) was calculated as CL/F/λz.
Statistical analysis.
The sample size was not based on power calculation; however, it was considered adequate in order to obtain reliable results to meet the study objectives. Subjects in the normal renal function group were matched with subjects with renal impairment as follows: (i) age within the mean age of all renally impaired subjects ± 5 years and (ii) weight within the mean weight of all renally impaired subjects ± 15%.
SAS software (SAS Institute Inc., Cary, NC, USA) was used for the statistical analyses. Faldaprevir exposure in subjects with renal impairment compared with exposure in matched normal renal function subjects was assessed using an average bioequivalence method to determine the geometric mean (gMean) ratio between subjects with renal impairment (R) and subjects with normal renal function (N) for pharmacokinetic parameters AUC0–∞ and Cmax (primary endpoints). Primary endpoints were log transformed (natural logarithm) prior to fitting an analysis of variance (ANOVA) model with a fixed effect for treatment. Differences between the mean log(R) − log(N) were estimated by the differences in the corresponding adjusted means (least square means), and 2-sided 90% confidence interval (CI) based on the t-distribution were calculated. These quantities were back transformed to the original (linear) scale to provide a point estimate and a 90% CI for the gMeans for test (renal function deviating from normal) and reference (normal renal function). Subject data were included in the pharmacokinetic analysis if no important protocol violations or no vomiting at or before twice the median plasma tmax of faldaprevir occurred. Descriptive statistics were used for all other pharmacokinetic and safety assessments.
RESULTS
Demographics.
Demographic data are summarized in Table 1. All 32 subjects received the single, 480-mg dose of faldaprevir. Twenty-one subjects were male (65.6%), the mean age was 61.4 years (range, 42 to 74 years), and all subjects were Caucasian. Overall, demographic data were similar among the four study groups.
TABLE 1.
Baseline demographics
| Characteristic (unit) | Renal function |
Total (n = 32) | |||
|---|---|---|---|---|---|
| Normal function (n = 8) | Mild impairment (n = 8) | Moderate impairment (n = 8) | Severe impairment (n = 8) | ||
| Gender, n (%) | |||||
| Male | 6 (75.0) | 5 (62.5) | 5 (62.5) | 5 (62.5) | 21 (65.6) |
| Female | 2 (25.0) | 3 (37.5) | 3 (37.5) | 3 (37.5) | 11 (34.4) |
| Race, n (%) | |||||
| Caucasian | 8 (100) | 8 (100) | 8 (100) | 8 (100) | 32 (100) |
| Mean age, yr (range) | 62.3 (59–65) | 58.8 (46–73) | 67.1 (51–74) | 57.6 (42–71) | 61.4 (42–74) |
| Mean body mass index, kg/m2 (range) | 26.5 (24.4–30.5) | 27.4 (23.0–32.8) | 24.2 (19.5–27.7) | 26.3 (20.0–30.9) | 26.1 (19.5–32.8) |
Pharmacokinetics.
Pharmacokinetic analyses were performed for 24 of 32 subjects. Eight subjects (3, 4, and 1 subjects with normal renal function, mild renal impairment, and moderate renal impairment, respectively) were excluded due to mild vomiting events occurring prior to 4 h (twice the median tmax of faldaprevir). Faldaprevir concentrations in plasma reached a peak (Cmax) approximately 2 to 6 h after dosing, with a median tmax of 4 h for all groups (Fig. 2 and Table 2). After reaching the maximum, faldaprevir concentrations declined, first in a rapid biphasic manner, followed by a slower terminal elimination phase (Fig. 2). Values of faldaprevir half-life (t1/2) were similar between renal function groups (36.1 h for subjects with normal renal function, and 35.8 h, 33.1 h, and 31.8 h for subjects with mild, moderate, and severe renal impairment, respectively [Table 2]).
FIG 2.
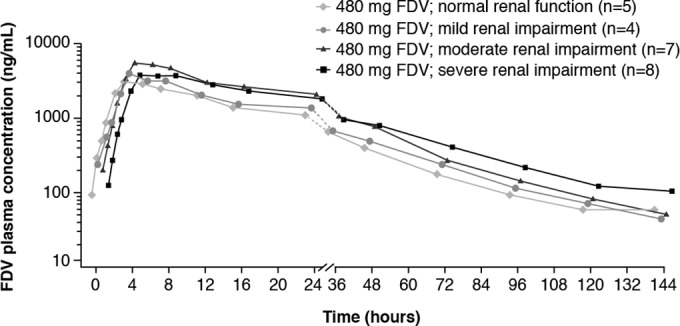
Mean concentration-time profiles of faldaprevir with or without renal impairment. FDV, faldaprevir.
TABLE 2.
Summary of pharmacokinetic parameters on the basis of renal functiona
| PK parameter (unit)b | Renal function |
|||||||
|---|---|---|---|---|---|---|---|---|
| Normal function (n = 5) |
Mild impairment (n = 4) |
Moderate impairment (n = 7) |
Severe impairment (n = 8) |
|||||
| gMean | gCV (%) | gMean | gCV (%) | gMean | gCV (%) | gMean | gCV (%) | |
| AUC0–∞ (ng · h/ml) | 76,500 | 95.7 | 86,900 | 89.8 | 136,000 | 67.2 | 129,000 | 98.8 |
| Cmax (ng/ml) | 3,810 | 80.7 | 4,080 | 144.0 | 6,680 | 63.2 | 4,600 | 135.0 |
| tmax, median or range (h) | 4.0 | 3.0–8.0 | 4.0 | 4.0–6.0 | 4.0 | 3.0–6.0 | 4.0 | 4.0–8.0 |
| t1/2 (h) | 36.1 | 23.5 | 35.8 | 31.0 | 33.1 | 32.3 | 31.8 | 41.9 |
| CL/F (ml/min) | 105.0 | 95.7 | 92.0 | 89.8 | 58.6 | 67.2 | 61.8 | 98.8 |
| Vz/F (liters) | 327.0 | 77.5 | 285.0 | 62.2 | 168.0 | 83.5 | 170.0 | 143.0 |
PK analysis excludes 8 subjects who suffered vomiting events prior to 4 h (twice the median tmax of faldaprevir).
AUC0–∞, area under the concentration-time curve from time zero to infinity; CL/F, oral clearance; Cmax, maximum concentration; gCV, geometric coefficient of variation; gMean, geometric mean; PK, pharmacokinetic; tmax, time to reach Cmax; t1/2, elimination half-life; Vz/F, volume of distribution.
The highest gMean faldaprevir exposures were in subjects with moderate renal impairment (Table 2). gMean values of Cmax were 3,810 ng/ml in subjects with normal renal function and 4,080 ng/ml, 6,680 ng/ml, and 4,600 ng/ml in subjects with mild, moderate, and severe renal impairment, respectively. Similarly, gMean values of AUC0–∞ were 76,500 ng · h/ml in subjects with normal renal function and 86,900 ng · h/ml, 136,000 ng · h/ml, and 129,000 ng · h/ml in subjects with mild, moderate, and severe renal impairment, respectively. However, the intersubject variability was high for both Cmax and AUC0–∞, with percent geometric coefficient of variation (gCV) values ranging from 63.2 to 144.0% for Cmax and from 67.2 to 98.8% for AUC0–∞.
Oral clearance (CL/F [ml/min]) was consistent with the trends observed for exposure; gMean CL/F was 105 ml/min in subjects with normal renal function and 92.0 ml/min, 58.6 ml/min, and 61.8 ml/min for subjects with mild, moderate, and severe renal impairment, respectively (Table 2). The apparent volume of distribution (VzF [liters]) followed a trend similar to that observed for oral clearance (Table 2).
Statistical evaluation of pharmacokinetic endpoints (AUC0–∞ and Cmax) compared subjects with normal renal function against subjects with impaired renal function. In subjects with renal impairment, there was a general trend toward higher faldaprevir exposure, despite a broad range of 90% CI (Table 3). Compared with subjects with normal renal function, the adjusted gMean ratios (90% CI) of faldaprevir exposure were 113.6% for AUC0–∞ (41.6 to 310.2%) and 107.2% for Cmax (35.2 to 327.0%) for subjects with mild renal impairment, 178.3% for AUC0–∞ (85.2 to 373.0%) and 175.5% for Cmax (89.6 to 344.1%) for subjects with moderate renal impairment, and 169.2% for AUC0–∞ (73.2 to 391.2%) and 121.0% for Cmax (47.3 to 309.7%) for subjects with severe renal impairment (Table 3). A sensitivity analysis was performed in all treated subjects (n = 32) and demonstrated that the gMean point estimates were not substantially different from those obtained in analysis of the pharmacokinetic data set; gMean AUC0–∞ was 191.0% (90% CI, 107.2 to 338.4%), and gMean Cmax was 190.6% (90% CI, 102.2 to 355.7%) for moderate renal impairment; and gMean AUC0–∞ was 185.4% (90% CI, 93.7 to 366.8%), and gMean Cmax was 136.3% (90% CI, 59.9 to 310.2%) for severe renal impairment compared with normal renal function.
TABLE 3.
Relative bioavailability of faldaprevir in subjects with renal impairment compared with subjects with normal renal functiona
| Level of renal impairment | Parameter (unit) | n | Adjusted gMean | n | Adjusted gMean | Test/reference gMean ratio (%) | 2-sided 90% CI (%) |
|
|---|---|---|---|---|---|---|---|---|
| Mild | AUC0–∞ (ng · h/ml) | 5 | 76,530 | 4 | 86,910 | 113.6 | 41.6 | 310.2 |
| Cmax (ng/ml) | 5 | 3,806 | 4 | 4,080 | 107.2 | 35.2 | 327.0 | |
| Moderate | AUC0–∞ (ng · h/ml) | 5 | 76,530 | 7 | 136,500 | 178.3 | 85.2 | 373.0 |
| Cmax (ng/ml) | 5 | 3,806 | 7 | 6,680 | 175.5 | 89.6 | 344.1 | |
| Severe | AUC0–∞ (ng · h/ml) | 5 | 76,530 | 8 | 129,500 | 169.2 | 73.2 | 391.2 |
| Cmax (ng/ml) | 5 | 3,806 | 8 | 4,604 | 121.0 | 47.3 | 309.7 | |
AUC0–∞, area under the concentration-time curve from time zero to infinity; CI, confidence interval; Cmax, maximum concentration; gMean, geometric mean.
Despite the general trend toward higher faldaprevir exposure in subjects with renal impairment, there did not appear to be a correlation between faldaprevir exposure (AUC0–∞ and Cmax) and renal function as estimated by eGFR (see Fig. S1 in the supplemental material).
Analysis of faldaprevir protein binding from all treated patients (n = 32) indicated that there were no differences in the fraction of unbound faldaprevir between subjects with normal renal function compared with those with renal impairment. Mean (± standard deviation) unbound faldaprevir was 0.09 ± 0.01% in subjects with normal renal function and 0.10 ± 0.06%, 0.10 ± 0.03%, and 0.13 ± 0.02% in subjects with mild, moderate, and severe renal impairment, respectively.
Safety.
AEs were reported in 62.5% of subjects with normal renal function and 83.3% of subjects with renal impairment (Table 4). The most frequent AEs across all study arms were gastrointestinal disorders, reported in 62.5% of subjects with normal renal function and 83.3% of subjects with impaired renal function (Table 4). Vomiting and diarrhea occurred in 37.5% (each) of subjects with normal renal function and in 20.8% and 75.0% of subjects with impaired renal function, respectively (Table 4). One subject with renal impairment had a mild increase in systolic blood pressure that was reported as an AE. Three subjects had increases in total bilirubin, which were considered to be related to faldaprevir administration. These were characterized by a predominance of indirect (unconjugated) bilirubin. Increases in indirect bilirubin were not associated with changes in the levels of other markers of liver toxicity and are consistent with a known metabolic effect (inhibition of UGT1A1 and hepatic uptake transporters) of faldaprevir. There were no other relevant changes in clinical laboratory parameters or vital signs for any of the four renal function groups. There were no AEs of severe intensity, serious AEs, or deaths reported. All AEs had resolved by the end of the study.
TABLE 4.
Frequency of subjects with adverse events (AEs) by renal function
| Type of AE | No. (%) of subjects with renal function classified as: |
||||
|---|---|---|---|---|---|
| Normal (n = 8) | Mildly impaired (n = 8) | Moderately impaired (n = 8) | Severely impaired (n = 8) | Mildly to severely impaired (pooled data) (n = 24) | |
| Any AE | 5 (62.5) | 8 (100) | 5 (62.5) | 7 (87.5) | 20 (83.3) |
| Drug-related AEa | 5 (62.5) | 8 (100) | 5 (62.5) | 7 (87.5) | 20 (83.3) |
| AEs by system organ classb | |||||
| Gastrointestinal disorders | 5 (62.5) | 8 (100) | 5 (62.5) | 7 (87.5) | 20 (83.3) |
| Diarrhea | 3 (37.5) | 6 (75.0) | 3 (62.5) | 7 (87.5) | 18 (75.0) |
| Vomiting | 3 (37.5) | 4 (50.0) | 1 (12.5) | 0 | 5 (20.8) |
| Nausea | 1 (12.5) | 3 (37.5) | 1 (12.5) | 2 (25.0) | 6 (25.0) |
| Gastrointestinal disorder | 0 | 1 (12.5) | 0 | 0 | 1 (4.2) |
| Hepatobiliary disorders | 0 | 1 (12.5) | 0 | 1 (12.5) | 2 (8.3) |
| Hyperbilirubinemia | 0 | 1 (12.5) | 0 | 1 (12.5) | 2 (8.3) |
| Investigations | 0 | 0 | 1 (12.5) | 1 (12.5) | 2 (8.3) |
| Blood bilirubin increased | 0 | 0 | 0 | 1 (12.5) | 1 (4.2) |
| Systolic blood pressure increased | 0 | 0 | 1 (12.5) | 0 | 1 (4.2) |
| Nervous system disorders | 1 (12.5) | 0 | 0 | 0 | 0 |
| Headache | 1 (12.5) | 0 | 0 | 0 | 0 |
| Syncope | 1 (12.5) | 0 | 0 | 0 | 0 |
| Musculoskeletal and connective tissue disorders | 1 (12.5) | 0 | 0 | 0 | 0 |
| Neck pain | 1 (12.5) | 0 | 0 | 0 | 0 |
Investigator-defined AEs.
More than one AE can occur in a single subject.
DISCUSSION
In this study, the effect of renal impairment on the pharmacokinetics and safety of the HCV NS3/4A protease inhibitor faldaprevir was determined. We demonstrate that moderate or severe renal impairment results in a modest increase in exposure to faldaprevir. However, these are not considered clinically relevant, as the modest increase in exposure was within the observed variability of exposure (approximately 100% in pivotal phase III trials [BI data on file]), and faldaprevir has been shown to have good tolerability and safety profiles in these studies (16, 23, 24). In addition, in the faldaprevir phase III program, the safety profiles of patients with mild and moderate renal impairment were generally consistent with those of normal renal function (BI data on file), and the exposure increase of severe renal impairment was similar to those of moderate renal function; thus, dose adjustment for renal impairment was not warranted in patients with HCV infection. A similar magnitude of increase in exposure for severe renal impairment was observed with simeprevir, an NS3/4A protease inhibitor with similar pharmacokinetic profiles; no dose adjustment was recommended in its FDA-approved package insert (10).
Of the 32 subjects who completed treatment, 8 (25%) were excluded from the pharmacokinetic analysis due to mild vomiting events, which may have decreased drug absorption. Sensitivity analysis showed that the results were consistent with and without the subjects with vomiting events. Following faldaprevir administration, the time to peak concentration was similar to, and half-life values were slightly higher than, previously reported values for faldaprevir, suggesting that renal impairment does not substantially affect these parameters (19). Assessment of pharmacokinetic data indicated that although gMean faldaprevir exposures were modestly increased in subjects with moderate and severe renal impairment compared with those with normal renal function, no correlation between exposure and renal function (eGFR) was observed. Although differences in absolute exposure were observed across study groups, the similarity in terminal elimination phase profiles between the renal function groups suggests that observed differences in exposure were not due to altered elimination of faldaprevir.
Faldaprevir is more than 99% bound to plasma proteins (12). In this study, faldaprevir protein binding in subjects with normal renal function was consistent with previously reported values and no different from those of subjects with renal impairment.
Despite urinary excretion of unchanged drug of approximately 0.1% for faldaprevir, the effects of renal impairment upon faldaprevir exposure are important. Renal impairment may affect the nonrenal clearance and distribution of therapeutic agents, and it has been demonstrated that exposure to the HCV protease inhibitor telaprevir increases in patients with renal impairment (8). Metabolic enzyme (e.g., CYP enzymes) and membrane transporter protein activities are interdependent (25–27), and buildup of uremic toxins, a consequence of renal impairment, is associated with altered membrane transport protein (such as OATPs, P-gp) activity (3, 4, 28). Renal impairment can also directly influence the activity of certain CYP enzymes and is associated with decreased CYP3A activity (29, 30). The mechanism of the observed modest effect of renal impairment on faldaprevir exposure is not fully clear at this point. However, it seems related to the reduction of liver uptake as a result of renal impairment. Faldaprevir is enriched in the liver via OATP1B1 or Na-dependent transporters (31, 32), and it has been shown that concentration of faldaprevir in liver can be enriched up to 22- to 35-fold higher than that in plasma (31). The available aforementioned literature suggests that renal impairment may compromise the activity of transporters, such as OATPs, and result in less liver uptake of compounds of OATPs substrates such as faldaprevir, and as a result, the volume of distribution would be decreased and levels of these compounds in plasma would be increased. This may explain the decreased CL/F observed in this study (CL/F = dose/AUC, with increased exposure leading to a decreased CL/F). Coadministration of inhibitors of OATP1B1 with substrates of OATP1B1 such as rosuvastatin, cerivastatin, and atorvastatin led to a similar reduction of V/F and CL/F, and in most cases, it had no effect on t1/2 (33). Similar results have also been observed for simeprevir, a second-generation protease inhibitor that is also a substrate of OATP1B1/1B3 with negligible urinary excretion (34). Simeprevir showed a 1.62-fold increase in exposure (AUC) in patients with severe renal impairment and a rate of elimination that was not substantially impacted by renal impairment. In addition to the potential role of OATPs, other mechanisms such as alteration of efflux transporters or CYP3A4 (gut) may, at least in part, account for the increased faldaprevir exposure in subjects with moderate or severe renal impairment.
No notable safety findings in subjects with renal impairment were observed despite a small increase in AEs in these subjects. Overall, the safety profile observed in this study was consistent with that reported in the faldaprevir clinical trial program in subjects without renal impairment (13–17). Increased levels of indirect bilirubin were not accompanied by elevations of other markers of liver toxicity, and these clinically irrelevant, transient indirect bilirubin increases are a well-known effect of treatment with faldaprevir, which is an inhibitor of UGT1A1 and hepatic uptake transporters (35).
This study illustrates the potential effect of renal impairment on the activities of transporters, in particular, uptake transporters in HCV therapies, and how in turn these compromised transporters may further impact the exposure of drugs (HCV therapies), even those with negligible urinary excretion. Therefore, although the development of faldaprevir has been halted, the significance of these findings may be extrapolated to other HCV therapies.
In conclusion, moderate or severe renal impairment is associated with a modest increase in faldaprevir exposure that did not negatively affect the overall tolerability of faldaprevir. Given the relatively modest increase in faldaprevir exposure, dose adjustment in HCV patients with mild to severe renal impairment is not warranted.
Supplementary Material
ACKNOWLEDGMENTS
This study was funded by Boehringer Ingelheim Pharma GmbH & Co. KG.
We are fully responsible for all content and editorial decisions, were involved at all stages of manuscript development, and have approved the final version.
Medical writing assistance, supported financially by Boehringer Ingelheim, was provided by Andrew Brooks and Katrin Gudmundsdottir of Choice Healthcare Solutions, during the preparation of the manuscript.
Conflict of interests: F.H., V.M., B.L., C.-L.Y., and M.E. are employees of Boehringer Ingelheim. A.H. and M.P.-S. are employees of CRS Clinical Research Services Kiel GmbH.
Footnotes
Supplemental material for this article may be found at http://dx.doi.org/10.1128/AAC.03359-14.
REFERENCES
- 1.Louie KS, St Laurent S, Forssen UM, Mundy LM, Pimenta JM. 2012. The high comorbidity burden of the hepatitis C virus infected population in the United States. BMC Infect Dis 12:86–97. doi: 10.1186/1471-2334-12-86. [DOI] [PMC free article] [PubMed] [Google Scholar]
- 2.Meyers CM, Seeff LB, Stehman-Breen CO, Hoofnagle JH. 2003. Hepatitis C and renal disease: an update. Am J Kidney Dis 42:631–657. doi: 10.1016/S0272-6386(03)00828-X. [DOI] [PubMed] [Google Scholar]
- 3.Verbeeck RK, Musuamba FT. 2009. Pharmacokinetics and dosage adjustment in patients with renal dysfunction. Eur J Clin Pharmacol 65:757–773. doi: 10.1007/s00228-009-0678-8. [DOI] [PubMed] [Google Scholar]
- 4.Dreisbach AW, Lertora JLL. 2008. The effect of chronic renal failure on drug metabolism and transport. Expert Opin Drug Metab Toxicol 4:1065–1074. doi: 10.1517/17425255.4.8.1065. [DOI] [PMC free article] [PubMed] [Google Scholar]
- 5.Ghany MG, Nelson DR, Strader DB, Thomas DL, Seeff LB. 2011. An update on treatment of genotype 1 chronic hepatitis C virus infection: 2011 practice guideline by the American Association for the Study of Liver Diseases. Hepatology 54:1433–1444. doi: 10.1002/hep.24641. [DOI] [PMC free article] [PubMed] [Google Scholar]
- 6.Hézode C, Fontaine H, Dorival C, Larrey D, Zoulim F, Canva V, de Ledinghen V, Poynard T, Samuel D, Bourlière M, Zarski JP, Raabe JJ, Alric L, Marcellin P, Riachi G, Bernard PH, Loustaud-Ratti V, Métivier S, Tran A, Serfaty L, Abergel A, Causse X, Di Martino V, Guyader D, Lucidarme D, Grando-Lemaire V, Hillon P, Feray C, Dao T, Cacoub P, Rosa I, Attali P, Petrov-Sanchez V, Barthe Y, Pawlotsky JM, Pol S, Carrat F, Bronowicki JP, Study Group CUPIC . 2013. Triple therapy in treatment-experienced patients with HCV-cirrhosis in a multicentre cohort of the French Early Access Programme (ANRS CO20-CUPIC)–NCT01514890. J Hepatol 59:434–441. doi: 10.1016/j.jhep.2013.04.035. [DOI] [PubMed] [Google Scholar]
- 7.Mauss S, Hueppe D, Alshuth U. 2014. Renal impairment is frequent in chronic hepatitis C patients under triple therapy with telaprevir or boceprevir. Hepatology 59:46–48. doi: 10.1002/hep.26602. [DOI] [PubMed] [Google Scholar]
- 8.US Food and Drug Administration. 2011. Advisory Committee briefing document for NDA 201-917 telaprevir 375 mg tablets. http://www.fda.gov/downloads/AdvisoryCommittees/CommitteesMeetingMaterials/drugs/antiviraldrugsadvisorycommittee/UCM252561.pdf Accessed 20 September 2014.
- 9.Gemma S, Brogi S, Novellino E, Campiani G, Maga G, Brindisi M, Butini S. 2014. HCV-targeted antivirals: current status and future challenges. Curr Pharm Des 20:3445–3464. doi: 10.2174/13816128113199990630. [DOI] [PubMed] [Google Scholar]
- 10.Janssen Products LP. November 2013. OLYSIO (simeprevir) prescribing information. http://www.accessdata.fda.gov/drugsatfda_docs/label/2013/205123s001lbl.pdf Accessed 20 September 2014.
- 11.Gilead Sciences Inc. December 2013. SOVALDI (sofosbuvir) prescribing information. http://www.accessdata.fda.gov/drugsatfda_docs/label/2013/204671s000lbl.pdf Accessed 20 September 2014.
- 12.White PW, Llinàs-Brunet M, Amad M, Bethell RC, Bolger G, Cordingley MG, Duan J, Garneau M, Lagacé L, Thibeault D, Kukolj G. 2010. Preclinical characterization of BI 201335, a C-terminal carboxylic acid inhibitor of the hepatitis C virus NS3-NS4A protease. Antimicrob Agents Chemother 54:4611–4618. doi: 10.1128/AAC.00787-10. [DOI] [PMC free article] [PubMed] [Google Scholar]
- 13.Nishiguchi S, Sakai Y, Kuboki M, Tsunematsu S, Urano Y, Sakamoto W, Tsuda Y, Steinmann G, Omata M. 2014. Safety and efficacy of faldaprevir with pegylated interferon alfa-2a and ribavirin in Japanese patients with chronic genotype-1 hepatitis C infection. Liver Int 34:78–88. doi: 10.1111/liv.12254. [DOI] [PubMed] [Google Scholar]
- 14.Sulkowski MS, Asselah T, Lalezari J, Ferenci P, Fainboim H, Leggett B, Bessone F, Mauss S, Heo J, Datsenko Y, Stern JO, Kukolj G, Scherer J, Nehmiz G, Steinmann GG, Böcher WO. 2013. Faldaprevir combined with peginterferon alfa-2a and ribavirin in treatment-naïve patients with chronic genotype-1 HCV: SILEN-C1 trial. Hepatology 57:2143–2154. doi: 10.1002/hep.26276. [DOI] [PubMed] [Google Scholar]
- 15.Sulkowski MS, Bourlière M, Bronowicki JP, Asselah T, Pawlotsky JM, Shafran SD, Pol S, Mauss S, Larrey D, Datsenko Y, Stern JO, Kukolj G, Scherer J, Nehmiz G, Steinmann GG, Böcher WO. 2013. Faldaprevir combined with peginterferon alfa-2a and ribavirin in chronic HCV genotype-1 patients with prior nonresponse: SILEN-C2 trial. Hepatology 57:2155–2163. doi: 10.1002/hep.26386. [DOI] [PubMed] [Google Scholar]
- 16.Ferenci P, Asselah T, Foster GR, Zeuzem S, Sarrazin C, Moreno C, Ouzan D, Maevskaya M, Calinas F, Morano LE, Crespo J, Dufour JF, Bourlière M, Agarwal K, Forton D, Schuchmann M, Zehnter E, Nishiguchi S, Omata M, Stern JO, Datzenko Y, Scherer J, Quinson AM. 2013. Faldaprevir plus pegylated interferon alfa-2a and ribavirin in chronic HCV genotype-1 treatment-naïve patients. J Hepatol 58:S569–S570. doi: 10.1016/S0168-8278(13)61415-4. [DOI] [PubMed] [Google Scholar]
- 17.Zeuzem S, Dufour JF, Buti M, Soriano V, Buynak RJ, Mantry P, Taunk J, Stern JO, Vinisko R, Gallivan JP, Bocher W, Mensa FJ, The SOUND-C3 study group . 2014. Interferon-free treatment of chronic hepatitis C with faldaprevir, deleobuvir, and ribavirin: SOUND-C3, a Phase 2b study. Liver Int doi: 10.1111/liv.12693. [DOI] [PubMed] [Google Scholar]
- 18.Lalezari J, Holland L, Glutzer E, Vig P, Elgadi M, Stern JO, Colonno R, Halfon S, Ruby E, Huang N, Nash E, Brown N. 2014. High rate of sustained virologic response in patients with HCV genotype-1a infection: a Phase 2 trial of faldaprevir, deleobuvir and PPI-668, with and without ribavirin, abstr O65. J Hepatol 60:S27. doi: 10.1016/S0168-8278(14)60067-2. [DOI] [Google Scholar]
- 19.Manns MP, Bourlière M, Benhamou Y, Pol S, Bonacini M, Trepo C, Wright D, Berg T, Calleja JL, White PW, Stern JO, Steinmann G, Yong CL, Kukolj G, Scherer J, Böcher WO. 2011. Potency, safety, and pharmacokinetics of the NS3/4A protease inhibitor BI201335 in patients with chronic HCV genotype-1 infection. J Hepatol 54:1114–1122. doi: 10.1016/j.jhep.2010.08.040. [DOI] [PubMed] [Google Scholar]
- 20.Chen LZ, Rose P, Mao Y, Yong CL, St George R, Huang F, Latli B, Mandarino D, Li Y. 2014. Mass balance and metabolite profiling of steady-state faldaprevir, a hepatitis C NS3/NS4 protease inhibitor, in healthy male subjects. Antimicrob Agents Chemother 58:2369–2376. doi: 10.1128/AAC.02156-13. [DOI] [PMC free article] [PubMed] [Google Scholar]
- 21.Federal Drug Administration. 2010. Pharmacokinetics in patients with impaired renal function—study design, data analysis, and impact on dosing and labeling. Fed Regist 75:13562–13563. [Google Scholar]
- 22.Levey AS, Bosch JP, Lewis JB, Greene T, Rogers N, Roth D. 1999. A more accurate method to estimate glomerular filtration rate from serum creatinine: a new prediction equation. Modification of Diet in Renal Disease Study Group. Ann Intern Med 130:461–470. [DOI] [PubMed] [Google Scholar]
- 23.Jacobson IM, Asselah T, Ferenci P, Foster GR, Jensen DM, Negro F, Mantry P, Wright D, Forns X, Garcia-Samaniego J, Olveira C, Carvalho A, Forton D, Agarwal K, Arastéh K, Cooper C, Ghesquiere W, Dufour J-F, Sakay Y, Tanaka Y, Stern JO, Sha N, Boecher WO, Steinmann G, Quinson AM, the STARTVerso3 Study Group . 2013. STARTVerso3: a randomized, double-blind, placebo-controlled Phase III trial of faldaprevir in combination with pegylated interferon α-2a and ribavirin in treatment-experienced patients with chronic HCV genotype-1 infection. Hepatology 58 (Suppl 1:Abstract 1100. [Google Scholar]
- 24.Dieterich D, Tural C, Nelson M, Arastéh K, Soriano V, Guardiola J, Bhagani S, Rockstroh JK, Stern JO, Quinson AM, the STARTVerso4 Study Group . 2014. Faldaprevir plus pegylated interferon α-2a/ribavirin in HIV/HCV co-infection: STARTVerso4, abstr 1493 The 2014 Conference on Retroviruses and Opportunistic Infections (CROI). [Google Scholar]
- 25.Ho RH, Kim RB. 2005. Transporters and drug therapy: implications for drug disposition and disease. Clin Pharmacol Ther 78:260–277. doi: 10.1016/j.clpt.2005.05.011. [DOI] [PubMed] [Google Scholar]
- 26.Benet LZ, Cummins CL, Wu CY. 2003. Transporter-enzyme interactions: implications for predicting drug-drug interactions from in vitro data. Curr Drug Metab 4:393–398. doi: 10.2174/1389200033489389. [DOI] [PubMed] [Google Scholar]
- 27.Lam JL, Okochi H, Huanh Y, Benet LZ. 2006. In vitro and in vivo correlation of hepatic transporter effects on erythromycin metabolism characterizing the importance of transporter-enzyme interplay. Drug Metab Dispos 34:1336–1344. doi: 10.1124/dmd.106.009258. [DOI] [PubMed] [Google Scholar]
- 28.Nolin TD, Naud J, Leblond FA, Pichette V. 2008. Emerging evidence of the impact of kidney disease on drug metabolism and transport. Clin Pharmacol Ther 83:898–903. doi: 10.1038/clpt.2008.59. [DOI] [PubMed] [Google Scholar]
- 29.Leblond F, Guévin C, Demers C, Pellerin I, Gascon-Barré M, Pichette V. 2001. Downregulation of hepatic cytochrome P450 in chronic renal failure. J Am Soc Nephrol 12:326–332. [DOI] [PubMed] [Google Scholar]
- 30.Leblond FA, Petrucci M, Dubé P, Bernier G, Bonnardeaux A, Pichette V. 2002. Downregulation of intestinal cytochrome p450 in chronic renal failure. J Am Soc Nephrol 13:1579–1585. doi: 10.1097/01.ASN.0000017575.50319.77. [DOI] [PubMed] [Google Scholar]
- 31.Ramsden D, Tweedie DJ, Chan TS, Taub ME, Li Y. 2014. Bridging in vitro and in vivo metabolism and transport of faldaprevir in human using a novel cocultured human hepatocyte system, HepatoPac. Drug Metab Dispos 42:394–406. doi: 10.1124/dmd.113.055897. [DOI] [PubMed] [Google Scholar]
- 32.Ramsden D, Tweedie DJ, St George R, Chen LZ, Li Y. 2014. Generating an in vitro-in vivo correlation for metabolism and liver enrichment of a hepatitis C virus drug, faldaprevir, using a rat hepatocyte model (HepatoPac). Drug Metab Dispos 42:407–414. doi: 10.1124/dmd.113.055947. [DOI] [PubMed] [Google Scholar]
- 33.Grover A, Benet LZ. 2009. Effects of drug transporters on volume of distribution. AAPS J 11:250–261. doi: 10.1208/s12248-009-9102-7. [DOI] [PMC free article] [PubMed] [Google Scholar]
- 34.US Food and Drug Administration. 2013. Simeprevir-clinical pharmacology and biopharmaceutics review(s). http://www.accessdata.fda.gov/drugsatfda_docs/nda/2013/205123Orig1s000ClinPharmR.pdf Accessed 20 September 2014.
- 35.Sane R, Steinmann GG, Huang Q, Li Y, Podila L, Mease K, Olson S, Taub ME, Stern JO, Nehmiz G, Bocher WO, Asselah T, Tweedie D. 2014. Mechanisms underlying benign and reversible unconjugated hyperbilirubinemia observed with faldaprevir administration in HCV patients. J Pharmacol Exp Ther 351:403–412. doi: 10.1124/jpet.114.218081. [DOI] [PubMed] [Google Scholar]
Associated Data
This section collects any data citations, data availability statements, or supplementary materials included in this article.