

Abstract
Objectives
HIV case surveillance is a primary source of information for monitoring HIV burden in the United States and guiding the allocation of prevention and treatment funds. While the number of people living with HIV and the need for surveillance data have increased, little is known about the cost of surveillance. We estimated the economic cost to health departments of conducting high-quality HIV case surveillance.
Methods
We collected primary data on the unit cost and quantity of resources used to operate the HIV case surveillance program in Michigan, where HIV burden (i.e., the number of HIV cases) is moderate to high (n=14,864 cases). Based on Michigan's data, we projected the expected annual HIV surveillance cost for U.S., state, local, and territorial health departments. We based our cost projection on the variation in the number of new and established cases, area-specific wages, and potential economies of scale.
Results
We estimated the annual total HIV surveillance cost to the Michigan health department to be $1,286,524 ($87/case), the annual total cost of new cases to be $108,657 ($133/case), and the annual total cost of established cases to be $1,177,867 ($84/case). Our projected median annual HIV surveillance cost per health department ranged from $210,600 in low-HIV burden sites to $1,835,000 in high-HIV burden sites.
Conclusions
Our analysis shows that a systematic approach to costing HIV surveillance at the health department level is feasible. For HIV surveillance, a substantial portion of total surveillance costs is attributable to maintaining established cases.
An estimated 1.2 million people aged 13 years and older are living with human immunodeficiency virus (HIV) in the United States, and about 47,500 people are infected with the virus each year.1,2 A recent HIV surveillance report shows that the number of people living with HIV increased by 8% from 2006 through 2009.3 The U.S. Centers for Disease Control and Prevention (CDC) has developed an HIV surveillance system for collecting, analyzing, and disseminating accurate information on the number of people with new HIV diagnoses (new cases) and those living with HIV infection (established cases).4,5 Access to timely and high-quality surveillance data is essential to detect trends in the HIV burden and develop appropriate prevention and control measures.4,6,7 The U.S. Department of Health and Human Services has closely aligned the $16 billion it spent in 2010 on HIV care, treatment, and prevention with the number of reported HIV cases in each state.8 HIV case surveillance additionally guides the implementation of test-and-treat prevention strategies that require data on timing of diagnosis, entry into and retention in care, and viral load (VL) suppression.8–10 The Institute of Medicine recently identified HIV case surveillance as one of the data collection systems that could be used to monitor progress in achieving National HIV/AIDS Strategy goals.11,12
The purpose of this analysis was to estimate the economic cost to health departments to conduct high-quality HIV case surveillance, where high quality is defined as meeting or exceeding CDC data quality standards regarding the completeness and timeliness of reporting diagnosed HIV cases and ascertaining duplicate cases and deaths.6,7 We examined potential variation in costs across health departments based on differences in the number of new vs. established HIV cases, area-specific wages, and potential economies of scale. Results from the analysis could help inform surveillance funding allocation across health departments and enable health departments to more accurately assess their own costs attributable to new and established HIV cases.
METHODS
CDC provides federal funding to conduct HIV case surveillance in 59 health departments, including the 50 states, the District of Columbia, six separately funded cities, Puerto Rico, and the Virgin Islands. Federal financial and technical assistance is provided to ensure that health departments conduct HIV surveillance using a standardized framework for collecting complete, timely, and high-quality data.13 While the health departments may provide additional financial support for HIV case surveillance efforts, the level of support varies. Our cost estimate reflects the total economic cost to CDC-funded health departments to conduct HIV case surveillance, regardless of funding source. Another six U.S.-dependent areas, funded under a different mechanism, were not included in this analysis.
The key product of HIV surveillance in the U.S. is an electronic HIV case surveillance record for each infected person (Figure).4,5,14 The surveillance record includes data from clinical and laboratory reports and vital records that provide information on demographics, HIV transmission risk factors, facilities of diagnosis or care, referrals to care and services, HIV-related laboratory results, and clinical and vital records.6,7,14 The data arrive at the health department in hard copies or electronically; the electronic data may be specific to an individual or batched for many people. All HIV case surveillance records are maintained in the Enhanced HIV/AIDS Reporting System (eHARS), a CDC software system developed for HIV surveillance. HIV case surveillance data reported to CDC are stripped of personally identifiable information.
Figure.
Surveillance process and activities involved in HIV case surveillance conducted by U.S. state and local health departments,a and the process and activities used for micro-costing data collection and analysis, 2011

aAscertaining new cases involves searching electronic databases to ensure the case has not already been reported; assigning a state or local identification number; entering information from the case report form on demographics, HIV risk factors, HIV-related laboratory results, and clinical status; contacting the patient's health-care provider for additional information, as needed; and initiating partner services. Updating established cases involves searching the electronic databases to ensure the case has been reported and updating records with patient's contact information, health-care provider information, CD4 counts, viral loads, and occurrence of HIV-related opportunistic infections. Boxes with dotted lines are not part of the cost analysis.
HIV = human immunodeficiency virus
CDC = Centers for Disease Control and Prevention
DHAP = Division of HIV/AIDS Prevention
The health department surveillance staff review incoming clinical and laboratory data and determine if they relate to a new HIV diagnosis or an established case (i.e., a person who has previously been reported and is still alive). To ascertain a new case, the surveillance staff member searches the eHARS database to determine if the case has already been reported. If not, the staff member assigns a state or local identification number; enters information from the case report form on demographics, HIV risk factors, HIV-related laboratory results (e.g., a confirmatory diagnostic test, CD4 counts, and VLs), and clinical status; contacts the reporting health-care facility for additional information, if needed; and initiates partner services. To update an established case, the staff member searches the eHARS database to ensure that the case has already been reported and updates the surveillance record with newly reported information for the patient and health-care provider, including HIV-related laboratory results and occurrence of any HIV-related opportunistic infections or death. For batched data received electronically, data processing involves cleaning the data using SAS® software, editing the data, matching the data with established records or identifying the data as belonging to a new case, and merging the data into established or new case records. Throughout the process, surveillance staff members ensure that the data entered are accurate and complete.
We began our analysis with surveillance data on the number of new HIV cases reported during 2009 and established cases as of December 2009. Using these data, we stratified the health departments funded by CDC to perform HIV case surveillance into HIV burden quintiles based on the number of total HIV cases: low (≤1,768; n=12), low to moderate (1,769–5,703; n=12), moderate (5,704–14,302; n=11), moderate to high (14,303–20,602; n=12), and high (≥20,603; n=12).4 We invited six health departments representing four of the five strata to voluntarily participate in our cost analysis. Although all six health departments agreed to participate and two of them piloted and provided comments on CDC-designed cost collection forms, only one site, the Michigan Department of Community Health (MDCH), a moderate-to-high HIV burden site, completed the form. This analysis is based primarily on micro-costing data provided by the MDCH.
We used micro-costing direct measurement methods to estimate the economic cost that health departments incur to conduct HIV case surveillance.15–21 Micro-costing is a direct enumeration and costing out of every input used in an intervention to generate a particular health outcome (e.g., an electronic HIV case surveillance record for each infected person).17,18 The annual total cost included all fixed and variable costs of the surveillance program. Fixed costs remain constant regardless of the number of cases, and the fixed cost per case decreases as the number of cases increases. This situation arises when the health departments are required to maintain a certain number of staff and other infrastructure to implement the surveillance program, and they are unable to change those inputs during a short time frame. The fixed costs in our analysis included staff time spent on program supervision, general administration, training, and travel. They also included durable items, such as computers, software, equipment, and office space. We based office space costs on the average rental rate of a similar facility in the local market. Total variable costs, which increase in direct proportion to the number of cases, included staff time spent on ascertaining new cases or updating established cases. Variable costs also included office supplies. We collected all cost data from August to November 2011 and annualized them.
To estimate the program cost, we directly measured the unit cost and quantity of each resource used by the MDCH to operate the surveillance program. Surveillance staff recorded in activity logs time spent on ascertaining new HIV cases and updating established cases, based on vital records and the most recent laboratory data (in paper or electronic format). Staff also recorded their time spent on other programmatic activities, including program supervision, coordination, data maintenance, administrative duties, training, and travel. Time spent by each staff person on surveillance activities was multiplied by his or her hourly compensation (wage and fringe benefits) to estimate labor costs. We annuitized equipment costs during the useful life of each piece of equipment using a 3% discount rate.16,18,20 The primary outcomes of our analysis were the health department's annual total program cost, average cost per case overall, and average cost per new and established case. We assessed the variable costs for ascertaining new cases or updating established cases separately, but we assumed the average fixed cost would be the same for new and established cases.
For all of the analyses, we used a health department cost perspective in that we did not include the costs associated with HIV case reporting by health-care facilities to the health departments, or CDC's administrative overhead. All costs were expressed in 2011 U.S. dollars.
Based on the Michigan data, we projected the expected annual surveillance cost of all 59 CDC-funded state, local, and territorial health departments, including Michigan. We based the projection on three steps: (1) assigning the area-specific hourly compensation rates obtained for the other health departments to the number of labor hours calculated for Michigan to estimate the labor cost for each health department; (2) adjusting the fixed cost to account for potential economies of scale among health departments;18,22,23 and (3) identifying the minimum fixed cost of staff time, equipment, and services required for any health department to conduct HIV case surveillance based on CDC's data security and confidentiality guidelines, regardless of HIV burden.
For step 1, we derived hourly wages for the metropolitan area where each health department's surveillance staff was based from the 2011 U.S. Bureau of Labor Statistics (BLS) Occupational Employment Statistics survey.24 We used the median hourly wage from the survey's category for general and operations managers to correspond to surveillance supervisory staff and the median hourly wage for life, physical, and social science workers to correspond to surveillance programmatic staff. In addition, we added a 35% adjustment to the hourly wage, based on information about average fringe benefits for state and local government workers in health-care and social assistance occupations obtained from the 2011 BLS National Compensation Survey: Employer Cost for Employee Compensation.20,25,26
For step 2, using Michigan as a reference case, we adjusted the fixed cost per case to account for potential economies of scale in health departments operating in areas with higher or lower HIV burden. Economies of scale occur when the average cost per HIV case record decreases as the total number of cases increases due to a larger scale of operation. Economies of scale can result from spreading fixed costs over a greater number of cases, more efficient use of labor or equipment, and health departments' ability to use specialized surveillance processes.18,22 Given the lack of data on economies of scale in HIV surveillance, we based our scale assumption on expert judgment, and we adjusted fixed costs only. Fixed costs for Michigan and other moderate-to-high HIV burden states were unadjusted. For the high burden areas, we halved the fixed cost per case, assuming potential economies of scale. For the moderate, low-to-moderate, and low burden sites, we increased fixed costs per case by 50% per strata, assuming less economies of scale. Compared with Michigan, the adjustment in fixed costs worked out to be a 50% increase in moderate burden areas, a 125% increase in low-to-moderate burden areas, and a 238% increase in low burden areas. In a sensitivity analysis, we estimated the fixed costs without adjusting for economies of scale.
For step 3, to estimate the minimum fixed cost, we identified the equipment, office space, technology, and staff time required to conduct HIV surveillance, regardless of HIV burden. The equipment included a computer, fax and copier, and shredder; the office space was conservatively assumed to be 150 square feet; and the technology included an eHARS server, an SQL server, server maintenance, anti-virus software, and phone and Internet services. We included 20 hours/week of programmatic staff time as a minimum for labor. We applied these labor and non-labor minimum fixed costs to all sites, regardless of HIV burden. These minimum costs were separate from the other fixed costs per case described in step 2. They were the same for each health department except for differences in wage rates applied to the 20 hours a week of programmatic staff time.
We estimated the total surveillance program cost for each health department by multiplying the fixed cost, adjusted for economies of scale, and variable cost per new and established HIV case by the number of new and established HIV cases reported by each health department, and adding it to the minimum cost for each health department.
RESULTS
A total of 14,864 HIV cases were reported to the Michigan health department as of 2009, of which 818 (6%) were newly reported cases and 14,046 (94%) were established cases. We estimated the annual surveillance program cost in Michigan to be $1,286,524 ($87/case), with 92% of the cost allocated to established HIV cases. The total cost per case was $133 for each new case and $84 for each established case (Table 1).
Table 1.
Summary of HIV surveillance cases, annual total program cost, and cost per case using micro-costing data collected from August to November 2011 in Michigan
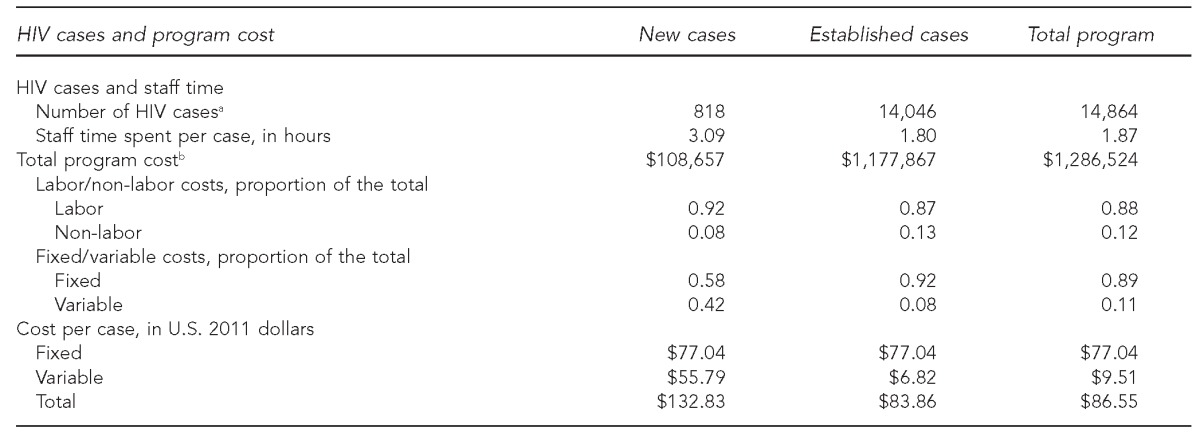
aSurveillance data represent new HIV cases reported during 2009 and established cases as of December 2009 based on: Centers for Disease Control and Prevention (US). Diagnoses of HIV infection and AIDS in the United States and dependent areas, 2010. HIV Surveill Rep 2012;22:1-79.
bIncludes the fixed minimum costs. All costs are expressed in 2011 U.S. dollars.
HIV = human immunodeficiency virus
In Michigan, the majority (88%) of the surveillance cost was attributable to labor costs, and those costs were largely fixed (i.e., related to administration, coordination, supervision, or data maintenance). Fixed costs per case were assumed to be the same ($77) for new and established cases, but variable costs were higher for new cases ($56) than for established cases ($7, Table 1). Higher variable costs per new case were attributable to the average of 1.42 hours per case spent determining if a new case had been previously reported (Table 2). Health department staff spent an average of 0.02 hours (one minute) per case on paper-based laboratory data processing, which included CD4 counts, VLs, and confirmatory diagnostic tests, while they spent only 0.003 hours (0.2 minutes) per case processing the batched data received electronically.
Table 2.
Variable and fixed costs of HIV surveillance in Michigan, by program activity, using micro-costing data collected from August to November 2011
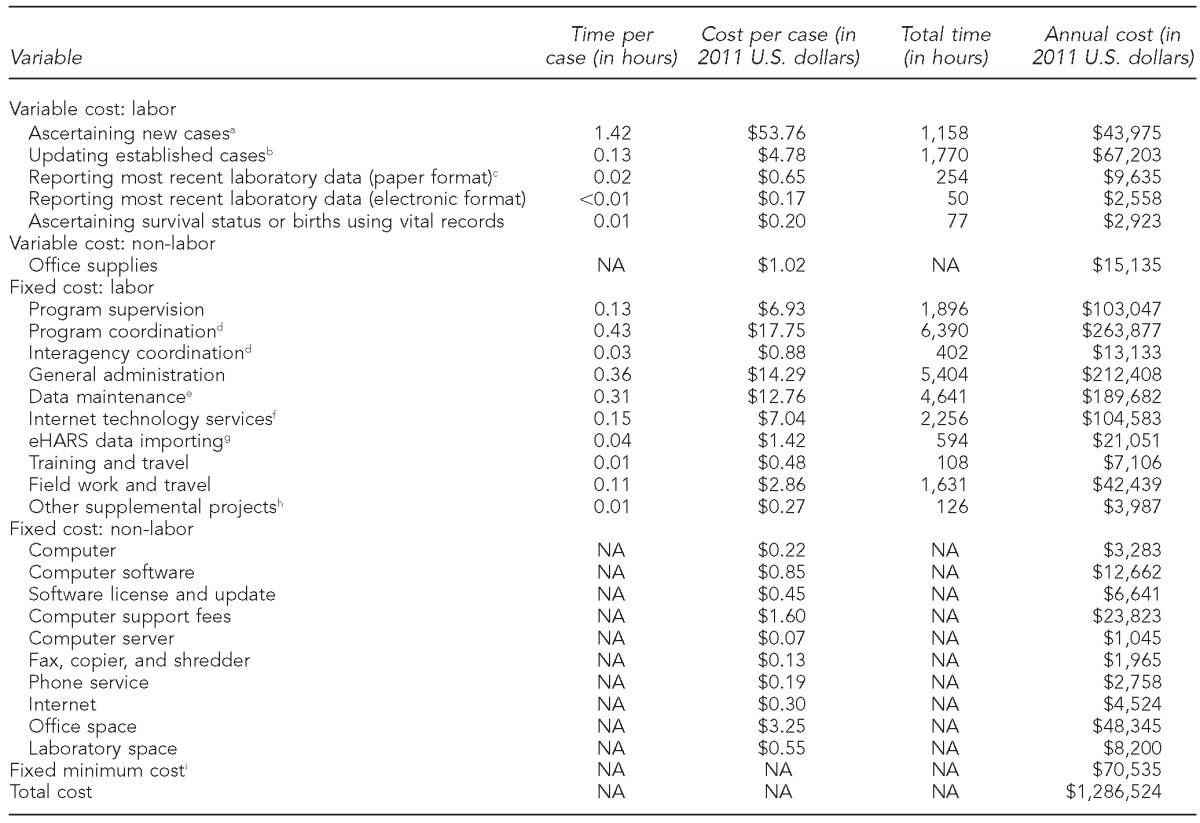
aAscertaining new cases involves searching electronic databases to ensure the case has not already been reported; assigning a state or local identification number; entering information from the case report form on demographics, HIV risk factors, HIV-related laboratory results, and clinical status; contacting the patient's health-care provider for additional information, as needed; and initiating partner services.
bUpdating established cases involves searching the electronic databases to ensure the case has been reported and updating records with patient's contact information, health-care provider information, CD4 counts, viral loads, and occurrence of HIV-related opportunistic infections.
cLaboratory data included the reporting for CD4 counts, viral loads, and confirmatory diagnostic test. The total time (e.g., 254 hours) included staff time spent on adding only the most recent laboratory data in the surveillance records. For consistency in the analysis, we calculated the average time per case by dividing the total time by the total number of cases (14,864).
dProgram coordination included planning, reporting, accounting, and budgeting; interagency coordination included information sharing with sexually transmitted disease clinics and other health-care providers.
eData maintenance included data processing, cleaning, quality assurance, and out-of-state/routine interstate duplicate review.
fInternet technology service included server maintenance and data security.
geHARS is a browser-based HIV surveillance system deployed by state and local health departments; the server cost was included in the fixed minimum cost.
hOther supplemental projects included geographic information system and variant, atypical, and resistant HIV surveillance.
iIncluded the basic minimum cost of labor (20 hours/week), a computer, fax and copier, shredder, office space (150 square feet), eHARS and SQL servers, server maintenance, anti-virus software, and phone and Internet services
HIV = human immunodeficiency virus
eHARS = Enhanced HIV/AIDS Reporting System
NA = not applicable
Projecting the annual cost of HIV surveillance for all 59 health departments in the U.S. from the Michigan micro-costing data, we estimated that the median annual cost per health department by HIV burden level ranged from $210,600 (low HIV burden) to $1,835,000 (high HIV burden) (Table 3). In a sensitivity analysis, when we estimated the cost without adjusting for the economies of scale, the median cost per health department ranged from $112,500 to $3,223,300 (data not shown). Our cost projection accounted for the relatively higher cost borne by health departments with a higher proportion of new HIV cases.
Table 3.
Median number of HIV cases and median projected surveillance program cost per health department per year, by HIV burden level: 50 U.S. states, the District of Columbia, six separately funded cities, Puerto Rico, and the Virgin Islands, based on micro-costing data collected from August to November 2011 in Michigan
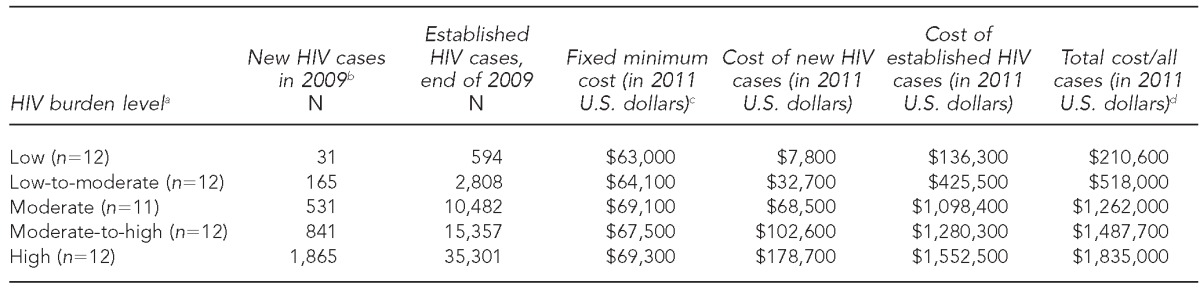
aHIV burden level (quintile range of total HIV cases): low (≤1,768), low-to-moderate (1,769–5,703), moderate (5,704–14,302), moderate-to-high (14,303–20,602), and high (≥20,603).
bSurveillance data represent new HIV cases reported during 2009 and established cases as of December 2009 based on: Centers for Disease Control and Prevention (US). Diagnoses of HIV infection and AIDS in the United States and dependent areas, 2010. HIV Surveill Rep 2012;22:1-79.
cCost projection based on micro-costing data collected from Michigan from August to November 2011, and adjustment on fixed costs for potential economies of scale for low-and high-burden states compared with Michigan.
dMedian costs at each HIV burden level, not the sum of the costs reported in the three preceding columns
HIV = human immunodeficiency virus
In Michigan, where no adjustments for the economies of scale were required, we estimated the projected cost to be $1,245,600, which is slightly lower (–3%) than the actual reported program cost. The variation between the actual cost derived from micro-costing and the projected cost was solely due to the differences in hourly wage and benefits of the staff as reported by the surveillance program and the BLS. We estimated the projected fixed minimum cost of the surveillance program in Michigan to be $66,800 (actual cost = $70,535) (data not shown). The estimated median fixed minimum cost in other health departments ranged from $63,000 in low HIV burden sites to $69,300 in high HIV burden sites, with the variation due to the differences in the area-specific wages reported by the BLS (Table 3).
DISCUSSION
We estimated the cost to U.S. health departments of conducting high-quality HIV case surveillance, accounting for the number of new and established cases, area-specific wages, and potential economies of scale. The median cost per health department ranged from $210,600/year in low HIV burden areas to $1,835,000/year in high HIV burden areas. To our knowledge, this study is the first to comprehensively estimate the resources required to conduct HIV surveillance in U.S. state, local, and territorial health departments.
In Michigan, we found that a large proportion of total costs (92%) are related to updating records for established cases. As the number of established cases increases, with more intense focus on expanded HIV screening, early diagnosis, monitoring of care, and HIV VL suppression, surveillance costs are likely to increase as well.4 However, we also showed that the surveillance cost of a new HIV case is 58% higher than that of an established case because identifying and documenting a new case takes extra time. This finding suggests that health departments with a higher proportion of new cases might incur greater costs compared with health departments that have a lower proportion of new cases.
In recent years, health departments have emphasized the electronic reporting of surveillance data, particularly data received in batches from the testing laboratories and health-care facilities.6,27,28 In Michigan, more than half of the surveillance data were received electronically, and our results indicate that those data can be added to an HIV surveillance record at a fraction of the cost of data arriving on paper. Although CDC encourages health departments to make greater use of electronic reports, much variation exists among health departments concerning current levels of use. We did not account for this variation; we assumed the same degree of electronic reporting in other states as in Michigan. Greater or lesser use of electronic reporting could decrease or increase total health department surveillance costs.
Although disease surveillance is critical to public health,29,30 few studies have attempted to measure how much it costs for health departments to conduct surveillance.31–35 For HIV surveillance, one study reported on the funding per case of HIV in the U.S., based on health departments' reported expenditures.27 These expenditures, or budgetary data, do not necessarily equal cost data collected through micro-costing techniques because budgetary data may include unrelated costs, such as those for research, or exclude relevant costs (e.g., when the program was partially funded by the agency from whose perspective the cost analysis was conducted), and the analysis accounted for all of the surveillance cases.15
Limitations
Our analysis was subject to several limitations. We developed a systematic approach to estimate health department costs for conducting HIV case surveillance based on empirical data obtained from one micro-costing study. However, our projected costs for other health departments accounted for area-specific variation in wages, potential economies of scale among surveillance programs, and differences in the number of new vs. established HIV cases. Additional micro-costing data will be needed to validate our estimate of the surveillance cost of other health departments. Because we used a health department cost perspective, our analysis excluded the costs potentially incurred by health-care facilities while reporting HIV cases to the health departments and also CDC's administrative overhead. Thus, the societal cost of HIV case surveillance could be much higher than our estimate.
CONCLUSIONS
Our analysis showed that a systematic approach to costing public health surveillance activities is feasible and micro-costing methods can estimate the cost of surveillance. Our findings may help guide future allocation of HIV surveillance funds across health departments and assist health departments in estimating their own costs.
Although surveillance is a crucial part of public health prevention planning and priority setting, limited information is available on how much it costs health departments to conduct high-quality HIV surveillance. Additionally, little is known about how those costs vary depending on the HIV epidemic characteristics in each health department area. We provide an approach to estimating the health department costs of conducting high-quality HIV surveillance in the U.S. As HIV prevention increasingly depends on the availability of data on diagnosis, linkage to care, initiation of treatment, and VL suppression, providing high-quality surveillance data will continue to be an important part of our national effort to control HIV.
Footnotes
The authors thank the health department managers and staff who participated in the study design, piloted cost forms, and provided surveillance cost data.
The data analyses in this study were based on human immunodeficiency virus surveillance data. Public health disease surveillance activities are not considered research; therefore, institutional review board review was not required. The findings and conclusions in this article are those of the authors and do not necessarily represent the views of the Centers for Disease Control and Prevention.
REFERENCES
- 1.Centers for Disease Control and Prevention (US) Estimated HIV incidence in the United States, 2007–2010. HIV Surveill Suppl Rep. 2012;17:1–26. [Google Scholar]
- 2.Torian L, Chen M, Rhodes P, Hall HI. HIV surveillance—United States, 1981–2008 [published erratum appears in MMWR Morb Mortal Wkly Rep 2011;60(25):852] MMWR Morb Mortal Wkly Rep. 2011;60(21):689–93. [Google Scholar]
- 3.Centers for Disease Control and Prevention (US) Monitoring selected national HIV prevention and care objectives by using HIV surveillance data—United States and 6 U.S. dependent areas—2010. HIV Surveill Suppl Rep. 2012;17:1–47. [Google Scholar]
- 4.Centers for Disease Control and Prevention (US) Diagnoses of HIV infection and AIDS in the United States and dependent areas, 2010. HIV Surveill Rep. 2012;22:1–79. [Google Scholar]
- 5.Centers for Disease Control and Prevention (US) HIV surveillance supported by the Division of HIV/AIDS Prevention [cited 2014 Jun 6] Available from: URL: http://www.cdc.gov/hiv/statistics/recommendations/publications.html.
- 6.Hall HI, Mokotoff ED Advisory Group for Technical Guidance on HIV/AIDS Surveillance. Setting standards and an evaluation framework for human immunodeficiency virus/acquired immunodeficiency syndrome surveillance. J Public Health Manag Pract. 2007;13:519–23. doi: 10.1097/01.PHH.0000285206.79082.cd. [DOI] [PubMed] [Google Scholar]
- 7.Hall HI, Song R, Gerstle JE, 3rd, Lee LM HIV/AIDS Reporting System Evaluation Group. Assessing the completeness of reporting of human immunodeficiency virus diagnoses in 2002–2003: capture-recapture methods. Am J Epidemiol. 2006;164:391–7. doi: 10.1093/aje/kwj216. [DOI] [PubMed] [Google Scholar]
- 8.Mansergh G, Valdiserri RO, Yakovchenko V, Koh H. Aligning resources to fight HIV/AIDS in the United States: funding to states through the US Department of Health and Human Services. J Acquir Immune Defic Syndr. 2012;59:516–22. doi: 10.1097/QAI.0b013e318245cc05. [DOI] [PubMed] [Google Scholar]
- 9.Bertolli J, Shouse RL, Beer L, Valverde E, Fagan J, Jenness SM, et al. Using HIV surveillance data to monitor missed opportunities for linkage and engagement in HIV medical care. Open AIDS J. 2012;6:131–41. doi: 10.2174/1874613601206010131. [DOI] [PMC free article] [PubMed] [Google Scholar]
- 10.Gray KM, Kajese T, Crandell-Alden E, Anderson BJ, Wendell D, Crutchfield A, et al. Enhanced collection of laboratory data in HIV surveillance among 5 states with confidential name-based HIV infection reporting, 2005–2006. Open AIDS J. 2012;6:90–7. doi: 10.2174/1874613601206010090. [DOI] [PMC free article] [PubMed] [Google Scholar]
- 11.Institute of Medicine. Monitoring HIV care in the United States: indicators and data systems. Washington: National Academies Press; 2012. [PubMed] [Google Scholar]
- 12.White House (US), Office of National AIDS Policy. National HIV/AIDS strategy for the United States. 2010. [cited 2014 Jun 6]. Available from: URL: http://www.whitehouse.gov/administration/eop/onap/nhas.
- 13.Centers for Disease Control and Prevention (US) Technical guidance for HIV/AIDS surveillance programs, volume I: policies and procedures. Atlanta: CDC; 2005. [Google Scholar]
- 14.Schneider E, Whitmore S, Glynn KM, Dominguez K, Mitsch A, McKenna MT. Revised surveillance case definitions for HIV infection among adults, adolescents, and children aged <18 months and for HIV infection and AIDS among children aged 18 months to <13 years—United States, 2008. MMWR Recomm Rep. 2008;57(RR-10):1–12. [PubMed] [Google Scholar]
- 15.Shrestha RK, Sansom SL, Farnham PG. Comparison of methods for estimating the cost of human immunodeficiency virus-testing interventions. J Public Health Manag Pract. 2012;18:259–67. doi: 10.1097/PHH.0b013e31822b2077. [DOI] [PubMed] [Google Scholar]
- 16.Drummond M, McGuire A. Economic evaluation in health care: merging theory with practice. New York: Oxford University Press; 2001. [Google Scholar]
- 17.Frick KD. Micro-costing quantity data collection methods. Med Care. 2009;47(7 Suppl 1):S76–81. doi: 10.1097/MLR.0b013e31819bc064. [DOI] [PMC free article] [PubMed] [Google Scholar]
- 18.Gold MR, Siegel JE, Russell LB, Weinstein MC. Cost-effectiveness in health and medicine. New York: Oxford University Press; 1996. [Google Scholar]
- 19.Gorsky RD. A method to measure the costs of counseling for HIV prevention. Public Health Rep. 1996;111(Suppl 1):115–22. [PMC free article] [PubMed] [Google Scholar]
- 20.Haddix AC, Teutsch SM, Corso PS. Prevention effectiveness: a guide to decision analysis and economic evaluation. 2nd ed. New York: Oxford University Press; 2003. [Google Scholar]
- 21.Smith MW, Barnett PG. Direct measurement of health care costs. Med Care Res Rev. 2003;60(3 Suppl):74S–91S. doi: 10.1177/1077558703257001. [DOI] [PubMed] [Google Scholar]
- 22.Long MJ, Ament RP, Dreachslin JL, Kobrinski EJ. A reconsideration of economies of scale in the health care field. Health Policy. 1985;5:25–44. doi: 10.1016/0168-8510(85)90064-8. [DOI] [PubMed] [Google Scholar]
- 23.Folland S, Goodman AC, Stano M. The economics of health and health care. New Jersey: Prentice Hall, Inc.; 1997. [Google Scholar]
- 24.Census Bureau (US) Occupational employment statistics. Washington: Bureau of Labor Statistics (US); 2012. Also available from: URL: http://www.bls.gov/oes/oes_emp.htm [cited 2014 Jun 6] [Google Scholar]
- 25.Census Bureau (US) Employer costs of employee compensation, March 2011. Washington: Bureau of Labor Statistics (US); 2012. Also available from: URL: http://www.bls.gov/news.release/archives/ecec_06082011.pdf [cited 2014 Jun 6] [Google Scholar]
- 26.Grosse SD, Krueger KV, Mvundura M. Economic productivity by age and sex: 2007 estimates for the United States. Med Care. 2009;47(7 Suppl 1):S94–103. doi: 10.1097/MLR.0b013e31819c9571. [DOI] [PubMed] [Google Scholar]
- 27.Page MJ, Harrison KM, Wei X, Hall HI. Federal funding for reporting cases of HIV infection in the United States, 2006. Public Health Rep. 2010;125:718–27. doi: 10.1177/003335491012500514. [DOI] [PMC free article] [PubMed] [Google Scholar]
- 28.Murawaski L. Maximizing federal funds for HIV/AIDS: improving surveillance and reporting. Sacramento (CA): Legislative Analyst's Office; 2010. [Google Scholar]
- 29.Nsubuga P, White ME, Thacker SB, Anderson MA, Blount SB, Broome CV, et al. Public health surveillance: a tool for targeting and monitoring interventions. In: Jamison DT, Breman JG, Measham AR, Alleyne G, Claeson M, Evans DB, et al., editors. Disease control priorities in developing countries. 2nd ed. Washington: World Bank; 2006. pp. 997–1015. [Google Scholar]
- 30.Smith PF, Hadler JL, Stanbury M, Rolfs RT, Hopkins RS CSTE Surveillance Strategy Group. “Blueprint version 2.0”: updating public health surveillance for the 21st century. J Public Health Manag Pract. 2013;19:231–9. doi: 10.1097/PHH.0b013e318262906e. [DOI] [PubMed] [Google Scholar]
- 31.Elbasha EH, Fitzsimmons TD, Meltzer MI. Costs and benefits of a subtype-specific surveillance system for identifying Escherichia coli O157:H7 outbreaks. Emerg Infect Dis. 2000;6:293–7. doi: 10.3201/eid0603.000310. [DOI] [PMC free article] [PubMed] [Google Scholar]
- 32.Hinds MW, Skaggs JW, Bergeisen GH. Benefit-cost analysis of active surveillance of primary care physicians for hepatitis A. Am J Public Health. 1985;75:176–7. doi: 10.2105/ajph.75.2.176. [DOI] [PMC free article] [PubMed] [Google Scholar]
- 33.Somda ZC, Meltzer MI, Perry HN, Messonnier NE, Abdulmumini U, Mebrahtu G, et al. Cost analysis of an integrated disease surveillance and response system: case of Burkina Faso, Eritrea, and Mali. Cost Eff Resour Alloc. 2009;7:1. doi: 10.1186/1478-7547-7-1. [DOI] [PMC free article] [PubMed] [Google Scholar]
- 34.Vogt RL, LaRue D, Klaucke DN, Jillson DA. Comparison of an active and passive surveillance system of primary care providers for hepatitis, measles, rubella, and salmonellosis in Vermont. Am J Public Health. 1983;73:795–7. doi: 10.2105/ajph.73.7.795. [DOI] [PMC free article] [PubMed] [Google Scholar]
- 35.Morris S, Gray A, Noone A, Wiseman M, Jathanna S. The costs and effectiveness of surveillance of communicable disease: a case study of HIV and AIDS in England and Wales. J Public Health Med. 1996;18:415–22. doi: 10.1093/oxfordjournals.pubmed.a024539. [DOI] [PubMed] [Google Scholar]