

Abstract
Current tools for monitoring response to tuberculosis treatments have several limitations. Noninvasive biomarkers could accelerate tuberculosis drug development and clinical studies, but to date little progress has been made in developing new imaging technologies for this application. In this study, we developed pulmonary single-photon emission computed tomography (SPECT) using radioiodinated DPA-713 to serially monitor the activity of tuberculosis treatments in live mice, which develop necrotic granulomas and cavitary lesions. C3HeB/FeJ mice were aerosol infected with Mycobacterium tuberculosis and administered either a standard or a highly active bedaquiline-containing drug regimen. Serial 125I-DPA-713 SPECT imaging was compared with 18F-fluorodeoxyglucose (18F-FDG) positron emission tomography (PET) and standard microbiology. Ex vivo studies were performed to characterize and correlate DPA-713 imaging with cellular and cytokine responses. Pulmonary 125I-DPA-713 SPECT, but not 18F-FDG PET, was able to correctly identify the bactericidal activities of the two tuberculosis treatments as early as 4 weeks after the start of treatment (P < 0.03). DPA-713 readily penetrated the fibrotic rims of necrotic and cavitary lesions. A time-dependent decrease in both tumor necrosis factor alpha (TNF-α) and interferon gamma (IFN-γ) levels was observed with treatments, with 125I-DPA-713 SPECT correlating best with tissue TNF-α levels (ρ = 0.94; P < 0.01). 124I-DPA-713 was also evaluated as a PET probe and demonstrated a 4.0-fold-higher signal intensity in the infected tuberculous lesions than uninfected controls (P = 0.03). These studies provide proof of concept for application of a novel noninvasive imaging biomarker to monitor tuberculosis treatments, with the potential for application for humans.
INTRODUCTION
Recognizing that tuberculosis (TB) is still a leading cause of human death from a curable disease, the international health community has set an ambitious target to eliminate TB by 2050. However, using mathematical modeling, Dye and Williams at the World Health Organization have shown that while most TB patients can be cured with current drug treatments, the 2050 target cannot be achieved with current tools and requires a combination of new diagnostics, shorter TB drug treatments, and new vaccines (1). However, current tools for evaluating TB therapeutics have several limitations. Conventional preclinical studies are limited to analysis of serial postmortem samples using microbiologic methods that take 3 to 4 weeks for results. Moreover, different groups of animals are sacrificed over several time points during the study, and therefore, assessments of disease in the same animal can never be made. Similar limitations exist for monitoring TB treatments in humans. The standard 8-week sputum culture conversion is not available in real time, taking several weeks for results. Even though nucleic acid amplification tests such as GeneXpert provide results rapidly (2), both sputum culture and GeneXpert are subject to sampling bias and provide information only about the lesions communicating with the airways. Noncommunicating pulmonary or extrapulmonary lesions are often never assessed. Similarly, assessment for relapse can require monitoring hundreds of patients for up to 2 years after treatment completion. With increasing rates of multidrug-resistant, extensively drug-resistant, and totally drug-resistant TB (3, 4), it is imperative to develop even better tools to monitor treatment responses and predict relapse.
Noninvasive imaging provides rapid, three-dimensional views of the whole body, as well as the ability to monitor disease in the same individual. Real-time, longitudinal assessments can also provide new insights into the pathophysiology of disease, which may be difficult to assess with current technologies. Computed tomography (CT) and 18F-fluorodeoxyglucose (18F-FDG) positron emission tomography (PET) are being increasingly used to monitor TB (5–8), in both preclinical and clinical settings. However, both CT and 18F-FDG PET lack specificity, and 18F-FDG is taken up by all glycolytically active tissues (9–11). Since activated macrophages are key components of TB-associated inflammation, macrophage-avid tracers could serve as more specific imaging agents.
The translocator protein (TSPO) is an 18-kDa trans-mitochondrial membrane channel utilized for transport of cholesterol and other endogenous ligands (12). TSPO expression is high in several tissues and in activated immune cells such as microglia and macrophages (13). We have previously demonstrated that radioiodinated DPA-713, a low-molecular-weight pyrazolopyrimidine ligand for TSPO, specifically accumulates in activated phagocytic cells in Mycobacterium tuberculosis-induced inflammatory lesions and is more specific than 18F-FDG PET in mice (14). In this study, we utilized serial 125I-DPA-713 single-photon emission computed tomography (SPECT) to monitor the activity of a novel, bedaquiline-containing TB drug regimen being developed against multidrug-resistant (MDR) TB (15) in live mice that develop necrotic and hypoxic TB lesions (16, 17). Ex vivo studies were performed to characterize and correlate DPA-713 imaging with cellular and cytokine responses in different TB lesions, including cavities.
MATERIALS AND METHODS
All protocols were approved by the Johns Hopkins Biosafety, Radiation Safety, and Animal Care and Use Committees.
Animal infection and treatments.
Four- to six-week-old female C3HeB/FeJ (Jackson Laboratory, Bar Harbor, ME) mice were aerosol infected with frozen stocks of M. tuberculosis H37Rv, using the Middlebrook inhalation exposure system (Glas-Col, Terre Haute, IN). Six weeks after infection, mice were randomly divided into treatment groups and orally administered (5 days per week) either the standard RHZ (rifampin, 10 mg/kg; isoniazid, 10 mg/kg; pyrazinamide, 150 mg/kg) or a highly active JZC (bedaquiline, 25 mg/kg; pyrazinamide, 150 mg/kg; clofazimine, 20 mg/kg) regimen for 12 and 8 weeks, respectively (Fig. 1). All TB drugs were obtained from Sigma (St. Louis, MO) except bedaquiline (>98% chemical purity), which was purchased from Adooq Bioscience LLC (Irvine, CA). Mice were sacrificed to determine the bacillary burden 1 day after infection and at each time point (14). Both sides of the lungs were homogenized in 1 ml of phosphate-buffered saline, serially diluted, and plated onto Middlebrook 7H11 selective plates (Becton Dickinson, Franklin Lakes, NJ) to determine CFU per ml. Five mice were used for each group and at each time point, except at the 4-week time point for the untreated group, where only 4 mice were used. A separate group of identically infected mice were used for imaging studies. A cohort of mice (n = 13) receiving the standard (RHZ) treatment were also followed for 16 weeks after cessation of treatment and sacrificed to determine the pulmonary bacterial burden (entire lungs) at the final time point.
FIG 1.
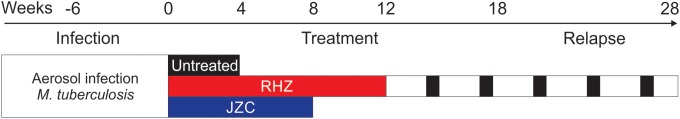
Timeline and experimental scheme. Six weeks after aerosol infection with Mycobacterium tuberculosis, mice were randomly divided into treatment groups. Different animal cohorts received either the standard (RHZ) or a highly active bedaquiline-containing regimen (JZC). Animals receiving standard treatment were also followed for 16 weeks after the completion of treatment to monitor for relapse. Mice were serially imaged at weeks 0, 4, 8, and 12 to assess the bactericidal activity. A separate cohort of 13 animals which received 12 weeks of standard (RHZ) treatment were followed for the development of relapse and imaged at weeks 18 and 28 (6 and 16 weeks after cessation of TB treatment). The pulmonary bacterial burdens from a separate cohort of similarly infected and treated mice were determined using standard microbiology at each time point.
Imaging.
125I-DPA-713 was synthesized in-house as described previously with >99% radiochemical purity and specific activities ranging from 66,600 to 77,700 GBq/mmol (18). Live M. tuberculosis-infected animals were imaged within a sealed biocontainment bed (Minerve, Esternay, France) modified in-house to comply with biosafety level 3 (BSL-3) containment (5, 19). Filters (0.22 μm; GE Whatman, Pittsburgh, PA) were used at both the inlet and the outlet to contain the bacteria within the device. Animals were anesthetized and sealed inside the biocontainment device in the BSL-3 facility. A standard small-animal anesthesia machine was used to deliver an isoflurane (Henry Schein, Melville, NY)-oxygen mixture during transport and imaging. Prior to imaging, mice were fasted for 8 h. Each animal was weighed, injected intravenously with 7.3 MBq of 18F-FDG and 37 MBq of 125I-DPA-713 simultaneously via tail vein, and imaged 45 min and 24 h after the intravenous injection, using a Mosaic HP PET (Philips, Bothell, WA) and NanoSPECT/CT (Bioscan, Washington, DC) small-animal imager, respectively (PET, SPECT, and CT imaging of each animal at each time point). The same group of mice was imaged over several time points (outlined in Fig. 1). To prevent “cross talk” between PET and SPECT, 18F-FDG PET was performed 45 min after injection on the first day. Due to its short half-life (109 min), 18F decays completely by 24 h, when the 125I-DPA-713 SPECT was performed. Also, the primary energies of 125I (maximum of 35 keV) are much lower than those of 18F (all PET tracers emit at 511 keV, resulting from electron-positron annihilation); photons from 125I are excluded from the PET scan. Five mice were imaged for each group and at each time point except at week 0, when four mice were imaged (untreated group). Images were reconstructed and coregistered with computed tomography (CT) images using AMIDE 1.0.4 (http://amide.sourceforge.net). Standardized uptake values (SUV) were computed as described previously (14). Briefly, by using the coregistered CT images as a reference, spherical (9-mm3 volume) regions of interest (ROIs) were drawn around three randomly selected pulmonary lesions, making sure not to overlap the surrounding PET-active bone marrow or heart, creating 15 ROIs per group for each time point. These ROIs were applied to the coregistered SPECT and PET images. Since each spherical ROI contains both full and partial voxels depending on the orientation, correction for partial volume effects was applied to all imaging data using AMIDE. This is considered standard for image analyses. The SUV data are presented as a percentage of the signal noted at the initial time point (start of treatment).
Histology and immunofluorescence.
DPA-713-IRDye680LT was administered to M. tuberculosis-infected mice (8 weeks after infection; no TB treatment) intravenously 24 h prior to euthanasia, and lungs were processed as described previously (14). Paraffin-embedded formalin-fixed tissue sections were probed using fluorescent antibodies (see Table S1 in the supplemental material). A Nikon 80i upright epifluorescence microscope (Nikon Instruments, Melville, NY) equipped with a Nikon DS-Qi1Mc dark-field charge-coupled device (CCD) camera and Nikon Intensilight C-HGFI lamp was used. All images were recorded and processed using Nikon Imaging software elements.
Flow cytometry.
DPA-713-IRDye680LT and brefeldin A (Sigma) were administered to a separate group of M. tuberculosis-infected mice (8 weeks after infection; no TB treatment) intravenously 24 and 6 h prior to euthanasia, respectively, as described previously (14, 20). Lungs were harvested and processed as described previously (21). Briefly, cells (2 × 10⁶ cells/well) were incubated with cell phenotype-specific markers (see Table S1 in the supplemental material) in the presence of anti-FcRII/III antibody (1.3 μg/ml) at 4°C for 1 h. Thereafter, cells were washed, fixed, and permeabilized for intracellular cytokine staining. Samples were analyzed on a LSR-II instrument (BD, San Jose, CA), and data were analyzed using FACSDiva v5.0.1 software (BD). The gating strategy for these analyses is shown in Fig. S1 in the supplemental material. A minimum of 10,000 events were acquired within each cell-specific gate. Samples from five different mice were utilized for these assays.
Cytokine estimation.
Whole-lung homogenates from mice receiving TB treatments were frozen at −80°C. Samples were thawed and filter sterilized to remove tissue and bacterial debris. Tumor necrosis factor alpha (TNF-α) and interferon gamma (IFN-γ) were assayed by using an enzyme-linked immunosorbent assay (ELISA) kit (R & D Systems, Minneapolis, MN). Protein content was estimated by using the Bradford assay. The cytokine concentrations are expressed as pg per mg of total protein. Samples from four different mice were utilized for each group and at each time point.
124I-DPA-713 PET imaging.
Clinical-grade 124I-DPA-713 was synthesized using current good manufacturing practices (cGMP) under a research contract (3D Imaging, Maumelle, AR). Each mouse was weighed, injected intravenously with 13.5 MBq of 124I-DPA-713 (>95% radiochemical purity; specific activity, 96,089 GBq/mmol), and imaged 24 h later using the Mosaic HP PET. Five mice were imaged for each group. Image analyses were performed as described above.
Statistical analysis.
Statistical comparisons were performed using a two-tailed Mann-Whitney U or Kruskal-Wallis (for multiple comparisons) test and Spearman's rank correlation (GraphPad Software Inc., La Jolla, CA). P values of <0.05 were considered statistically significant.
RESULTS
Pulmonary M. tuberculosis bacillary burdens 1 day and 6 weeks (time of initiation of TB treatments) after infection were 2.00 ± 0.13 and 8.05 ± 0.02 log10 CFU/ml, respectively.
125I-DPA-713 SPECT imaging correlates with bactericidal activity of TB treatments.
We evaluated serial 125I-DPA-713 SPECT imaging to measure the response to a novel, bedaquiline-containing TB drug regimen (JZC). 125I-DPA-713 SPECT was compared with 18F-FDG PET imaging and standard microbiology. M. tuberculosis-infected mice were serially imaged, generating 102 image sets (SPECT, PET, and CT). In agreement with the previously reported higher bactericidal activity of bedaquiline-containing regimens (22), 8 weeks of treatment with JZC cleared the infection in the majority of mice, versus 12 weeks required to achieve the same bacterial killing with the standard (RHZ) treatment (Fig. 2A). Pulmonary 125I-DPA-713 SPECT activity correlated well with the decrease in the pulmonary bacterial burden (Spearman's ρ = 0.92; P < 0.01). Although 18F-FDG PET could rapidly distinguish treated versus untreated animals (P < 0.01), it was unable to correctly identify the bactericidal activities of the two TB treatments (P > 0.49) (Fig. 2B). In contrast, pulmonary 125I-DPA-713 SPECT activity not only was able to rapidly distinguish the treated versus untreated groups (P < 0.01) but also correctly identified the bactericidal activities of the two TB regimens as early as 4 weeks after the start of treatment (P < 0.03) (Fig. 2C).
FIG 2.

125I-DPA-713 SPECT imaging correlates with bactericidal activity of TB treatments. Four-to-six-week-old female C3HeB/FeJ mice were aerosol infected with M. tuberculosis. Mice were sacrificed to determine the bacillary burden of whole lungs 1 day after infection and at each time point. A separate group of identically infected mice were used for imaging studies. Six weeks after infection, mice were randomly divided into treatment groups and orally administered (five times per week) either the standard RHZ or a highly active JZC regimen for 12 and 8 weeks, respectively. (A) Consistent with the higher bactericidal activity of bedaquiline-containing regimens, 8 weeks of treatment with JZC cleared the infection in the majority of mice, versus 12 weeks required to achieve the same bacterial killing with the standard (RHZ) treatment. (B) Pulmonary 18F-FDG PET imaging correlated with the pulmonary bacterial burden (Spearman's ρ = 0.78; P < 0.01) but was unable to correctly identify the bactericidal activities of the two TB treatments (P > 0.49). (C) Pulmonary 125I-DPA-713 SPECT imaging correlated well with the pulmonary bacterial burden (Spearman's ρ = 0.92; P < 0.01) and also correctly identified the bactericidal activities of the two TB regimens as early as 4 weeks after the start of treatment (P < 0.03). CFU data are presented on a logarithmic scale as means and standard deviations. The SUV are presented as percentages of the signal noted at the initial time point (start of treatment) on a linear scale, expressed as medians and interquartile ranges.
A cohort of 13 M. tuberculosis-infected mice were imaged 6 and 16 weeks after completion of standard (RHZ) TB treatment to assess relapse. We hypothesized that for an ideal imaging biomarker, an increase in the mean pulmonary activity during relapse would correlate with the pulmonary bacterial burden. A total of 78 image sets (SPECT, PET, and CT) were analyzed to measure the change in the SUV between 6 and 16 weeks after cessation of TB treatment (SUVR16week/6week) and compared with postmortem pulmonary CFU at the final time point (Fig. 3). A significant correlation was found between the interval increase in 125I-DPA-713 SPECT activity for each animal with the pulmonary bacterial burden at relapse (Spearman's ρ = 0.79; P < 0.01). However, interval increase in 18F-FDG PET activity did not correlate well with the pulmonary bacterial burden at relapse (Spearman's ρ = 0.34; P = 0.26).
FIG 3.

Correlation between imaging and bacterial burden during relapse. M. tuberculosis-infected mice were serially imaged 16 weeks after completion of standard (RHZ) TB treatment to monitor relapse. The correlation between the change in the standardized uptake value ratio (SUVR) between 6 and 16 weeks after cessation of TB treatment (SUVR16week/6week) and postmortem pulmonary bacterial burdens at the final imaging time point is shown. Each data point represents an independent animal. A significant correlation was found between 125I-DPA-713 SPECT results and bacterial burden (Spearman's ρ = 0.79; P < 0.01) (A) but not between 18F-FDG PET imaging and bacterial burden (Spearman's ρ = 0.34; P = 0.26) (B).
125I-DPA-713 SPECT imaging of TB lesions.
Since pulmonary TB is characterized by multiple different pathologies, we evaluated the ability of DPA-713 to detect and penetrate different TB lesions. Figure 4A to C show CT, 18F-FDG PET/CT, and 125I-DPA-713 SPECT/CT images from a mouse with pulmonary lesions 8 weeks after infection. Both 18F-FDG PET and 125I-DPA-713 SPECT signals colocalized with the TB lesions seen on CT. Postmortem histopathology demonstrated the necrotic granuloma (Fig. 4D), with numerous intracellular and extracellular bacilli (Fig. 4E) and fibrosis around the rim (Fig. 4F). Immunofluorescence analyses confirmed that intravenously injected DPA-713 penetrated into the cellular rim and colocalized with inflammatory cells (Fig. 4G to J).
FIG 4.

Imaging of necrotic pulmonary TB lesions. The transverse (left), coronal (middle), and sagittal (right) views from an M. tuberculosis-infected mouse (8 weeks after infection; no TB treatment) demonstrating a necrotic TB lesion (cross-hairs) are shown. (A) The TB lesion is visible as a radiodense area on the CT images. (B) The 18F-FDG PET signal localizes at the site of the TB lesion. (C) The 125I-DPA-713 SPECT signal also colocalizes with the TB lesion. H, heart. (D) Postmortem histopathology (hematoxylin and eosin staining [H&E]) demonstrates a necrotic granuloma with a cellular rim. (E) Both intracellular and extracellular bacilli are seen on acid-fast stain. (F) Masson's trichrome stain demonstrates collagen deposition (blue) at the fibrotic rim of the necrotic granuloma. Immunofluorescence demonstrates signal from DPA-713-IRDye680LT (G), CD11b+ macrophages (H), and Hoechst stain for nuclei (I). (J) Overlay of all channels shows that DPA-713-IRDye680LT penetrates the fibrotic lesion and colocalizes with the CD11b+ signal.
One month after the completion of RHZ treatment, pulmonary cavitary lesions were observed on CT imaging in 61% (11 of 18) of mice. As before, both 18F-FDG PET and 125I-DPA-713 SPECT signals colocalized with the rim of the cavitary lesion (Fig. 5A to C). Postmortem histopathology demonstrated the cavity (Fig. 5D and E), with numerous intracellular and extracellular bacilli (Fig. 5F) and prominent fibrosis around the rim (Fig. 5G and H). Picrosirius red staining (23, 24) also suggested remodeling of the extracellular matrix (Fig. 5I). Immunofluorescence analysis confirmed that intravenously injected DPA-713 penetrated into the cellular rim and colocalized with inflammatory cells (Fig. 5J to O).
FIG 5.

Imaging of cavitary pulmonary TB lesions. The transverse (left), coronal (middle), and sagittal (right) views from an M. tuberculosis-infected mouse demonstrating a cavitary TB lesion (cross-hairs) are shown. (A) The cavitary lesion is visible as a radiolucency on the CT images. (B) The 18F-FDG PET signal localizes at the rim of the cavity. (C) The 125I-DPA-713 SPECT signal also colocalizes with the rim of the cavitary lesion. H, heart. (D and E) Postmortem histopathology (H&E) demonstrates a cavity with a cellular rim. (F) Both intracellular and extracellular bacilli are seen on acid-fast stain. (G and H) Collagen deposition is noted on Masson's trichrome (blue [G]) and reticulin (pink [H]) stains at the fibrotic rim of the cavity. (I) Picrosirius red stain observed under circularly polarized light microscopy demonstrates both mature (red) and immature (yellow; birefringence) collagen fibers surrounding the cavity. Immunofluorescence demonstrates signal from DPA-713-IRDye680LT (K), CD11b (L) CD3 (M) and Hoechst stain for nuclei (N). (O) Overlay of the DPA-713-IRDye680LT and CD11b channels demostrates colocalization of the signals. (J) Overlay of all channels demonstrating that DPA-713-IRDye680LT penetrates the fibrotic lesion and colocalizes with the CD11b+ signal.
Optical imaging in live animals followed by subsequent postmortem ex vivo whole-lung imaging also confirmed localization of DPA-713 with the TB lesions (see Fig. S2 in the supplemental material).
Correlation with cellular and cytokine responses.
To confirm and further characterize cellular binding, multicolor flow-cytometric analyses were performed. Overall, 40.2%, 17.7%, 24.9%, and 2.7% of DPA-713+ cells were CD11b+, CD11c+, Gr-1+, and TCRβ+, respectively (Fig. 6A). Moreover, 78.2 ± 6.0% of DPA-713+ cells expressed CD68, with 94.4 ± 1.2%, 94.7 ± 1.0%, and 91.6 ± 1.5% of CD11b+, CD11c+ and Gr-1+ cells, respectively, coexpressing CD68. Intracellular expression of TNF-α and IFN-γ was analyzed within the DPA-713+ CD68+ cell subsets. Figure 6B and C show histograms for TNF-α and IFN-γ, respectively. TNF-α was expressed in 17.2 ± 3.2%, 31.6 ± 1.2%, and 12.2 ± 2.4% of CD11b+, CD11c+, and Gr-1+ cells, respectively. Similarly, IFN-γ was expressed in 22.1 ± 2.9%, 31.2 ± 1.6%, and 20.3 ± 2.1% of CD11b+, CD11c+, and Gr-1+ cells, respectively. Finally, we also determined cytokine levels in whole-lung homogenates from animals receiving TB treatments (Fig. 6D and E). There was a time-dependent decrease in both TNF-α and IFN-γ levels during TB treatment. 125I-DPA-713 SPECT imaging correlated best with tissue TNF-α levels (Spearman's ρ = 0.94; P < 0.01) (see Fig. S3A in the supplemental material).
FIG 6.

Correlation with cellular and cytokine responses. To confirm and characterize the phenotype of DPA-713+ cells, multicolor flow-cytometric analyses were performed in whole-lung homogenates from M. tuberculosis-infected animals (8 weeks postinfection). (A) Pie chart depicting the percentages of CD11b+ (macrophages), CD11b+ Gr-1+ (inflammatory macrophages), Gr-1+ (granulocytes), CD11c+ (dendritic cells), TCR-β+ (T cells), and other cells within the parent DPA-713+ gate. (B and C) Respective histograms showing the proportion of DPA-713+ CD68+ cells with intracellular expression of TNF-α and IFN-γ by cell subset. (D and E) Tissue cytokine levels in whole-lung homogenates from animals receiving TB treatments for TNF-α and IFN-γ. Cytokine data are presented on a linear scale as means and standard errors of the means. Five biological samples were used for each analyses.
124I-DPA-713 PET imaging.
Although 125I-DPA-713 SPECT imaging is excellent for preclinical assessments in mice, 125I emits low-energy photons and lacks the tissue penetration needed for human imaging. However, iodo-DPA-713 can be labeled with positron-emitting (124I) radioisotopes, ideal for PET imaging in humans. We therefore evaluated the uptake and distribution of 124I-DPA-713 in mice (8 weeks after infection; no TB treatment). 124I-DPA-713 PET demonstrated excellent localization of the radiotracer with TB lesions in M. tuberculosis-infected mice (Fig. 7). 124I-DPA-713 PET produced 4.0-fold-higher signal intensity in the infected TB lesions compared to healthy lungs (uninfected controls) (P = 0.03). Three-dimensional coregistered 124I-DPA-713 PET/CT movies demonstrated discrete areas of 124I-DPA-713 PET signal in the infected lung tissues, with only minimal background signal in the uninfected animal (see Movies S1 and S2 in the supplemental material).
FIG 7.
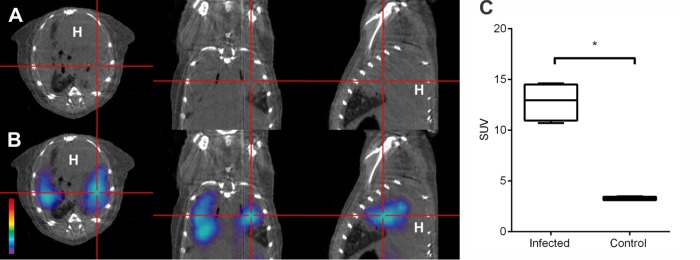
Pulmonary 124I-DPA-713 PET imaging. The transverse (left), coronal (middle), and sagittal (right) views from an M. tuberculosis-infected mouse (8 weeks after infection; no TB treatment) demonstrating a TB lesion (cross-hairs) are shown. (A and B) CT and 124I-DPA-713 PET demonstrate colocalization of the PET signal with the TB lesion observed on the CT image. (C) The pulmonary 124I-DPA-713 PET signal from M. tuberculosis-infected mice is significantly higher than the signals from uninfected (control) animals (P = 0.03). Standardized uptake values (SUV) are represented as box plots, where central bars represent medians, the edges of the boxes represent quartiles, and whiskers show the upper and lower limits of the range. At least four mice were imaged for each group.
DISCUSSION
Molecular imaging of TB pathology can provide valuable real-time information, which could allow early prediction of TB treatment responses and the development of relapse (25). While current tomographic imaging techniques such as CT and 18F-FDG PET can provide information on treatment responses by measuring the change in host immune responses that occur during treatment (5–8), they lack specificity, and 18F-FDG is taken up by a wide range of inflammatory and noninflammatory cells. Since activated macrophages are key components of TB-associated inflammation, we hypothesized that real imaging with a macrophage-avid tracer such as radioiodo-DPA-713 would serve as a more specific biomarker technique to monitor the response to TB treatments. Pulmonary 125I-DPA-713 SPECT demonstrated significant correlation with the bactericidal activities of TB treatments and was able to correctly identify the bactericidal activities (as early as 4 weeks) of the standard (RHZ) and a novel, highly active bedaquiline-containing TB regimen (JZC). We also found that an early increase in 125I-DPA-713 SPECT activity, but not 18F-FDG PET activity, correlated significantly with the bacterial burden at relapse. Collectively, these data suggest that iodo-DPA-713 imaging may be more specific for TB-associated inflammation than 18F-FDG PET and could provide a better means of monitoring TB treatments.
After deposition of M. tuberculosis in the alveoli via an airborne route, initial events include bacterial phagocytosis by alveolar macrophages and other phagocytic cells, bacterial replication, development of delayed-type hypersensitivity, and the formation of the pulmonary granuloma (26). With the emergence of delayed-type hypersensitivity (DTH), infected cells in the interior of the granuloma are killed, leading to the formation of the “classic” TB granuloma—an organized structure with central areas of caseous necrosis surrounded by dense infiltrates of neutrophils, activated macrophages, lymphocytes, and fibroblasts. Some lesions also expel their contents into airways to form cavitary lesions with high bacillary burdens (107 to 109), making the patient highly infectious (27). Therefore, active pulmonary TB in humans is characterized by a complex spectrum of disease with multiple pathologies, including granulomas with caseous necrosis and cavitation (28, 29). While standard mouse strains cannot recapitulate necrotic or cavitary pathologies, we and others have demonstrated that in addition to developing necrotic and hypoxic lesions, C3HeB/FeJ mice also develop cavitary TB (24, 30, 31). Similar to human pathology, where granulomas are surrounded by a fibrotic capsule (32), extensive fibrosis was also noted around chronic TB granulomas and cavities in C3HeB/FeJ mice. Despite the fibrotic barrier, radiolabeled and fluorescent DPA-713 analogs readily penetrated the TB lesions, suggesting that radioiodinated DPA-713 could be used to detect and quantify TB-associated inflammatory responses in different TB lesions noninvasively.
Since DPA-713 accumulates specifically in activated inflammatory cells, we wanted to correlate the imaging findings with the inflammatory responses. We therefore characterized and correlated 125I-DPA-713 SPECT with tissue cellular and cytokine responses in M. tuberculosis-infected lungs. As reported previously, the majority of DPA-713+ cells were found to express CD68 (14). More specifically, DPA-713 bound to activated (CD68+) antigen-presenting cells (macrophages [CD11b+], dendritic cells [CD11c+], and neutrophils [Gr-1+]) but not lymphocytes (TCRβ+). A small proportion (14.2%) of DPA-713+ cells did not stain positive for these cell markers and could represent activated epithelial cells or pneumocytes (14). We also found that CD68+ neutrophils comprised a significant proportion (17.7%) of the DPA-713+ cells. Gottfried et al. and Amanzada et al. demonstrated that CD68 is not specific to macrophages and is a lysosomal protein enriched in activated macrophages, dendritic cell, granulocytes, and some fibroblasts (33, 34). We also found that 18% of DPA-713+ cells were CD11b+ Gr-1+ inflammatory macrophages. Myeloid-derived suppressor cells (inflammatory macrophages) are characterized by the coexpression of CD11b and Gr-1, and a systemic expansion of these cells has been noted previously with TB (35). Also, as expected, functionally active CD68+ and DPA-713+ cells had high levels of intracellular TNF-α and IFN-γ expression, both of which are key cytokines in TB pathology (36). Finally, we also determined cytokine levels from whole-lung homogenates of animals receiving TB treatments. A time-dependent decrease in both TNF-α and IFN-γ levels was observed with TB treatments, and 125I-DPA-713 SPECT imaging correlated best with TNF-α levels. It should be noted that while cytokines were determined from whole-lung homogenates, DPA-713 SPECT measured the activity in discrete lung lesions, which would presumably also be the predominant sites of cytokine production.
Although 125I-DPA-713 SPECT imaging is excellent for preclinical assessments in mice, 125I emits low-energy photons and lacks the tissue penetration needed for human imaging. However, iodo-DPA-713 can be labeled with higher-energy direct γ (123I) or positron-emitting (124I) radioisotopes, ideal for SPECT or PET imaging in humans, respectively. We therefore utilized 124I-DPA-713 manufactured under cGMP and demonstrated excellent PET signal-to-noise ratios for pulmonary TB lesions, suggesting that 124I-DPA-713 PET is an excellent candidate imaging biomarker technique for TB-associated inflammation. 124I-DPA-713 PET could be utilized for preclinical studies but also has the potential for translation to humans, especially in settings such as TB trials, where resources are not as limited but rapid, and accurate biomarkers for monitoring TB treatments and relapse are urgently required.
Supplementary Material
ACKNOWLEDGMENTS
This work was supported by R01-HL116316 (S.K.J.), NIH Director's New Innovator Award DP2-OD006492 (S.K.J.), subcontract 5P30AI060354-09 from Harvard University Center for AIDS Research (S.K.J.), and the K-RITH travel award (S.K.J.).
We thank Haofan Wang (JHU) for providing DPA-713-IRDye680LT, as well as Jonathan Shahbazian and Lloyd Miller (JHU) for their assistance with optical imaging.
Footnotes
Supplemental material for this article may be found at http://dx.doi.org/10.1128/AAC.04180-14.
REFERENCES
- 1.Dye C, Williams BG. 2008. Eliminating human tuberculosis in the twenty-first century. J R Soc Interface 5:653–662. doi: 10.1098/rsif.2007.1138. [DOI] [PMC free article] [PubMed] [Google Scholar]
- 2.Boehme CC, Nabeta P, Hillemann D, Nicol MP, Shenai S, Krapp F, Allen J, Tahirli R, Blakemore R, Rustomjee R, Milovic A, Jones M, O'Brien SM, Persing DH, Ruesch-Gerdes S, Gotuzzo E, Rodrigues C, Alland D, Perkins MD. 2010. Rapid molecular detection of tuberculosis and rifampin resistance. N Engl J Med 363:1005–1015. doi: 10.1056/NEJMoa0907847. [DOI] [PMC free article] [PubMed] [Google Scholar]
- 3.Centers for Disease Control and Prevention. 2006. Emergence of Mycobacterium tuberculosis with extensive resistance to second-line drugs—worldwide, 2000-2004. MMWR Morb Mortal Wkly Rep 55:301–305. doi: 10.1037/e566482006-002. [DOI] [PubMed] [Google Scholar]
- 4.Velayati AA, Masjedi MR, Farnia P, Tabarsi P, Ghanavi J, Ziazarifi AH, Hoffner SE. 2009. Emergence of new forms of totally drug-resistant tuberculosis bacilli: super extensively drug-resistant tuberculosis or totally drug-resistant strains in Iran. Chest 136:420–425. doi: 10.1378/chest.08-2427. [DOI] [PubMed] [Google Scholar]
- 5.Davis SL, Nuermberger EL, Um PK, Vidal C, Jedynak B, Pomper MG, Bishai WR, Jain SK. 2009. Noninvasive pulmonary [18F]-2-fluoro-deoxy-d-glucose positron emission tomography correlates with bactericidal activity of tuberculosis drug treatment. Antimicrob Agents Chemother 53:4879–4884. doi: 10.1128/AAC.00789-09. [DOI] [PMC free article] [PubMed] [Google Scholar]
- 6.Sathekge M, Maes A, Kgomo M, Stoltz A, Van de Wiele C. 2011. Use of 18F-FDG PET to predict response to first-line tuberculostatics in HIV-associated tuberculosis. J Nucl Med 52:880–885. doi: 10.2967/jnumed.110.083709. [DOI] [PubMed] [Google Scholar]
- 7.Coleman MT, Maiello P, Tomko J, Frye LJ, Fillmore D, Janssen C, Klein E, Lin PL. 2014. Early changes by (18)fluorodeoxyglucose positron emission tomography coregistered with computed tomography predict outcome after Mycobacterium tuberculosis infection in cynomolgus macaques. Infect Immun 82:2400–2404. doi: 10.1128/IAI.01599-13. [DOI] [PMC free article] [PubMed] [Google Scholar]
- 8.Via LE, Schimel D, Weiner DM, Dartois V, Dayao E, Cai Y, Yoon YS, Dreher MR, Kastenmayer RJ, Laymon CM, Carny JE, Flynn JL, Herscovitch P, Barry CE 3rd. 2012. Infection dynamics and response to chemotherapy in a rabbit model of tuberculosis using [18F]2-fluoro-deoxy-d-glucose positron emission tomography and computed tomography. Antimicrob Agents Chemother 56:4391–4402. doi: 10.1128/AAC.00531-12. [DOI] [PMC free article] [PubMed] [Google Scholar]
- 9.Bell GI, Burant CF, Takeda J, Gould GW. 1993. Structure and function of mammalian facilitative sugar transporters. J Biol Chem 268:19161–19164. [PubMed] [Google Scholar]
- 10.Pauwels EK, Ribeiro MJ, Stoot JH, McCready VR, Bourguignon M, Maziere B. 1998. FDG accumulation and tumor biology. Nucl Med Biol 25:317–322. doi: 10.1016/S0969-8051(97)00226-6. [DOI] [PubMed] [Google Scholar]
- 11.Zhuang H, Alavi A. 2002. 18-Fluorodeoxyglucose positron emission tomographic imaging in the detection and monitoring of infection and inflammation. Semin Nucl Med 32:47–59. doi: 10.1053/snuc.2002.29278. [DOI] [PubMed] [Google Scholar]
- 12.Rupprecht R, Papadopoulos V, Rammes G, Baghai TC, Fan J, Akula N, Groyer G, Adams D, Schumacher M. 2010. Translocator protein (18 kDa) (TSPO) as a therapeutic target for neurological and psychiatric disorders. Nat Rev Drug Discov 9:971–988. doi: 10.1038/nrd3295. [DOI] [PubMed] [Google Scholar]
- 13.Zavala F, Haumont J, Lenfant M. 1984. Interaction of benzodiazepines with mouse macrophages. Eur J Pharmacol 106:561–566. doi: 10.1016/0014-2999(84)90059-1. [DOI] [PubMed] [Google Scholar]
- 14.Foss CA, Harper JS, Wang H, Pomper MG, Jain SK. 2013. Noninvasive molecular imaging of tuberculosis-associated inflammation with radioiodinated DPA-713. J Infect Dis 208:2067–2074. doi: 10.1093/infdis/jit331. [DOI] [PMC free article] [PubMed] [Google Scholar]
- 15.Diacon AH, Pym A, Grobusch M, Patientia R, Rustomjee R, Page-Shipp L, Pistorius C, Krause R, Bogoshi M, Churchyard G, Venter A, Allen J, Palomino JC, De Marez T, van Heeswijk RP, Lounis N, Meyvisch P, Verbeeck J, Parys W, de Beule K, Andries K, Mc Neeley DF. 2009. The diarylquinoline TMC207 for multidrug-resistant tuberculosis. N Engl J Med 360:2397–2405. doi: 10.1056/NEJMoa0808427. [DOI] [PubMed] [Google Scholar]
- 16.Harper J, Skerry C, Davis SL, Tasneen R, Weir M, Kramnik I, Bishai WR, Pomper MG, Nuermberger EL, Jain SK. 2012. Mouse model of necrotic tuberculosis granulomas develops hypoxic lesions. J Infect Dis 205:595–602. doi: 10.1093/infdis/jir786. [DOI] [PMC free article] [PubMed] [Google Scholar]
- 17.Pan H, Yan BS, Rojas M, Shebzukhov YV, Zhou H, Kobzik L, Higgins DE, Daly MJ, Bloom BR, Kramnik I. 2005. Ipr1 gene mediates innate immunity to tuberculosis. Nature 434:767–772. doi: 10.1038/nature03419. [DOI] [PMC free article] [PubMed] [Google Scholar]
- 18.Wang H, Pullambhatla M, Guilarte TR, Mease RC, Pomper MG. 2009. Synthesis of [125I]iodoDPA-713: a new probe for imaging inflammation. Biochem Biophys Res Commun 389:80–83. doi: 10.1016/j.bbrc.2009.08.102. [DOI] [PMC free article] [PubMed] [Google Scholar]
- 19.Davis SL, Be NA, Lamichhane G, Nimmagadda S, Pomper MG, Bishai WR, Jain SK. 2009. Bacterial thymidine kinase as a non-invasive imaging reporter for Mycobacterium tuberculosis in live animals. PLoS One 4:e6297. doi: 10.1371/journal.pone.0006297. [DOI] [PMC free article] [PubMed] [Google Scholar]
- 20.Liu F, Whitton JL. 2005. Cutting edge: re-evaluating the in vivo cytokine responses of CD8+ T cells during primary and secondary viral infections. J Immunol 174:5936–5940. doi: 10.4049/jimmunol.174.10.5936. [DOI] [PubMed] [Google Scholar]
- 21.Bhatt K, Kim A, Kim A, Mathur S, Salgame P. 2013. Equivalent functions for B7.1 and B7.2 costimulation in mediating host resistance to Mycobacterium tuberculosis. Cell Immunol 285:69–75. doi: 10.1016/j.cellimm.2013.09.004. [DOI] [PubMed] [Google Scholar]
- 22.Tasneen R, Li SY, Peloquin CA, Taylor D, Williams KN, Andries K, Mdluli KE, Nuermberger EL. 2011. Sterilizing activity of novel TMC207- and PA-824-containing regimens in a murine model of tuberculosis. Antimicrob Agents Chemother 55:5485–5492. doi: 10.1128/AAC.05293-11. [DOI] [PMC free article] [PubMed] [Google Scholar]
- 23.Dayan D, Hiss Y, Hirshberg A, Bubis JJ, Wolman M. 1989. Are the polarization colors of picrosirius red-stained collagen determined only by the diameter of the fibers? Histochemistry 93:27–29. doi: 10.1007/BF00266843. [DOI] [PubMed] [Google Scholar]
- 24.Driver ER, Ryan GJ, Hoff DR, Irwin SM, Basaraba RJ, Kramnik I, Lenaerts AJ. 2012. Evaluation of a mouse model of necrotic granuloma formation using C3HeB/FeJ mice for testing of drugs against Mycobacterium tuberculosis. Antimicrob Agents Chemother 56:3181–3195. doi: 10.1128/AAC.00217-12. [DOI] [PMC free article] [PubMed] [Google Scholar]
- 25.Wallis RS, Kim P, Cole S, Hanna D, Andrade BB, Maeurer M, Schito M, Zumla A. 2013. Tuberculosis biomarkers discovery: developments, needs, and challenges. Lancet Infect Dis 13:362–372. doi: 10.1016/S1473-3099(13)70034-3. [DOI] [PubMed] [Google Scholar]
- 26.Fenton MJ, Vermeulen MW. 1996. Immunopathology of tuberculosis: roles of macrophages and monocytes. Infect Immun 64:683–690. [DOI] [PMC free article] [PubMed] [Google Scholar]
- 27.Canetti G. 1965. Present aspects of bacterial resistance in tuberculosis. Am Rev Respir Dis 92:687–703. [DOI] [PubMed] [Google Scholar]
- 28.Robbins SL, Kumar V. 2010. Robbins and Cotran pathologic basis of disease, 8th ed. Saunders/Elsevier, Philadelphia, PA. [Google Scholar]
- 29.Johnson DH, Via L, Kim P, Laddy D, Lau C-Y, Weinstein EA, Jain S. 2014. Nuclear imaging: a powerful novel approach for tuberculosis. Nucl Med Biol 41:777–784. doi: 10.1016/j.nucmedbio.2014.08.005. [DOI] [PMC free article] [PubMed] [Google Scholar]
- 30.Ordonez AA, Pokkali S, Mease R, Klunk M, Foss CA, Pomper MG, Jain SK. 2014. Characterization of iodo-DPA-713 imaging in mice receiving novel TB treatments, abstr 3002, p 78 In Novel therapeutic approaches to tuberculosis. Keystone Symposia Conference, Keystone, CO. [Google Scholar]
- 31.Nuermberger E, Jain SK, Tasneen R. 2014. Cavitary TB in C3HeB/FeJ mice, abstr 2047, p 75.. In Novel therapeutic approaches to tuberculosis. Keystone Symposia Conference, Keystone, CO. [Google Scholar]
- 32.Russell DG, Cardona PJ, Kim MJ, Allain S, Altare F. 2009. Foamy macrophages and the progression of the human tuberculosis granuloma. Nat Immunol 10:943–948. doi: 10.1038/ni.1781. [DOI] [PMC free article] [PubMed] [Google Scholar]
- 33.Gottfried E, Kunz-Schughart LA, Weber A, Rehli M, Peuker A, Muller A, Kastenberger M, Brockhoff G, Andreesen R, Kreutz M. 2008. Expression of CD68 in non-myeloid cell types. Scand J Immunol 67:453–463. doi: 10.1111/j.1365-3083.2008.02091.x. [DOI] [PubMed] [Google Scholar]
- 34.Amanzada A, Malik IA, Blaschke M, Khan S, Rahman H, Ramadori G, Moriconi F. 2013. Identification of CD68(+) neutrophil granulocytes in in vitro model of acute inflammation and inflammatory bowel disease. Int J Clin Exp Pathol 6:561–570. doi: 10.1055/s-0033-1352657. [DOI] [PMC free article] [PubMed] [Google Scholar]
- 35.Gabrilovich DI, Nagaraj S. 2009. Myeloid-derived suppressor cells as regulators of the immune system. Nat Rev Immunol 9:162–174. doi: 10.1038/nri2506. [DOI] [PMC free article] [PubMed] [Google Scholar]
- 36.Hickman SP, Chan J, Salgame P. 2002. Mycobacterium tuberculosis induces differential cytokine production from dendritic cells and macrophages with divergent effects on naive T cell polarization. J Immunol 168:4636–4642. doi: 10.4049/jimmunol.168.9.4636. [DOI] [PubMed] [Google Scholar]
Associated Data
This section collects any data citations, data availability statements, or supplementary materials included in this article.