

Abstract
Background
Almost all studies on the effect on health from unemployment have concluded that unemployment is bad for your health. However, only a few review articles have dealt with this relation in recent years, and none of them have focused on the analysis of subgroups such as age, gender, and marital status. The objective of our article is to review how unemployment relates to self-assessed health with a focus on its effect on subgroups.
Methods
A search was performed in Web of Science to find articles that measured the effect on health from unemployment. The selection of articles was limited to those written in English, consisting of original data, and published in 2003 or later. Our definition of health was restricted to self-assessed health. Mortality- and morbidity-related measurements were therefore not included in our analysis. For the 41 articles included, information about health measurements, employment status definitions, other factors included in the statistical analysis, study design (including study population), and statistical method were collected with the aim of analysing the results on both the population and factor level.
Results
Most of the studies in our review showed a negative effect on health from unemployment on a population basis. Results at the factor levels were most common for gender (25 articles), age (11 articles), geographic location (8 articles), and education level (5 articles). The analysis showed that there was a health effect for gender, age, education level, household income, and geographic location. However, this effect differed between studies and no clear pattern on who benefits or suffers more among these groups could be determined. The result instead seemed to depend on the study context. The only clear patterns of association found were for socioeconomic status (manual workers suffer more), reason for unemployment (being unemployed due to health reasons is worse), and social network (a strong network is beneficial).
Conclusions
Unemployment affects groups of individuals differently. We believe that a greater effort should be spent on specific groups of individuals, such as men or women, instead of the population as a whole when analysing the effect of unemployment on health.
Electronic supplementary material
The online version of this article (doi:10.1186/1471-2458-14-1310) contains supplementary material, which is available to authorized users.
Keywords: Age, Education, Employment, Gender, Health, Marital status, Review, Subgroups, Unemployed
Background
Many studies have investigated the consequences on self-assessed health from unemployment [1–41], including review articles [42–44] and meta-analyses [45–47]. In the meta-analyses, unemployment has been shown to have a negative effect on health with an effect size ranging from 0.36 to 0.57 (considered as small-sized to medium-sized effects). Most of the other literature in the field is in agreement in suggesting that unemployment is bad for your self-assessed health.
Meta-analyses and review papers on health and unemployment have primarily focused on measuring population-based effects on health from unemployment. For example, even though the meta-analyses by McKee-Ryan et al. [45] and Paul and Moser [46] present results for so-called moderators, the main effort of their work was to derive an effect size for the population as a whole. It is common when studying unemployment and health that moderators are only included as part of the statistical model to improve estimates. If the effect from unemployment on health differs for different levels of the moderator this might lead to misleading results on the population level even if the estimates are unbiased. This is due to the fact that the estimates depend on the interactions of factors such as reasons for unemployment, type of work contract, and different personal characteristics (age, gender, marital status, etc.). Estimates might, therefore, not reflect the situation for most of the groups in the population and it might be advisable to only present stratified estimates.
Despite many previous meta-analyses and reviews in the field, there is still a need for summarizing what has been done in the past, especially because the few reviews published in recent years have not covered the same area as us [42, 43]. More importantly, no review has been undertaken with the same emphasis as ours on characteristics such as age, gender, and education level for which unemployment might affect individuals to a different extent. We wanted to investigate how these and other factors have been dealt with in the past in this field.
Thus, the aim of our article is to review how unemployment relates to self-assessed health, mainly with a focus on its effects on subgroups, such as age, gender, and marital status.
Methods
For our review, we have chosen articles consisting of original data that sought to measure the effect of unemployment on health. Our definition of health was restricted to self-assessed health and we have not included mortality- and morbidity-related measurements. Our requirement was that the unemployed should be actively searching for a job and not be disabled or retired (a similar definition of unemployment is used in most articles that study unemployment). To be part of our review, the article must have focused on the comparison of unemployed and employed individuals within a population that was not limited to a specific occupation or disease cohort. Thus, the main focus of our included articles should be unemployment in relation to health. In addition to the specifications above, we limited our selection of articles to those written in English and published from 2003 to April 2014. Our review was performed based on the checklist from the Prisma Statement [48], see Additional file 1.
Full details of the process leading to the final selection of the 41 articles [1–41] are available in Additional file 2. In short, we searched for articles in the literature database Web Of Science (Thomson Reuters) with the following search term: (“well-being” OR “health”) AND (“labor” or “labour” or “employment” or “job” or “unemployment” or “work” or “unemployed”). Articles were only selected if the search term was in the title of the article. We narrowed the list down from 8,070 articles to 36 articles in four subsequent steps based on i) relevance of the title of the article, ii) language (English) and document type (research article), iii) the content of the abstract, and iv) the content of the full article (Figure 1). After this procedure, we scanned Web of Science by adding the term “quality of life” to the health definition (left side) and contract to the employment terms (right side) of the search term. We thereafter checked weekly emails from Web of Science based on the extended search term for new articles until we were late in the writing process. We also performed an additional search in the literature database PubMed (National Center for Biotechnology Information, Bethesda MD, USA) on the MeSH terms “employ* and health”, which only resulted in one additional article compared to the Web of Science search. Thus, the final selection of 41 articles consisted of 36 articles from the extensive search, one from the complementary search, three recent publications, and one publication only available in PubMed. The screening process for articles was completed by one of the authors (FN). We did not perform any quality related criterion for these articles to further restrict the number of articles selected as we wanted to avoid publication bias. Where we consider it motivated, we have commented about weaknesses in studies to highlight when conclusions from the review could have potentially been affected.
Figure 1.
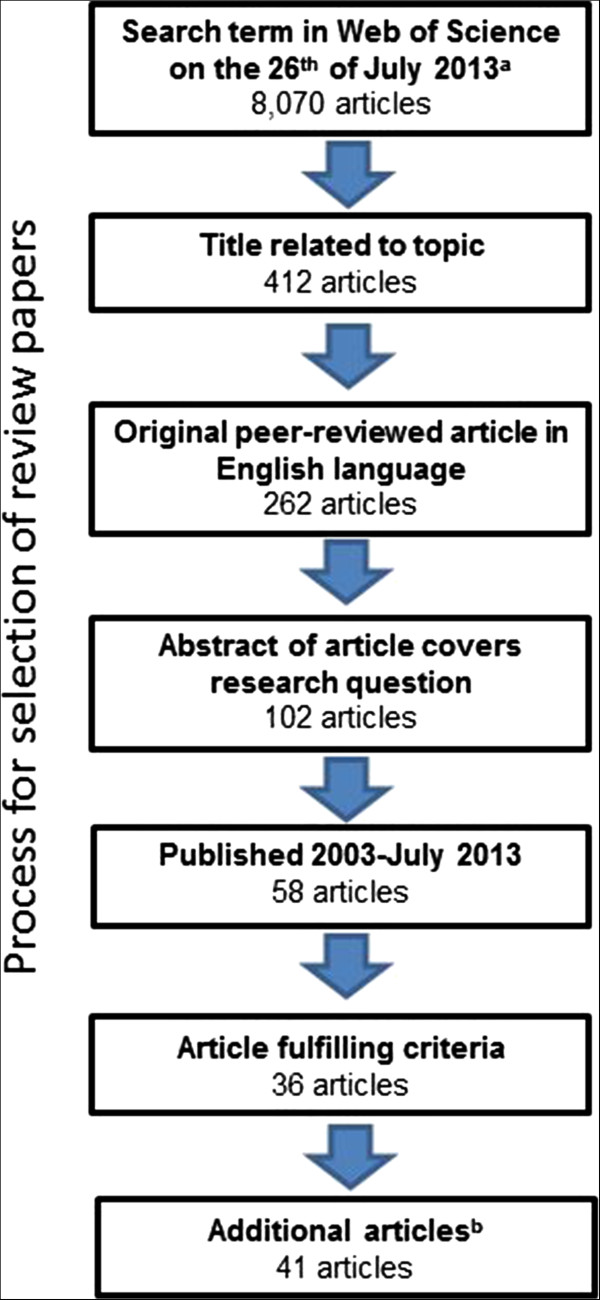
PRISMA flow diagram. The flowchart is showing the process in which articles were selected for the review. asee Additional file 2 for search term, bthree articles published after initial scanning, one article fulfilling extended search term, and one article based on additional search in PubMed were added.
From the selected articles, information about: health measurements, employment status definitions, other factors included in statistical analysis, study design (including study population), and statistical methods were collected. For each factor, such as age and gender, we also specified if it was part of the statistical model and if stratified results were presented. Articles that included an interaction term between employment status and a moderator were also handled as stratified results. From every article we extracted odds ratios, as well as other ratio measurements, and absolute difference measurements for unadjusted and adjusted estimates from the articles. When we present adjusted estimates in our review it is for the model with most “controlling” variables.
We first evaluate the results for the articles that have presented non-stratified results on the effect of unemployment on health. Thereafter, stratified results are analysed to determine if there is difference between factor levels. Most articles in our review did not focus on comparing different factor levels with statistical tests. Therefore our interpretations are based on comparing point estimates in the respective subgroups.
Results
Characteristics of each of the 41 articles in our review are presented in Table 1 and summarized in Table 2. Most studies in our review were from Europe (80%) with other continents having no more than three studies. A majority of the studies used a cross-sectional design (59%), and the rest were longitudinal studies (41%). A wide variety of health measures, most of them validated, were used in our selection of articles. The most common were questions about self-rated health (or similar) with 3 or 5 response alternatives on an ordinal scale (19 studies) and the General Health Questionnaire (9 studies). A wide range of factors was included in the analyses of the relationship between health and unemployment. Gender and age were part of all but a few articles, and the most frequent other factors were education level (73%) and marital status (56%). Binary logistic regression was used in a majority of the studies (51%), and other regression techniques were also common (41%). Analysis of variance (ANOVA), analysis of covariance (ANCOVA), propensity scores, and instrumental variables were rarely found in our collection of articles.
Table 1.
Summary of characteristics for review articles
| Country | Year | Study design | Ages | # | Health measure | ORa | Gender | Age | Educ | MarS | Other factors | Method |
|---|---|---|---|---|---|---|---|---|---|---|---|---|
| Australia [17] | 2001 | CS | Allb | 7,682 | Part of SF-36 | n/a | Sep | Part | Part, Sep | Part | Ch, Geo, HHI, Other | LinReg (non-trivial) |
| Australia [26] | 2001–2009 | Long | 20–55 | 7,176 | MHI-5 | n/a | Sep | Part | - | Part | Other | Path |
| Australia [32] | 2001–2009 | Long | 15–64 | 37,369 | MHI-5 | n/a | Sep | Part | Part, Sep | Part | CM, HHI, SN, Other | LinReg (non-trivial) |
| Belgium [12] | 1992–2002 | Long | ≤65 | 5,790 | HDLFGDS | Age-based | Part | Sep | Part | Partc | HHI | Log |
| Brazil [16] | 2002–2003 | CS | 15–64 | 6,426 | SRH-5 | 1.7/1.3 | Part | Part | Part | Part | Alc, HA, LC, Sm, Other | Log |
| Canada [9] | 1994 & 1996 | CS2 | 18–55 | 6,096 | CIDI, DS | Age-based | Part | Sep | Part | Part | HA, Other | LinReg & Log |
| China [25] | 2005 | CS | 20–49 | 8,075 | HCTP | -/1.4 | Part | Part, Sep | Part | Part | Alc, BMI, CM, Ethn, Geo, LC, PA, Sm, SN | Log (non-trivial) |
| Croatia [38] | 1997–1999 & 2003 | CS | 19–57 | 4,139 | SF-36 | n/a | Part | Part | Part | - | - | ANCOVA |
| Europe [2] | 2004 | CS | 50–64 | 11,462 | SRH-5 | -/2.1 | Part | Part | Part | Part | Alc, BMI, Geo, PA, Sm, Other | Log |
| Europe [6] | 2002–2004 | CS | 25–60 | 37,499 | SRH-5 | Strata | Sep | Part | - | - | Geo | Log |
| Europe [13] | 1994–2002 | Long | 20–65 | 39,042 PY | Other | -/1.3 | Part, Sep | Sep | Part | - | Geo, HHI | Log (non-trivial) |
| Europe [33] | 1994/1995 | CS | 25–49 | 4,650 | SRH-5 | Stratad | Women | Part | - | Part | Ch, Geo, HHI | Log |
| Europe [34] | 1994–1995 | CS | 25–49 | 6,449 | SRH-3, SRH-5 | Strata | Sep | Part | Part | Part | Ch, Geo | Log |
| Europe [36] | 2008/2009 | CS | First work < 30 | 5,746 | EURO-D, SRH-5 | Strata | Sep | Part | Part | - | Ethn, HA,LC, RU, SES, Other | Log |
| Finland [7] | 1996–2001 | Long | Allb | 20,599 | SRH-5 | n/a | Part | Part | Part | - | - | DiD, Prop |
| Finland [41] | 1998 | CS | 20–54 | 15,468 | BDI, SRH-5 | Sex-based | Sep | Part | Part | Part | Alc, BMI, Sm, SN, Other | Log |
| Germany [23] | 2009 | CS | 30–59 | 10,387 | HRQOL-4 | n/a | Sep | Part | Part | - | HHI, SN | MCDR |
| Germany [35] | 1991–2008 | Long | ≤58 | 23,734 | HS, MCSS | n/a | Part, Sep | Part, Sep | Part | Part | Ch, Geo, RU, SES, Other | LinReg (non-trivial |
| Great Britain [8] | 1991–2008 | Long | ≥16 | 1,642 | GHQ | n/a | Part | Part | Part | Part | HHI, LocUn, Other | LinReg (non-trivial) |
| Great Britain [10] | 2003 | CS | 16–64 | 1,281 | GHQ, SRH-5 | 1.5/1.7 | Part | Part | Part | - | Geo | Log |
| Great Britain [14] | 1991–2007 | Long | 16–65 | 10,494 | GHQ | n/a | - | Part | Part | Part | HA, HHI, LC, Other | Reg |
| Great Britain [15] | 1991–2009 | Long | 16–64 | 107,035 | GHQ, Other | n/a | Part, Sep | Part, Sep | Part | Part | Ethn, HHI, LC, LocUn, Sm, Other | IV, LinReg |
| Great Britain [28] | 2001 | CS | 25–59 | 698,880 | SRH-3 | n/a | Sep | Part | Part | - | LC | GLM |
| Great Britain [29] | 1978–2004 | CS2 | 25–59 | 264,660 | SRH-3 | Sex-based | Sep | Part | Part | - | LC, Other | Log |
| Great Britain [39] | 1991–2009 | Long | 16–64 | 8,784 | GHQ | n/a | Men | Part | - | Part | Ch, SES, Other | Reg |
| Norway [27] | 1997–2002 | Long | 18–66 | 3,663 | SCL | n/a | Part | Part | Part | Part | LocUn | Reg |
| Poland [22] | Not presented | CSe | 25–64 | 968 | EQ-VAS | 2.7/1.5 | Part, Sep | Part | Part | - | HHI, PA, Sm | Log |
| Slovakia [4] | 1998 & 2002 | CS2 | ~19–22 | 844 | RAND, SRH-5, Well-being | n/a | Sep | - | - | - | CM, SN | Reg |
| Spain [3] | 1994 | CS | 25–64 | 3,881 | GHQ | Sex-based | Sep | Part | - | Sep | Ch, SES, Other | Log |
| Spain [30] | 2006 | CS | 25–64 | 8,515 | GHQ | n/a | Sep | Sep | - | - | SES, Other | Prev |
| Sweden [1] | 1983–1989, 1992–1997 | CS | 16–64 | 59,571 | SRH-5 | 1.8 & 2.4 /1.9 & 2.7f | Part, Sep | Part, Sep | Part, Sep | Part, Sep | Ethn, Geo, HA | MNLog |
| Sweden [5] | 2001–2007 | Long | 20–59 | 12,605 | GHQ | Strata | Part, Sep | Part, Sep | - | Part | Ch, HA, HHI, SES | Log |
| Sweden [18] | 2007 | Long | 42 | 916 | DepS, DS, SRH-3 | Sex-based | Sep | Same age | - | - | HA | Log |
| Sweden [19] | 1997 | CS | 18–24 | 3,453 | Other | n/a | Sepg | Sepg | Sepg | - | CM, SN | ANOVA, t-test |
| Sweden [20] | 1997 | CS | 25–64 | 4,149 | Other | n/a | Sepg | Sepg | Sepg | - | CM, SN | ANOVA, t-test |
| Sweden [21] | 1995 | Long | 30 | 1,044 | DepS, SRH-3 | Sex-based | Sep | Same age | - | - | CM, SN, Other | Log |
| Sweden [24] | 1999–2000 | CS | 18–64 | 5,180 | GHQ | Strata | Sep | Part | Part | - | CM, Geo, SN | Log |
| Sweden [31] | 1995 | Long | 30 | 864 | SRH-3 | Sex-based | Sep | Same age | - | - | Alc, Ch, CM, HA, SES, SN, Other | Log |
| The Netherlands [37] | 2003 | CS | 16–65 | 2,057 | SF-36, SRH-5 | -/2.6d | Part | Part | Part | Part | Ethn | Log, LinReg |
| USA [11] | Many | Long | Variesh | 9,108 | CES-D, SRH-5 | n/a | Part | Parti | Part | Part | HHI, RU | LinReg |
| USA [40] | 1999, 2001, 2003 | Long | Unspecified | 8,125; 16,724 PY | SRH-5 | n/a | Part | Part | Part | Part | Ethn, HHI, RU, SES, Other | MNLog |
Explanation of short forms:
Country refers to country where study was performed (Europe refers to studies where at least two European countries participated). Year refers to the year(s) the study was performed. Study design refers to the study design (CS = cross-sectional, CS2 = two cross sections of the same individuals, Long = longitudinal).
Ages = Age (in years) for participants; # = number of individuals in study population (PY = Person years).
Health measures BDI = 21-item version of Beck’s Depression Inventory (validated scale), CES-D = Centre for Epidemiological Studies Depression Scale (validated scale), CIDI = Composite International Diagnostic Interview, DepS = depressive symptoms, DS = distress scale, EURO-D = European collaboration (validated scale for depression), EQ-VAS = EuroQol 5-dimensions visual analogue scale (validated scale),GHQ = General Health Questionnaire (validated scale), HCTP = health compared with peers of same age, HDLFGDS = Health Daily Living Form Global Depression Scale (validated scale), HRQOL-4 = Four-item Health Days Core Module from the Center for Disease Control (validated scale), HS = health satisfaction, Index = author-created index, MCSS = Mental Component Summary Scale (part of SF-36), MHI = Mental Health Index (part of SF-36), RAND = SF-36 questions with a different scoring algorithm, SCL = Hopkins’ Symptom Check List (validated scale), SF-36 = Short Form 36 (validated scale), SRH = self-rated health (3 or 5 groups/alternatives in questionnaire))
OR = Odds ratio presented in the paper. The first number is the crude OR and the second is the OR from the multivariate model with the most variables if non-stratified estimates are presented (n/a = not applicable, − = odds ratio not estimated for uncontrolled multivariate model) MarS = Marital status used in analysis; Sex = Sex involved in the analysis; Age = Age used in the analysis.
Other factors = Other factors included as part of the analyses or in separate analyses (Alc = high alcohol consumption, BMI = body mass index, Ch = children in the household, CM = cash margin/financial stress, Ethn = ethnicity or other similar difference in personal characteristics, Geo = geographical comparisons within and between countries, HA = health aspects such as any chronic medical condition or long-standing illness, HHI = household or individual income, LC = living conditions, LocUn = local or regional unemployment, PA = physical activity, RU = reason for unemployment, SES = socioeconomic status based on work, Sm = smoking, SN = social networks/social).
Method = Statistical method used for analysing the relation between health and unemployment (ANOVA = analysis of variance, DiD = difference in difference (similar to linear regression), GLM = generalized linear models, IV = instrumental variables, Log = logistic regression, LinReg = linear regression, MCDR = multivariate count data regression, MNLog = multinomial logistic regression, OL = ordinary logit, Prop = propensity scores, Reg = regression technique other than linear and logistic).
For all parts of the matrix: Sep = separate analyses, Part = only included in the statistical model (odds ratio or similar not always presented).
aFor all presented odds ratios in this column, health were significantly poorer for unemployed than employed individuals.
bInformation about age is not explicitly stated.
cVariable “family composition” is not explained in the paper. We assume that the authors refer to marital status.
dUnemployment is added as a controlling factor, but in theory the odds ratio is calculated identically as if unemployment was the main exposure.
ePaper states that it has longitudinal variables but does not describe which year(s) the data collection is based on and the analysis does not indicate that it is based on longitudinal data.
fOdds ratios presented for the periods 1983–1989 and 1992–1997 in two separate analyses.
gCompares within groups of unemployed and employed but gives no direct comparison measurement and no significances for between-group comparisons.
hTwo different populations are used in the article.
iAge was only available for one of the studies because the other had only individuals of the same age. No factors are included in both studies other than household income.
Table 2.
Characteristics of the articles in the review
| Characteristic (n = 41 articles) | n | % | ||||
|---|---|---|---|---|---|---|
| Continent of study | ||||||
| Asia (China) | 1 | 2.4 | ||||
| Australia | 3 | 7.3 | ||||
| Europea | 33 | 80 | ||||
| North Americab | 3 | 7.3 | ||||
| South America (Brazil) | 1 | 2.4 | ||||
| Study design | ||||||
| Cross-sectional | 24 | 59 | ||||
| Longitudinal | 17 | 41 | ||||
| Health measure c | ||||||
| Self-rated health | 19 | 46 | ||||
| General Health Questionnaire | 9 | 22 | ||||
| Depression scales | 7 | 17 | ||||
| Other health scalesd | 20 | 49 | ||||
| Stratified analysis | Part of analysis | |||||
| Factors | n | % | n | % | ||
| Gendere | 38 | 93 | 25 | 66 | 19 | 50 |
| Agef | 37 | 90 | 11 | 30 | 31 | 84 |
| Education level | 30 | 73 | 5 | 17 | 28 | 93 |
| Marital status | 23 | 56 | 2 | 8.7 | 22 | 96 |
| Household income | 13 | 32 | 2 | 17 | 12 | 92 |
| Geographic location | 11 | 27 | 8 | 73 | 7 | 64 |
| Social network/social support | 10 | 24 | 4 | 40 | 8 | 80 |
| Children at home | 8 | 20 | 2 | 25 | 7 | 87 |
| Cash margin/financial strain | 8 | 20 | 2 | 25 | 6 | 75 |
| Health aspectsg | 8 | 20 | 1 | 12 | 8 | 100 |
| Socio-economic status | 8 | 20 | 4 | 50 | 5 | 62 |
| Living conditions and poverty | 7 | 17 | 1 | 14 | 7 | 100 |
| Ethnicity | 6 | 15 | 2 | 33 | 6 | 100 |
| Smoking | 6 | 15 | - | 0 | 6 | 100 |
| High alcoholic intake | 5 | 12 | 1 | 0 | 5 | 100 |
| Reason for unemployment | 4 | 10 | 4 | 100 | - | 0 |
| Local/regional unemployment rates | 3 | 7.3 | 1 | 33 | 3 | 100 |
| Overweight | 3 | 7.3 | - | 0 | 3 | 100 |
| Physical activity | 3 | 7.3 | - | 0 | 3 | 100 |
| Statistical method h | ||||||
| Binary logistic regression | 21 | 51 | ||||
| Other regression techniques | 18 | 44 | ||||
| ANOVA/ANCOVA | 3 | 7.3 | ||||
| Propensity scores | 1 | 2.4 | ||||
| Instrumental variables | 1 | 2.4 | ||||
| Prevalence ratios | 1 | 2.4 | ||||
aBelgium (n = 1), Croatia (n = 1), Finland (n = 2), Germany (n = 2), Great Britain (n = 7), Norway (n = 1), Poland (n = 1), Slovakia (n = 1), Spain (n = 2), Sweden (n = 8), The Netherlands (n = 1), and collaborative studies between two or more European countries (n = 6).
bCanada (n = 1) and USA (n = 2).
cTen studies included two health measurements and two studies included three health measurements.
dThree studies included two health measurements categorized as “other health scales” e One study only with men, one with only women, and one for which the statistical analysis method did not allow for using gender as a variable.
fThree studies included individuals of the same age and the fourth had similar ages gIncluding previous health as well as current health-related issues such as any chronic medical condition or long-standing illness.
hFour studies presented results for two of the categories
Estimates of the health effect from unemployment for the general population
Almost half of the articles (n = 17) presented non-stratified results for the relationship between unemployment and health. Four articles presented an unadjusted odds ratio [1, 10, 16, 22], and the negative health effect ranged from 1.5 to 2.7 (Table 1). Odds ratios adjusted for one or more factors were presented in eight articles [1, 2, 10, 13, 16, 22, 25, 37] and ranged from 1.3 to 2.6. Thus, in all cases both the unadjusted and adjusted odds ratios showed significantly worse health for the unemployed. The four articles with unadjusted odds ratios also provided adjusted odds ratios. In two of the articles [16, 22] the odds ratios were lower for the adjusted and in the other two articles [1, 10] the adjusted odds ratios were higher compared with the unadjusted odds ratio.
Nine articles presented non-stratified results for the absolute difference between the groups of employed and unemployed individuals, and eight of these articles showed significantly poorer health for the unemployed [11, 19, 22, 37, 38, 40, 41, 45, 46]. The ninth article showed no indication of differences between the employed and unemployed and concluded that the differences shown in other studies are due to health selection [7]. The remaining 24 articles only presented stratified comparisons between the groups and/or no comparisons between employed and the heterogeneous group of unemployed (presenting results for two or more groups based on reason for unemployment).
Gender
Three studies did not include gender in their analysis. One focused only on men [39], one focused only on women [33], and one used a fixed effects model for its statistical analysis that did not allow for time-invariant variables such as gender [14]. A majority of the 38 studies that included gender in their statistical analysis (66%) presented results of the effect of unemployment on health for men and women (Table 2). Among these studies, it was more common to find a more negative health effect due to unemployment for men [3, 5, 6, 13, 22–24, 28–30, 32] than for women [1, 15, 18, 31, 35, 36], and some studies found too small of a difference to reach a conclusion [17, 21, 26, 34, 41]. Comparisons between men and women were not reasonable for three of the studies [4, 19, 20].
In women, a significantly poorer health for the unemployed compared to the employed were commonly reported with adjusted odds ratios in the range from 1.5 to 2.5, while results among men varied more. The three studies that included countries from Eastern Europe showed a larger negative health effect for men than women from unemployment [4, 6, 22], and this was also the case for the two Spanish studies in our review that both showed a much larger numerical health effect from unemployment for men [3, 30]. However, it is notable that even though it was more common to see a more negative health effect in men than in women, the results for Swedish individuals more often showed that unemployed women [1, 18, 31, 34] were worse off than men [5, 24].
There were only a few cases where there was no significant negative effect from unemployment on health for either of the sexes. For women, such results were reported in Finland [34], Australia [32], and Spain [30]. For men, such results were reported in Sweden (at 30 years of age [31] and at 42 years of age [18]), in a multi-country European study looking at unemployment due to plant closures and layoffs [36], and in Denmark [34].
Thus, most studies have reported poorer health from unemployment in both men and women. How unemployment affects men and women varies between studies, but the majority of studies suggest that this is a bigger problem for men than for women.
Age
Age was included in the analytic model or was presented with results on factor levels for most articles (37 of 41 studies). Four studies did not take age into consideration because all individuals in the studies were of similar age [18, 20, 21, 31]. Only a minority (n = 11) of the articles presented stratified results for the unemployment effect in different age groups (Table 2). In these studies, the age group that suffered the most from unemployment varied (Table 3) and depended on factors such as the reason for unemployment [35], country, and time period of the measurements. For example, there is less of a negative health effect in young Swedish unemployed adults in the more recent time period (1992–1997) than in the more past time period (1983–1989) [1].
Table 3.
The effect on health from unemployment within different age groups
| Country | Health measure | Results for age analysis in papera | ||
|---|---|---|---|---|
| Belgium [12] | Health Daily Living Form Global Depression Scale | 20–29 | OR: 3.2* | |
| 30–39 | OR: 4.5* | |||
| 40–49 | OR: 2.4* | |||
| 50–65 | OR: 0.8 NS | |||
| Canada [9] | Distress Scale | 18–30 | Difference: −0.05 NS | |
| 31–55 | Difference: +0.20* | |||
| China [25] | Health Compared To Peers | 20–29 | OR: 1.4* | |
| 30–39 | OR: 1.2 NS | |||
| 40–49 | OR: 1.6* | |||
| Spain [30] | General Health Questionnaire | 25–34 | Males | PR: 1.9 NS |
| Females | PR: 1.4 NS | |||
| 35–44 | Males | PR: 2.7* | ||
| Females | PR: 0.6 NS | |||
| 45–54 | Males | PR: 3.6* | ||
| Females | PR: 1.5 NS | |||
| 55–64 | Males | PR: 2.4* | ||
| Females | PR: 1.5 NS | |||
| Great Britain [15] | General Health Questionnaire | 16–29 | Difference: +0.6b | |
| 30–39 | Difference: +0.87b | |||
| 40–49 | Difference: +0.82b | |||
| 50–64 | Reference | |||
| Germany [35] | Mental Component Summary Scale | 50–58 | Unemployed due to plant closure | Differencec: +1.629d |
| Unemployed due to other reasons | Differencec: −0.21d | |||
| All | Unemployed due to plant closure | Differencec: +0.492 | ||
| Unemployed due to other reasons | Differencec: −0.11 | |||
| Sweden [1] | Self-rated health, 5 levels | 16–25 | Years: 1983–1989 | OR: 3.8* |
| Years: 1992–1997 | OR: 2.6* | |||
| 26–45 | Years: 1983–1989 | OR: 1.6 NS | ||
| Years: 1992–1997 | OR: 3.4* | |||
| 46–64 | Years: 1983–1989 | OR: 1.3 NS | ||
| Years: 1992–1997 | OR: 2.8* | |||
| Sweden [5] | General Health Questionnaire | 20–39 | 1–130 days of unemployment | OR: 1.1 NS |
| More than 130 days of unemployment | OR: 1.2* | |||
| 40–59 | 1–130 days of unemployment | OR: 1.2 NS | ||
| More than 130 days of unemployment | OR: 1.6* | |||
| Sweden [20] | Quality of life instrument | Comparisons are only made between age groups for unemployed and employed separately. Differences between age groups show no obvious age-related pattern. | ||
| Sweden [19] | Quality of life instrument | Similar analysis performed as for study above | ||
| European collaboration [13] | ”Do you have any chronic physical or mental health problem, illness or disability?” | 20–45 | Odds ratio 1.31* | |
| 46–65 | Odds ratio: 1.26* | |||
*Significant difference in health between unemployed and employed individuals in age group at the 5% level.
OR = odds ratio, PR = prevalence ratio, NS = no significant difference in health between unemployed and employed individuals in age group at 5% level.
aFor all odds ratios and prevalence ratios, a ratio above 1 indicates a worse health effect for unemployed than employed individuals. The model with the most variables in it is chosen for all presentations in the table.
bComparisons are not presented for health differences between employed and unemployed individuals.
cA positive difference means that the unemployed person tends to have better health.
dResults for age are presented as part of the tests for robustness of the analytical model.
Socioeconomic factors
A clear majority of articles (73%) included education level in their analytical model (Table 2), but only three articles presented stratified results that allowed for comparisons on a factor level [1, 17, 32]. One of these studies was performed in Sweden [1], and this study found that for the years 1983 to 1989 there was significantly worse health for the unemployed than the employed among those having only primary or secondary education. In more recent years (1992–1997), significantly greater health effects were seen among those who were unemployed and who had secondary or post-secondary education. Inconclusive results were also seen in the two Australian studies that stratified for education level [17, 32].
Of 13 studies that involved household income, only two presented stratified results for wage groups. An Australian study showed that the negative effect due to employment on mental health was larger for men in the higher half of the salary range, but the opposite situation was seen for life satisfaction (which was not included as a health measure in our article) in both men and women [17]. In one Swedish study, it was only the group with the lowest salary among both the short- and long-term unemployed for whom unemployment led to significantly poorer health [5].
Socioeconomic status was included in eight articles and was most often defined as manual vs. non-manual workers. Half of the articles presented stratified results. In all articles, the pattern was that the manual workers had a greater negative health effect from unemployment than non-manual workers [3, 5, 30, 40], at least among the long-term unemployed [3, 5, 30].
Thus, socioeconomic status seems to be important in the health effect of unemployment, but it is not as clear what role education and salary have for the effect of unemployment on health.
Family factors
Despite over half of the articles (56%) using marital status in their analyses, only two stratified the data based on this variable (Table 2). Both of these studies showed no apparent differences in health effect from unemployment between married persons and unmarried persons [1, 3]. A related topic is having a child at home. Not having a child at home was related to poorer health in both Swedish and Finnish women, but unemployment showed no difference in health effect between groups [33]. However, it was reported that Spanish women have significantly worse health if they have no child at home and have no unemployment benefits. Thus, having children might be a protective factor against unemployment-related health effects, at least under some circumstances [3].
Social situation
Both a Chinese and a German study found tendencies that a strong social network was related to a smaller negative health effect due to unemployment [23, 25]. In the Chinese study, it was also shown that high alcohol consumption was related to a larger negative difference in health between unemployed and employed individuals [25]. However, the causality of the relation, i.e. whether the alcohol consumption was causing unemployment or unemployment was causing a higher alcohol intake, could not be proven due to the use of a cross-sectional study design.
Geographical comparisons
In our review, there were five articles that presented results for two or more European countries [2, 6, 13, 33, 34] and three articles that presented results for different regions within the same country [1, 25, 35] (Table 2).
Cooper et al. presented odds ratios for the relationship between unemployment and health for ten European countries [13]. For four countries, the odds ratio was below 1.1 but for Greece and Austria it was above 2. Contrary to these results, it was shown in the study by Alavania et al. that there were no significant negative effects on health from unemployment in Greece and Austria [2], but there was a significant effect in Denmark even though Denmark had an odds ratio below 1 in the study by Cooper et al. There were also differences between countries in the other three multi-country studies [6, 33, 34].
The three studies that presented results from different areas within the same country showed that Sweden had a tendency for more negative health effects from unemployment in bigger cities [1], China had significantly worse health for the unemployed in two of three cities studied [25], and Germany had differences in effects between the eastern and western parts of the country [35].
Thus, the effect from unemployment on health varies between studies as well as within and between countries. Even estimates for the same countries can vary to a high extent between studies.
Ethnicity and immigrant status
Two articles made comparisons based on the individual’s parent’s country of origin [1, 37]. A Swedish study compared health between unemployed and employed people born either in Sweden or somewhere else. There were negative health effects from unemployment for both time periods examined in that study for those born in Sweden, but negative health effects from unemployment were only seen in the latter time period (1993–1997) for those not born in Sweden (it should be noted that the odds ratio was still lower during this period than for those born in Sweden). Similar results were shown in the Netherlands where native Dutch and Antillean/Surinamese ethnic groups experienced a significant negative effect on health from unemployment, but not the Turkish/Moroccan and refugee groups (the size of the negative health effect from unemployment was as well larger in the first two groups) [37].
Unemployment subgroups
Analyses based on reason for unemployment were stratified in four articles [11, 35, 36, 40] (Table 2). In an article based on US citizens that used two different study populations the unemployed were divided into two groups, one defined as being unemployed due to health reasons and the other being those who were unemployed for all other reasons [11]. In both of the populations, there was a more negative health effect among those who had lost their job due to health reasons in comparison with the employed. For those who lost their job due to other reasons than health issues, there was a small but significant negative health effect for the unemployed in one of the populations but not the other. In another US study, results were presented for white-collar and blue-collar workers. For blue-collar workers who were fired/laid-off or who had a voluntary job separation, there was a significantly greater health effect than for comparable white-collar workers, but the opposite was the case for those unemployed due to miscellaneous job separations [40]. Both in a German study and in a European multi-country study, the focus was mainly on the effect from job loss due to plant closure [35, 36]. The German study showed a small and non-significant positive health effect due to plant closure for both men and women, and the other study showed a negative effect from unemployment in all their groups, but the differences were not statistically significant for all groups.
Another interesting observation was made by Gathergood [15]. His model shows that the local unemployment rate in Great Britain affects the size of the health effect for the unemployed, with a lower unemployment rate being related to a larger negative health effect from unemployment.
Discussion
Our review shows that unemployment affects people differently depending on the context in which a study has been performed. There were differences at the factor level for gender, age, education level, household income, and geographical location, but these varied between studies making firm conclusions difficult to support. Strong indicators of a more negative health effect due to unemployment were only seen for socioeconomic status (where the health of the manual workers was more negatively affected by unemployment), reason for unemployment (where the unemployed due to health reasons are worse off), and social network (where a strong social network was beneficial). However, only for age, gender, and geographic location were there more than eight studies that presented stratified results. It is therefore difficult to make firm conclusions on factor levels. Still, even if conclusions on factor levels can be drawn from the little evidence that exist, we can still conclude that the study context is of high importance for any results on how unemployment affects health.
Historically, the focus has been on describing whether people in general suffer a negative health effect from unemployment. We believe that it is of greater relevance to understand the extent to which unemployment causes health problems in different settings and for different factors instead of focusing on the effect size at the population level as was the case in the meta-analyses by McKee-Ryan et al. [45] and by Paul and Moser [46]. The balance of the factors we have investigated – as well as other factors such as the labour market system in a country – within the groups of unemployed and employed is a major issue in any analysis of the relation between unemployment and health. The health effect will, therefore, be the result of the composition of the population, and generalizations to larger communities – which the published meta-analyses attempt to do – might be misleading.
In our review, it was more common for studies to show a more negative health effect from unemployment for men than for women [3, 5, 6, 13, 22–24, 28–30, 32]. This might, at least in some studies, be explained by expectations for women not to have to work resulting in the man being the main income source for the family and, therefore, more vulnerable to unemployment. However, in some countries, such as Sweden, it is more common for women to be an active part of the work force than in some other countries [18], e.g. Spain during the 1990s. Thus, even if the Spanish studies show only a small negative health effect for women, this effect might not be explained by unemployment not having a negative effect on them [3, 30].
Age was also a factor for which the effect from unemployment on health varied. Paul and Moser showed in their meta-analysis signs of a U-shaped association between age and health problems due to unemployment that favoured middle-aged persons [46]. They did not present a detailed overview of their included studies and it is, therefore, not possible to judge whether they had a clear pattern within studies or if it was only the estimates from the meta-analysis that showed this pattern. We summarized the age-related odds ratios that have been presented in studies included in our present review, and we cannot support the proposal of a U-shaped effect size from unemployment. Instead we believe that how unemployment affects people of different ages will depend on the study context and will, therefore, vary between populations.
The results are also inconclusive for education level and salary. However, manual workers seem to suffer more from unemployment than non-manual workers, which perhaps can be considered contradictory to the inconclusive results for education level and salary. There are also indications of more serious negative health effects from unemployment for individuals with a poor social network.
Differences between and within countries illustrate that the health-related problems from unemployment cannot be seen as an equal burden in all contexts. Interestingly, there are indications that unemployment is less of a burden for immigrants [1, 37]. This might, however, be explained by both a generally poorer health for employed immigrants and the fact that immigrants usually have the least desirable jobs. Any conclusion regarding the effect on health from unemployment for immigrants should be treated with caution until further studies can be performed and until explanatory factors have been better analysed.
Methodological considerations
The labour market has changed over time and the relevance of “old” data is lower for today’s situation which are the one we aim to describe in our review. We therefore restricted ourselves to articles published from 2003 and later. The year of publication is a good indicator of how recently data was collected in our review. The cut-off of 2003 meant that we covered all studies which included data collected from 1996 and more recently. There were 15 studies in our Web of Science search that were published from 1996 to 2002, but none of them included data from 1996 or more recently and fulfilled all other criteria for being included in our review. In the early 1990s there were a recession in many countries and to focus on the time after this would for such reason be logical. Among our 41 articles we had “old” data; 10 articles only included data from 1999 or earlier, and 15 articles included data collected before and after 1999, while one study lacked information about the year(s) data was collected. Thus, restricting ourselves to studies with data from no earlier than 2001 would have resulted in only 15 studies in our review, and extending the publication year to 1996 would not have added articles with more recent data than from 1995. We therefore think that our restriction to articles from no earlier than 2003 is motivated despite a change in pattern over time identified in some studies in our review [1, 3, 30].
The goal with our review was to include all relevant articles. We are aware that our search term in Web of Science might not have been sufficient for finding all relevant articles. We decided to perform our search based on the title of the article. An alternative approach would have been to extend the search to the topic of the article. This would have produced a list of around 90,000 articles from 2003 to 2013. There are also approaches which focus on extending the number of articles through previous searches such as the measure-driven approach suggested by Roelfs et al. [49]. However, alternative approaches are time demanding. Our search in PubMed, using MeSH terms, gave us only one additional article for the time period 2003 to 2013, which indicates that our search may be sufficient to find articles which target the effect on health from unemployment. We did not include articles without our key words in the title as they are likely to mainly target the relationship between health and a variable different than employment status. Including such articles could cause publication bias, as employment status might be removed from the statistical model if there is at most a marginal effect on health. Still, such articles might have contributed with important information for our review. We may still have a publication bias from our selection of articles, but we were not able to assess it because methods that assess publication bias require an effect measurement that is comparable for a reasonably large sample size. In our review, the number of articles which used the same effect measurement for the same health estimate was small.
It is an unavoidable problem in an observational study that the characteristics of two groups that are to be compared cannot be guaranteed to be similar to the same extent as is in a random controlled study. To overcome this problem most articles in our review are “controlling” for other factors in the statistical method. However, even though this creates comparable groups and unbiased estimates, the estimates will be highly affected by the composition of the study population. This becomes very obvious from the results that we present at the factor level. Longitudinal studies can better control for factors that occur before unemployment than cross-sectional studies can. We considered only including longitudinal studies, but the interpretation from our analysis is that the results at most differ marginally between the included longitudinal and cross-sectional studies.
Interestingly, the estimates for the unadjusted (ranging from 1.5 to 2.7) and adjusted (ranging from 1.3 to 2.6) estimates of the odds ratios for the effect on health from unemployment were rather similar [1, 2, 10, 13, 16, 22, 25, 37]. In the few studies that presented both adjusted and unadjusted estimates, the adjusted odds ratio were lower in two studies [1, 10], and the unadjusted odds ratio lower in the other two studies [16, 22]. Due to these similarities in estimates, it can be questioned whether studies in our review are correctly controlling for other factors. In most of the studies, we could not identify any reasoning about the role of these factors in the statistical model. Hence, estimates of the adjusted odds ratios in the articles might be biased rather than the adjusted and unadjusted estimates of the odds ratios not differing much.
We restricted our analyses on factor levels to studies which had presented stratified estimates. It would have been valuable to include all articles which used a factor in our analysis and such an approach is also common in meta-analyses. However, studies in our review differ in which variables are included in the statistical model and the study results depend on the study context. It would therefore be very complicated to derive representative estimates for differences on factor levels. Such advanced analysis is beyond the scope of this article. However, we think that there is support for our main conclusion without it.
Primarily the cross-sectional studies, but also the longitudinal studies, included in our review had difficulties in proving causality in the relationship between unemployment and health. Controlling for both health-related issues and other factors before unemployment will improve estimates. The interpretations in our review have not put much emphasis on the causality problem, but we do think that the conclusions from our review are still valid.
The articles in the review used a variety of instruments to collect information about self-assessed health. Most common was self-rated health, which was used in almost half (n = 19) of the studies, and it was measured with both five (n = 14) and three (n = 6) response alternatives. Thus, for all health measurements it was at most a small number of studies using it. Despite the difficulties in comparing the measurements, we find a value of including any self-assessed measurement to provide all relevant evidence for the effect on health from unemployment (both with and without stratification), even if one health measurement would have been more frequently used. The wide range of health measures for self-assessed health is a weakness which might alter some of our interpretations in the result section. However, we are convinced that the conclusions of our review are not much affected by this limitation.
Morbidity-related measurements are usually a good indicator of how individuals rate their health. However, it is well-known that even an individual with a severe disease can consider their health to be good. Hence, morbidity-related measurements might not refer to how well the individual feels, and therefore differ too much from our definition of self-assessed health. Neither do we think that mortality is possible to compare with self-assessed health as it is a rare and more severe outcome. Actually, we propose that it would be valuable to perform a similar approach as ours to morbidity-related measurements and mortality in relation to unemployment, but this is beyond the scope of our review.
We extracted relevant information from the articles in our review (see Table 1). However, the quality of the methods sections of the articles varied and we cannot with certainty confirm that everything has been interpreted correctly. These problems included not only difficulties in interpreting the study design and the statistical methods, but also problems with the documentation of the variable specifications. For example, no specification of family composition was provided in one of the studies [12] and no mention of the included ages was made in another study [17]. This is a weakness in our review, but we believe that these shortcomings might have only a slight effect on our conclusions.
Conclusions
We have shown that unemployment affects groups of individuals differently. Still, there are a few factors, among them socioeconomic status, reason for unemployment, and social network, where a clear pattern can be seen. For gender, age, and education level, which are most commonly stratified for, the results differ between studies and seem to depend to a large degree on the study context. Because unemployment affects groups differently, we believe that greater effort should be spent on groups of individuals, such as men or women, instead of the population as a whole.
Electronic supplementary material
Additional file 1: PRISMA 2009 Checklist. (DOC 64 KB)
Additional file 2: Selection of articles. (DOCX 185 KB)
Acknowledgement
The study was funded by the Swedish Research Council for Health, Working Life and Welfare and the Swedish Research Council for Environment, Agricultural Sciences and Spatial Planning. The study was undertaken at the Umeå Centre for Global Health Research at Umeå University.
Financial support
The study was funded by the Swedish Research Council for Health, Working Life and Welfare and the Swedish Research Council for Environment, Agricultural Sciences and Spatial Planning.
Footnotes
Competing interests
The authors declare that they have no competing interests.
Authors’ contributions
FN designed the study, performed the article search, reviewed the articles, performed the analyses, and drafted the paper. PV, AH, PEG and UJ made substantial contributions to study design, and were involved in drafting the manuscript as well as revising the manuscript critically for important intellectual content. All authors read and approved the final manuscript to be published.
Contributor Information
Fredrik Norström, Email: fredrik.norstrom@epiph.umu.se.
Pekka Virtanen, Email: pekka.j.virtanen@uta.fi.
Anne Hammarström, Email: anne.hammarstrom@umu.se.
Per E Gustafsson, Email: per.e.gustafsson@umu.se.
Urban Janlert, Email: urban.janlert@epiph.umu.se.
References
- 1.Åhs A, Westerling R. Self-rated health in relation to employment status during periods of high and of low levels of unemployment. Eur J Public Health. 2006;16(3):294–304. doi: 10.1093/eurpub/cki165. [DOI] [PubMed] [Google Scholar]
- 2.Alavinia SM, Burdorf A. Unemployment and retirement and ill-health: a cross-sectional analysis across European countries. Int Arch Occ Env Hea. 2008;82(1):39–45. doi: 10.1007/s00420-008-0304-6. [DOI] [PMC free article] [PubMed] [Google Scholar]
- 3.Artazcoz L, Benach J, Borrell C, Cortes I. Unemployment and mental health: Understanding the interactions among gender, family roles, and social class. Am J Public Health. 2004;94(1):82–88. doi: 10.2105/AJPH.94.1.82. [DOI] [PMC free article] [PubMed] [Google Scholar]
- 4.Bacikova-Sleskova M, van Dijk JP, Geckova AM, Nagyova I, Salonna F, Reijneveld SA, Groothoff JW. The impact of unemployment on school leavers’ perception of health. Mediating effect of financial situation and social contacts? Int J Public Health. 2007;52(3):180–187. doi: 10.1007/s00038-007-6071-4. [DOI] [PubMed] [Google Scholar]
- 5.Backhans MC, Hemmingsson T. Unemployment and mental health-who is (not) affected? Eur J Public Health. 2012;22(3):429–433. doi: 10.1093/eurpub/ckr059. [DOI] [PubMed] [Google Scholar]
- 6.Bambra C, Eikemo TA. Welfare state regimes, unemployment and health: a comparative study of the relationship between unemployment and self-reported health in 23 European countries. J Epidemiol Commun H. 2009;63(2):92–98. doi: 10.1136/jech.2008.077354. [DOI] [PubMed] [Google Scholar]
- 7.Böckerman P, Ilmakunnas P. Unemployment and Self-Assessed Health: Evidence from Panel Data. Health Econ. 2009;18(2):161–179. doi: 10.1002/hec.1361. [DOI] [PubMed] [Google Scholar]
- 8.Booker CL, Sacker A. Psychological well-being and reactions to multiple unemployment events: adaptation or sensitisation? J Epidemiol Commun H. 2012;66(9):832–838. doi: 10.1136/jech.2010.126755. [DOI] [PubMed] [Google Scholar]
- 9.Breslin FC, Mustard C. Factors influencing the impact of unemployment on mental health among young and older adults in a longitudinal, population-based survey. Scand J Work Env Hea. 2003;29(1):5–14. doi: 10.5271/sjweh.698. [DOI] [PubMed] [Google Scholar]
- 10.Brown J, Demou E, Tristram MA, Gilmour H, Sanati KA, Macdonald EB. Employment status and health: understanding the health of the economically inactive population in Scotland. BMC Public Health. 2012;12:327. doi: 10.1186/1471-2458-12-327. [DOI] [PMC free article] [PubMed] [Google Scholar]
- 11.Burgard SA, Brand JE, House JS. Toward a better estimation of the effect of job loss on health. J Health Soc Behav. 2007;48(4):369–384. doi: 10.1177/002214650704800403. [DOI] [PubMed] [Google Scholar]
- 12.Burnay N, Kiss P, Malchaire J. Sociability, life satisfaction, and mental health according to age and (un)employment status. Int Congr Ser. 2005;1280:347–352. doi: 10.1016/j.ics.2005.02.048. [DOI] [Google Scholar]
- 13.Cooper D, McCausland WD, Theodossiou I. Unemployed, uneducated and sick: the effects of socio-economic status on health duration in the European Union. J R Stat Soc a Stat. 2008;171:939–952. doi: 10.1111/j.1467-985X.2008.00541.x. [DOI] [Google Scholar]
- 14.Flint E, Bartley M, Shelton N, Sacker A. Do labour market status transitions predict changes in psychological well-being? J Epidemiol Community Health. 2013;67(9):796–802. doi: 10.1136/jech-2013-202425. [DOI] [PubMed] [Google Scholar]
- 15.Gathergood J. An instrumental variable approach to unemployment, psychological health and social norm effects. Health Econ. 2013;22(6):643–654. doi: 10.1002/hec.2831. [DOI] [PubMed] [Google Scholar]
- 16.Giatti L, Barreto SM, Cesar CC. Unemployment and self-rated health: Neighborhood influence. Soc Sci Med. 2010;71(4):815–823. doi: 10.1016/j.socscimed.2010.05.021. [DOI] [PubMed] [Google Scholar]
- 17.Green F. Unpacking the misery multiplier: How employability modifies the impacts of unemployment and job insecurity on life satisfaction and mental health. J Health Econ. 2011;30(2):265–276. doi: 10.1016/j.jhealeco.2010.12.005. [DOI] [PubMed] [Google Scholar]
- 18.Hammarström A, Gustafsson PE, Strandh M, Virtanen P, Janlert U. It’s no surprise! Men are not hit more than women by the health consequences of unemployment in the Northern Swedish Cohort. Scand J Public Healt. 2011;39(2):187–193. doi: 10.1177/1403494810394906. [DOI] [PubMed] [Google Scholar]
- 19.Hultman B, Hemlin S. Self-rated quality of life among the young unemployed and the young in work in northern Sweden. Work. 2008;30(4):461–472. [PubMed] [Google Scholar]
- 20.Hultman B, Hemlin S, Hörnquist JO. Quality of life among unemployed and employed people in northern Sweden. Are there any differences? Work (Reading, Mass) 2006;26(1):47–56. [PubMed] [Google Scholar]
- 21.Janlert U, Hammarström A. Which theory is best? Explanatory models of the relationship between unemployment and health. BMC Public Health. 2009;9:235. doi: 10.1186/1471-2458-9-235. [DOI] [PMC free article] [PubMed] [Google Scholar]
- 22.Kaleta D, Makowiec-Dabrowska T, Jegier A. Employment status and self rated health. Int J Occup Med Env. 2008;21(3):227–236. doi: 10.2478/v10001-008-0023-y. [DOI] [PubMed] [Google Scholar]
- 23.Kroll LE, Lampert T. Unemployment, social support and health problems results of the GEDA study in Germany, 2009. Dtsch Arztebl Int. 2011;108(4):47–U14. doi: 10.3238/arztebl.2011.0047. [DOI] [PMC free article] [PubMed] [Google Scholar]
- 24.Lindström M. Psychosocial work conditions, unemployment and self-reported psychological health: a population-based study. Occup Med-Oxford. 2005;55(7):568–571. doi: 10.1093/occmed/kqi122. [DOI] [PubMed] [Google Scholar]
- 25.Luo J, Qu Z, Rockett I, Zhang X. Employment status and self-rated health in north-western China. Public Health. 2010;124(3):174–179. doi: 10.1016/j.puhe.2010.02.001. [DOI] [PubMed] [Google Scholar]
- 26.Olesen SC, Butterworth P, Leach LS, Kelaher M, Pirkis J. Mental health affects future employment as job loss affects mental health: findings from a longitudinal population study. Bmc Psychiatry. 2013;13:144. doi: 10.1186/1471-244X-13-144. [DOI] [PMC free article] [PubMed] [Google Scholar]
- 27.Østhus S. Health effects of downsizing survival and job loss in Norway. Soc Sci Med. 2012;75(5):946–953. doi: 10.1016/j.socscimed.2012.04.036. [DOI] [PubMed] [Google Scholar]
- 28.Popham F, Bambra C. Evidence from the 2001 English Census on the contribution of employment status to the social gradient in self-rated health. J Epidemiol Commun H. 2010;64(3):277–280. doi: 10.1136/jech.2009.087452. [DOI] [PubMed] [Google Scholar]
- 29.Popham F, Gray L, Bambra C. Employment status and the prevalence of poor self-rated health. Findings from UK individual-level repeated cross-sectional data from 1978 to 2004. Bmj Open. 2012;2:e001342. doi: 10.1136/bmjopen-2012-001342. [DOI] [PMC free article] [PubMed] [Google Scholar]
- 30.Puig-Barrachina V, Malmusi D, Martinez JM, Benach J. Monitoring social determinants of health inequalities: the impact of unemployment among vulnerable groups. Int J Health Serv. 2011;41(3):459–482. doi: 10.2190/HS.41.3.d. [DOI] [PubMed] [Google Scholar]
- 31.Reine I, Novo M, Hammarström A. Unemployment and ill health - a gender analysis: results from a 14-year follow-up of the Northern Swedish Cohort. Public Health. 2013;127(3):214–222. doi: 10.1016/j.puhe.2012.12.005. [DOI] [PubMed] [Google Scholar]
- 32.Richardson S, Lester L, Zhang GY. Are casual and contract terms of employment hazardous for mental health in Australia? J Ind Relat. 2012;54(5):557–578. doi: 10.1177/0022185612454974. [DOI] [Google Scholar]
- 33.Roos E, Burström B, Saastamoinen P, Lahelma E. A comparative study of the patterning of women’s health by family status and employment status in Finland and Sweden. Soc Sci Med. 2005;60(11):2443–2451. doi: 10.1016/j.socscimed.2004.11.020. [DOI] [PubMed] [Google Scholar]
- 34.Roos E, Lahelma E, Saastamoinen P, Elstad JI. The association of employment status and family status with health among women and men in four Nordic countries. Scand J Public Healt. 2005;33(4):250–260. doi: 10.1080/14034940510005680. [DOI] [PubMed] [Google Scholar]
- 35.Schmitz H. Why are the unemployed in worse health? The causal effect of unemployment on health. Labour Econ. 2011;18(1):71–78. doi: 10.1016/j.labeco.2010.08.005. [DOI] [Google Scholar]
- 36.Schröder M. Jobless now, sick later? Investigating the long-term consequences of involuntary job loss on health. Adv Life Course Res. 2013;18(1):5–15. doi: 10.1016/j.alcr.2012.08.001. [DOI] [PubMed] [Google Scholar]
- 37.Schuring M, Burdorf A, Kunst A, Voorham T, Mackenbach J. Ethnic differences in unemployment and ill health. Int Arch Occ Env Hea. 2009;82(8):1023–1030. doi: 10.1007/s00420-009-0408-7. [DOI] [PMC free article] [PubMed] [Google Scholar]
- 38.Sersic DM, Sverko B, Galesic M. Unemployment and dimensions of subjective health: Exploring moderating effects of age. Stud Psychol. 2005;47(3):221–234. [Google Scholar]
- 39.Steele F, French R, Bartley M. Adjusting for selection bias in longitudinal analyses using simultaneous equations modeling the relationship between employment transitions and mental health. Epidemiology. 2013;24(5):703–711. doi: 10.1097/EDE.0b013e31829d2479. [DOI] [PubMed] [Google Scholar]
- 40.Strully KW. Job loss and health in the US labor market. Demography. 2009;46(2):221–246. doi: 10.1353/dem.0.0050. [DOI] [PMC free article] [PubMed] [Google Scholar]
- 41.Virtanen P, Liukkonen V, Vahtera J, Kivimäki M, Koskenvuo M. Health inequalities in the workforce: the labour market core-periphery structure. Int J Epidemiol. 2003;32(6):1015–1021. doi: 10.1093/ije/dyg319. [DOI] [PubMed] [Google Scholar]
- 42.Herbig B, Dragano N, Angerer P. Health in the long-term unemployed. Dtsch Arztebl Int. 2013;110(23–24):413–419. doi: 10.3238/arztebl.2013.0413. [DOI] [PMC free article] [PubMed] [Google Scholar]
- 43.Wanberg CR. The individual experience of unemployment. Annu Rev Psychol. 2012;63:369–396. doi: 10.1146/annurev-psych-120710-100500. [DOI] [PubMed] [Google Scholar]
- 44.Jin RL, Shah CP, Svoboda TJ. The impact of unemployment on health: a review of the evidence (Reprinted from Canadian Medical Association Journal, vol 153, pg 529–40, 1995) J Public Health Pol. 1997;18(3):275–301. doi: 10.2307/3343311. [DOI] [PMC free article] [PubMed] [Google Scholar]
- 45.McKee-Ryan FM, Song ZL, Wanberg CR, Kinicki AJ. Psychological and physical well-being during unemployment: A meta-analytic study. J Appl Psychol. 2005;90(1):53–76. doi: 10.1037/0021-9010.90.1.53. [DOI] [PubMed] [Google Scholar]
- 46.Paul KI, Moser K. Unemployment impairs mental health: Meta-analyses. J Vocat Behav. 2009;74(3):264–282. doi: 10.1016/j.jvb.2009.01.001. [DOI] [Google Scholar]
- 47.Murphy GC, Athanasou JA. The effect of unemployment on mental health. J Occup Organ Psych. 1999;72:83–99. doi: 10.1348/096317999166518. [DOI] [Google Scholar]
- 48.Moher D, Liberati A, Tetzlaff J, Altman DG, Group P. Preferred reporting items for systematic reviews and meta-analyses: the PRISMA statement. Plos Med. 2009;6(7):e1000097. doi: 10.1371/journal.pmed.1000097. [DOI] [PMC free article] [PubMed] [Google Scholar]
- 49.Roelfs DJ, Shor E, Falzon L, Davidson KW, Schwartz JE. Meta-analysis for sociology - a measure-driven approach. BMS. 2013;117(1):75–92. doi: 10.1177/0759106312465554. [DOI] [PMC free article] [PubMed] [Google Scholar]
Pre-publication history
- The pre-publication history for this paper can be accessed here: http://www.biomedcentral.com/1471-2458/14/1310/prepub
Associated Data
This section collects any data citations, data availability statements, or supplementary materials included in this article.
Supplementary Materials
Additional file 1: PRISMA 2009 Checklist. (DOC 64 KB)
Additional file 2: Selection of articles. (DOCX 185 KB)