

Abstract
Association rules mining methods have been recently applied to gene expression data analysis to reveal relationships between genes and different conditions and features. However, not much effort has focused on detecting the relation between gene expression maps and related gene functions. Here we describe such an approach to mine association rules among gene functions in clusters of similar gene expression maps on mouse brain. The experimental results show that the detected association rules make sense biologically. By inspecting the obtained clusters and the genes having the gene functions of frequent itemsets, interesting clues were discovered that provide valuable insight to biological scientists. Moreover, discovered association rules can be potentially used to predict gene functions based on similarity of gene expression maps.
Keywords: association rules mining, gene expression maps, gene functions, clustering, voxelation
1. Introduction
Association rule mining is a widely used technique in data mining. The general problem of discovering association rules was introduced in [1]. Since then, there has been considerable work on designing algorithms for mining such rules. In recent years, the techniques of association rule mining have been applied to gene expression data analysis to reveal relationships between genes and different conditions and features. In addition, different features and conditions have been used to extract interesting patterns from gene expression datasets. One goal of gene expression data mining is to detect a set of genes expressed together in a non-random pattern. Another goal is to try to determine what genes are expressed as a result of certain cellular conditions, for example, what genes are expressed in diseased cells that are not expressed in healthy cells. Related work has been done to detect association rules among genomic data. Rodriguez et al. [2] used a modified version of the Apriori algorithm [3, 4] to discover relations between protein sequences and protein features. Hermert et al. [5] mined the mouse atlas gene expression database for association rules among spatial regions and genes, and Dafas et al. [6] gave a review of recent developments of association rule mining methodologies in gene expression data. Furthermore, a few algorithms such as JG-tree [7], BSC-tree and FIS-tree [8], etc, were applied to mine association rules among different genes under the same experimental conditions. More recently, Francisco et al. [9] applied fuzzy association rules [10] over a yeast genome dataset containing heterogeneous information regarding structural and functional genome features, and Gaurav et al. [11] proposed an association analysis framework to find coherent gene groups from microarray data.
In the field of gene expression data analysis, gene expression signatures in the mammalian brain are very important and hold the key to understanding neural development and neurological disease. Researchers at David Geffen School of Medicine at UCLA have used voxelation in combination with microarrays to analyze whole mouse brains for acquisition of genome-wide atlases of expression patterns in the brain [12, 13], where voxelation is a method involving dicing the brain into spatially registered voxels (cubes).
For the particular dataset used in this study, the coronal slice from a mouse brain is cut with a matrix of blades that are spaced 1 mm apart thus resulting in 68 cubes (voxels) which are 1mm3. Then by applying microarrays in each voxel, gene expression values respectively in 68 voxels for 20,847 genes are obtained. There are voxels like A3, B9…, as Fig. 1 shows. The voxels in red, such as A1, A2, are empty voxels assigned to maintain a rectangular. So, each gene is represented by the 68 gene expression values composing a gene expression map of a mouse brain (Fig. 1). In other words, the dataset is a 20847 by 68 matrix, in which each row represents a particular gene, and each column is the gene expression value for the particular probe in a given voxel.
Fig. 1.

Voxels of the coronal slice
Our previous analysis of this dataset [14] focused on the identification of the relationship between the gene functions and gene expression maps. During this analysis, a number of clusters of genes were identified with similar gene expression maps and similar gene functions. Given the multiple maps of gene expression of mice brain and the detected clusters of genes, in this study, we mined association rules among gene functions and gene expression maps.
A number of the association rules we found using the proposed approach make sense biologically and they are interesting. The proposed analysis cannot only be used to mine functional association rules from gene expression maps, but it can also be potentially used to predict gene functions and provide useful suggestions to biologists.
The remainder of this paper is organized as follows. In Section 2, we give a brief review of association rules, extending the concept so that it can be applied to gene functions and gene expression maps. We also discuss how we obtain the significant clusters from the gene expression maps, and present an efficient algorithm for finding association rules. In Section 3 we present the results of mining the significant clusters of gene expression maps. Conclusions and ideas for future applications of this methodology are presented in Section 4.
2. Methods
2.1 Significant clusters of gene expression maps
In our previous work [14] we have detected significant clusters of gene expression maps obtained by voxelation. The genes in each significant cluster have very similar gene expression maps and similar gene functions. We used the wavelet transform for extracting features from the left and right hemispheres averaged gene expression maps, and the Euclidean distance between each pair of feature vectors to determine gene similarity. The gene function similarity was measured by calculating the average gene function distances in the Gene Ontology (GO) structure, where gene function distances were computed by the Lin method [16] applied on the GO structure.
A multiple clustering approach was employed on the extracted features to identify significant clusters [14]. In each step of multiple clustering, K-means was used to generate a number of clusters. The dataset for the next step of multiple clustering was obtained by removing the significant clusters from the current dataset. The process was repeated on the newly formed dataset until no significant clusters could be found. The hierarchical clustering was used to determine the number of clusters for K-means.
The significant clusters [14] were detected for three categories of gene ontology (Cellular Component, Molecular Function, and Biological Process) separately, and then with respect to all of the three categories together. For example, when considering the category “Cellular Component”, we only searched for significant clusters in the category “Cellular Component”. In the case where we considered all three categories together, we searched for significant clusters in any one of the three categories. Table 1 shows the number of significant clusters we detected. Fig. 2 shows the average of gene expression maps of significant clusters with respect to the category “Cellular Component”. Each small image in this figure is denoted by averaging the 68 gene expression values of all genes in the corresponding cluster.
Table 1.
Number of significant cluster
| GO Category | Number of Significant Clusters |
|---|---|
| Cellular Component | 38 |
| Molecular Function | 50 |
| Biological Process | 43 |
| All the three categories | 55 |
Fig. 2.

The 38 significant clusters found with respect to Cellular Component
2.2 Mining association rules from clusters
Association rule mining deals with the problem of finding frequent patterns, associations, correlations, or causal structures among sets of items in transaction databases. Given a set of transactions, where each transaction is a set of items, an association rule is an expression of the form X=>Y, where X and Y are subsets of items. These rules indicate that the transactions that contain X tend to also contain Y. For this rule, confidence is defined as the fraction of transactions containing X and Y to the fraction of transactions containing X, and support is defined as the fraction of transactions containing X and Y to the total number of transactions. Association rules can be generated from the frequent itemsets: the sets of items that have minimum support, i.e., the items shown together frequently in transactions. By the definition, a subset of a frequent itemset is also a frequent itemset.
Our goal is to extend the concept of association rules so that it can be applied to gene functions and gene expression maps. We apply the methods of association rule mining on the significant clusters we have previously detected in order to identify interesting rules between gene functions and gene expression maps. A significant cluster consists of genes with similar gene expression maps and similar gene functions. Each gene has several gene functions. If we use GO ID (identification number of GO term) to present each gene function, the set of GO IDs of the gene functions that a gene has can be viewed as a “transaction”. So each significant cluster can be represented as a matrix M, where Mij denotes the value of item j (GO ID) in transaction i (for i th gene). We apply the association rule concepts on the matrix M. For instance, an association rule can be “40% of the genes in a cluster that have gene function1 also have function2, while 5% of all genes in the cluster have both two functions.” In this case, 40% is the confidence of the rule (function1->function2) and 5% is its support.
We mine the association rules from transactions of the set of gene functions within each cluster using a modified Apriori algorithm. The original Apriori algorithm uses minimum support to choose the frequent itemsets. Here we modify the algorithm by determining the Significant_Ratio of an itemset to identify the rate of frequency.
In one cluster, suppose N1 is the number of genes (transactions) with certain gene functions (an itemset), and S1 is the size of the cluster. The support value of the itemset in the cluster is measured as:
Then we extend the range to the whole dataset (all clusters). Suppose N2 is the number of genes with the itemset in the whole dataset, and S2 is the size of the dataset, then the support value with respect to the whole dataset is:
Based on the above definitions, the Significant_Ratio of an itemset is defined as the ratio of the support of the itemset in the whole dataset to the support of the itemset in the significant cluster:
By finding the itemsets with small values of Significant_Ratio, we can obtain certain gene functions which show much more frequently in a significant cluster than in the general case. An itemset with a Significant_Ratio less than 0.05 is considered to be a frequent itemset.
In our dataset, each gene has up to seven functions with the annotation files obtained from Stanford Genomic Resources [17]. Based on the Apriori algorithm, we mine the frequent itemsets to obtain the sets with 1 to 7 items. At the first step, the most frequent single gene functions (itemsets of size 1) within each cluster are found. Then at the second step the frequent itemsets with two items are detected by calculating their Significant_Ratio. Similarly, the itemsets with three functions are found. The process repeats until no frequent itemset can be found or the size of the itemset reaches seven. The candidates of frequent itemsets are selected by combining the frequent itemset in the previous step with the most frequent items obtained at the first step.
After mining the frequent itemsets of each significant cluster, we analyze the interesting clusters. Frequent itemsets of different sizes are detected from each cluster. For each itemset, we search for the genes having all the functions of the itemset and plot their gene expression maps and curves.
3. Experimental Results
3.1 Discovered Association Rules
Using the proposed approach, the frequent itemsets with 2 to 7 gene functions were obtained for each significant cluster of gene expression maps. The full results are available at http://denlab.temple.edu/repository/association_rules_results.xls. In the results, all itemsets with size from 2 to 7 are reported which are all potentially important. Since all the subsets of a frequent itemset are also frequent, we omitted the subsets of the frequent itemsets in the presentation of the results. Table 2 shows the number of frequent itemsets of different sizes we detected.
Table 2.
Number of frequent itemsets detected
| Size of itemset | Number of frequent itemsets detected |
|---|---|
| 2 | 346 |
| 3 | 58 |
| 4 | 18 |
| 5 | 21 |
| 6 | 3 |
| 7 | 2 |
The itemsets with large number of gene functions are least common, so we show the sets with 7 items, and 6 items in Tables 3 and 4 respectively. The variables in the tables have been described in Section 2.3. Although these itemsets are mined from different clusters with respect to different categories, it was interesting to notice that Itemset 1 and Itemset 2, and Itemset3 and Itemset4 are both with the same set of gene functions.
Table 3.
Itemsets with 7 gene functions
| Itemset 1 | Itemset 2 |
|---|---|
| oxygen transporter activity | oxygen transporter activity |
| binding | binding |
| mitochondrion | mitochondrion |
| hemoglobin complex | hemoglobin complex |
| transport | transport |
| oxygen transport | oxygen transport |
| oxygen binding | oxygen binding |
| 22nd cluster in Cellular Component | 39th cluster in Molecular Function |
| Support1 =0.42 | Support1 =0.47 |
| N1=14 | N1=14 |
| Support2=0.0023 | Support2=0.0023 |
| N2=18 | N2=18 |
| Significant_Ratio=0.0054 | Significant_Ratio=0.0049 |
Table 4.
Itemsets with 6 gene functions
| Itemset 3 | Itemset 4 | Itemset 5 |
|---|---|---|
| oxygen transporter activity | oxygen transporter activity | calciumion binding |
| hemoglobin complex | hemoglobin complex | calcium-dependent phospholipid binding |
| transport | transport | nuclear envelope |
| oxygen transport | oxygen transport | plasma membrane |
| oxygen binding | oxygen binding | cellular calciumion homeostasis |
| hemopoiesis | hemopoiesis | cell proliferation |
| 22nd cluster in Cellular Component | 39th cluster in Molecular Function | 33rd cluster in all categories |
| Support1=0.06 | Support1=0.07 | Support1=0.05 |
| N1=2 | N1=2 | N1=2 |
| Support2=0.001 | Support2=0.001 | Support2=0.0004 |
| N2=8 | N2=8 | N2=3 |
| Significant_Ratio =0.0167 | Significant_Ratio =0.0152 | Significant_Ratio =0.0076 |
3.2 Examining interesting itemsets
Even though the subsets of frequent itemsets are excluded (as trivial), there are still hundreds of frequent itemsets found by the proposed methods. Therefore, we only examined the results by checking the frequent itemsets with large size. We selected the first frequent itemset with seven functions and the first set with six functions, i.e. Itemset 1 in Table 3 and Itemset 3 in Table 4.
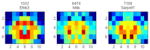
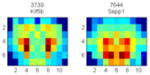
For Itemset 1, there are 14 genes with the itemset1 of gene functions listed at Table 3. If we plot the gene expression curve of the 14 genes for all 68 voxels, we get very similar gene expression maps and curves, (as shown in Fig. 3).
Fig. 3.

Gene expression maps and curves of the 14 genes with the itemset1 of gene functions
By examining Itemset 3, we found two genes which have the 6 functions listed at Table 4. The gene expression maps and curves of the two genes are shown in Fig. 4.
Fig. 4.
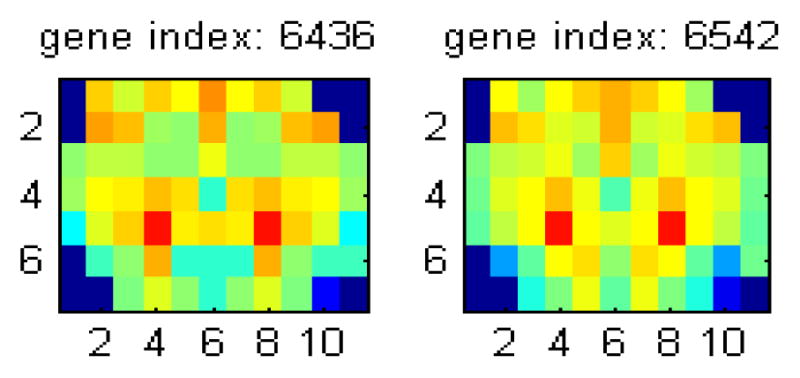

Gene expression maps and curves of the 2 genes with the itemset3 of gene functions
The 14 genes in Fig. 3 and the two genes in Fig. 4 have very similar gene expression maps and curves to each other. Furthermore, the particular form of the maps have high gene expression with red color in two voxels and low gene expression with blue color in the bottom of the central brain.
3.3 Examining interesting clusters
Table 1 shows that there are 38 to 55 significant clusters with respect to different gene ontology category. Here we looked closely into several selected clusters. The clusters are selected based on the corresponding average gene expression, which conceal interesting clues to biologists. We selected the 36th significant cluster with respect to Cellular Component because this cluster has an interesting pattern in the gene expression maps consistent to the anatomical boundaries. As Fig. 5 shows, there are 37 genes in this cluster, and most genes have a clear curve with high gene expression in the middle of the brain.
Fig. 5.

Genes in the 36th cluster of Cellular Component
In this cluster, frequent itemsets of all sizes of gene functions were considered. Table 5 shows parts of gene maps of the genes having the functions of the frequent itemsets. The genes with same itemsets also show similar or opposite images. The full results of examining several other clusters are available at http://denlab.temple.edu/repository/examining_clusters.pdf.
Table 5.
Gene maps corresponding to certain itemsets of gene functions in 36th cluster of Cellular Component
| Gene functions of the itemset | Gene expression maps of the genes with the itemset |
|---|---|
| stearoyl-CoA 9-desaturase activity |

|
| iron ion binding | |
| fatty acid biosynthetic process | |
| lipid biosynthetic process | |
| membrane | |
| stearoyl-CoA 9-desaturase activity |

|
| iron ion binding | |
| fatty acid biosynthetic process | |
| lipid biosynthetic process | |
| oxidoreductase activity | |
| structural molecule activity |

|
| synaptic transmission | |
| axon ensheathment | |
| myelination | |
| extracellular space |

|
| axon ensheathment | |
| extracellular space |
|
| cell differentiation | |
| selenium metabolic process |
|
| microtubule motor activity | |
| translation elongation factor activity |

|
| translational elongation | |
| translation |

|
| translational elongation |
4. Discussion
Although the techniques of association rule mining have been applied to gene expression data analysis, not much effort has focused on detecting the relation between gene expression maps in mice brains and related gene functions. By using the proposed methods to mine association rules among gene functions in the significant clusters of gene expression maps, a number of frequent itemsets of gene functions can be obtained. By inspecting certain clusters and specific genes which have the functions of the frequent itemsets, interesting clues might be obtained for the biological scientists. The genes which include the frequent itemsets not only have the same set of gene functions with each other, but also have very similar gene expression maps, because the rules are mined from significant clusters of genes we have previously obtained. These frequent itemsets of gene functions are correlated to the average images of gene expression maps of their corresponding clusters [14].
The association rules we have detected make sense biologically, and provide valuable insight to biologists. For instance, the genes of the 36th cluster with respect to cellular component are strongly expressed in the corpus callosum, the major body of white matter in the brain. Perhaps it is not surprising then, that these clusters have many genes involved in myelin biogenesis and fatty acid biosynthesis. It is interesting that one of the genes in the 17th cluster of molecular function is involved in selenium metabolism, suggesting a role for selenium in white matter synthesis. Genes in the 26th cluster of biological process are largely expressed in the hypothalamus, an area with many nuclei and hence rich in nerve terminals. Consistent with this, the cluster has many genes involved in protein transport. The interpretation of the remaining of significant itemsets will be reported in a future paper.
In our future work, we will further explore the algorithms and techniques to mine the gene expression maps based on the significant clusters. Since our proposed approach of association rule mining of gene functions is, so far, based on determining the same GO terms (gene functions), we can extend the method by using the similarity values of pairs of gene functions in the GO structure. This means that if two functions are very similar to each other or one is a parent of the other, even though they have different GO ID, we can consider the two functions as being the same. So the rules can possibly be merged into more general rules without loosing relevant information. We will try different algorithms of association rule mining and propose the most suitable methods to fit our data. We also plan to add other features besides the gene functions, such as the label of significant cluster or the wavelet features extracted from the gene maps. Most importantly, one can predict gene functions by the association rules we found in the significant clusters. This is due to the fact that the particular patterns of gene expression maps have high probability to have similar gene functions to the detected frequent itemsets.
Acknowledgments
This work was supported in part by the National Science Foundation under grants IIS-0705215, IIS-0237921 and by the National Institutes of Health under grant R01 MH68066-04 funded by NIMH, NINDS and NIA, NINDS grant 1 R01 NS050148, and also by the Intramural Research Program of the National Institutes of Health (NIH), National Library of Medicine (NLM). The funding agencies specifically disclaim responsibility for any analyses, interpretations and conclusions.
References
- 1.Agrawal R, Imielinski T, Swami A. Mining Association Rules Between Sets of Items in Large Databases. Proceedings of the 1993 ACM SIGMOD International Conference on Management of Data; 1993. pp. 207–216. [Google Scholar]
- 2.Andrés R, Maria CJ, Oswaldo T. Mining association rules from biological databases. Journal of the American Society for Information Science and Technology. 2005;56(5):493–504. [Google Scholar]
- 3.Agrawal R, Srikant R. Fast Algorithms for Mining Association Rules; Sep 12–15 1994.Chile: VLDB; [Google Scholar]
- 4.Mannila H, Toivonen H, Inkeri Verkarno A. Efficient algorithms for discovering association rules; AAAI Workshop on Knowledge Discovery in Databases (SIGKDD); Seattle. July 1994. [Google Scholar]
- 5.Hemert JV, Baldock R. Lecture Notes in Bioinformatics. Springer Verlag; 2007. Mining Spatial Gene Expression Data for Association Rules; pp. 66–76. [Google Scholar]
- 6.Dafas A Panagiotis, Garcez D, Artur S. Discovering Meaningful Rules from Gene Expression Data. Current Bioinformatics. 2007;2(3):157–164. [Google Scholar]
- 7.Jiang XR, Le Gruenwald Microarray Gene Expression Data Association Rules Mining Based On JG-Tree, dexa; 14th International Workshop on Database and Expert Systems Applications; 2003.p. 27. [Google Scholar]
- 8.Jiang XR, Le Gruenwald Microarray gene expression data association rules mining based on BSC-tree and FIS-tree. Data & Knowledge Engineering archive, Volume 53, Special issue: Biological data management. 2005:3–29. [Google Scholar]
- 9.Lopez FJ, et al. Fuzzy association rules for biological data analysis: A case study on yeast. BMC Bioinformatics. 2008 doi: 10.1186/1471-2105-9-107. [DOI] [PMC free article] [PubMed] [Google Scholar]
- 10.Delgado M Marin, et al. Fuzzy association rules: General model and applications. IEEE Transactions on Fuzzy Systems. 2003;11(2):214–225. [Google Scholar]
- 11.Pandey G, Atluri G, et al. An association analysis approach to biclustering. Proceedings of the 15th ACM SIGKDD international conference on Knowledge discovery and data mining; 2009. pp. 677–686. [Google Scholar]
- 12.Chin Mark H, et al. A genome-scale map of expression for a mouse brain section obtained using Voxelation. Physiological Genomics. 2007:313–321. doi: 10.1152/physiolgenomics.00287.2006. [DOI] [PMC free article] [PubMed] [Google Scholar]
- 13.Brown PO, Botstein D. Exploring the new world of the genome with DNA microarrays. Nat Genet. 1999:33–37. doi: 10.1038/4462. [DOI] [PubMed] [Google Scholar]
- 14.An L, Xie H, Chin MH, Obradovic Z, Smith DJ, Megalooikonomou V. Analysis of multiplex gene expression maps obtained by voxelation. BMC Bioinformatics 2009. 2009;10(Suppl 4):S10. doi: 10.1186/1471-2105-10-S4-S10. [DOI] [PMC free article] [PubMed] [Google Scholar]
- 15.An L, Xie H, Chin MH, Obradovic Z, Smith DJ, Megalooikonomou V. Analysis of multiplex gene expression maps obtained by voxelation; Proceedings of the IEEE International Conference on Bioinformatics and Biomedicine (BIBM); 2008; [DOI] [PMC free article] [PubMed] [Google Scholar]
- 16.Lin D. An Information-Theoretic Definition of Similarity; Proceedings of the Fifteenth International Conference on Machine Learning; Madison, Wisconsin. 1998.pp. 296–304. [Google Scholar]
- 17.Stanford Genomic Resources. http://genome-www.stanford.edu/