

Abstract
Objective
Deep hypothermia induces ‘burst suppression’ (BS), an electroencephalogram pattern with low-voltage ‘suppressions’ alternating with high-voltage ‘bursts’. Current understanding of BS comes mainly from anesthesia studies, while hypothermia-induced BS has received little study. We set out to investigate the electroencephalogram changes induced by cooling the human brain through increasing depths of BS through isoelectricity.
Methods
We recorded scalp electroencephalograms from eleven patients undergoing deep hypothermia during cardiac surgery with complete circulatory arrest, and analyzed these using methods of spectral analysis.
Results
Within patients, the depth of BS systematically depends on the depth of hypothermia, though responses vary between patients except at temperature extremes. With decreasing temperature, burst lengths increase, and burst amplitudes and lengths decrease, while the spectral content of bursts remains constant.
Conclusions
These findings support an existing theoretical model in which the common mechanism of burst suppression across diverse etiologies is the cyclical diffuse depletion of metabolic resources, and suggest the new hypothesis of local micro-network dropout to explain decreasing burst amplitudes at lower temperatures.
Significance
These results pave the way for accurate noninvasive tracking of brain metabolic state during surgical procedures under deep hypothermia, and suggest new testable predictions about the network mechanisms underlying burst suppression.
Keywords: Burst suppression, electroencephalogram, hypothermia
INTRODUCTION
Burst suppression (BS) is an electroencephalogram (EEG) pattern in which periods of low voltage brain activity (‘suppressions’) alternate quasi-periodically with periods of higher voltage activity (‘bursts’)(Swank and Watson 1949; Niedermeyer et al. 1999). Physiologically, BS occurs under conditions of profoundly decreased brain metabolic activity. Neurologically, BS is associated with profound unresponsiveness and unarousability (coma). BS may arise spontaneously in anoxic brain injury, where it is a predictor of poor neurological prognosis(Koenig et al. 2006; Cloostermans et al. 2012; Rossetti et al. 2012), or can be reversibly induced for medical purposes by administering anesthetic drugs and/or by cooling the brain(Swank and Watson 1949; Marion et al. 1997; Stecker et al. 2001b; Stecker 2007; Brown et al. 2010; Ching et al. 2012). In the later, the depth of burst suppression, as measured by the relative duration of suppression periods, can be systematically modulated by adjusting the dose of anesthetic or depth of hypothermia(Ching et al. 2012).
Cooling the brain to induce a deep level of BS is the primary measure used to protect the brain against hypoxic-ischemic damage during surgical procedures involving complete circulatory arrest. Although the optimal temperature and rates for cooling and rewarming remain subjects of active investigation(Englum et al. 2013), most experts recommend targeting temperatures in the ‘deep hypothermia’ range, defined as 14-20°C(Yan et al. 2013), in combination with administration of anesthetics (e.g. isoflurane) to achieve adequate cerebral protection.(Lima et al. 2011; Weiss et al. 2012; Englum et al. 2013) Cooling the brain to 15°C has been estimated to reduce cerebral metabolic demand to 15% of the awake baseline(Bigelow et al. 1950a, 1950b). However, because the degree of metabolic suppression at any given temperature may vary between patients(Stecker et al. 2001a; Englum et al. 2013; James et al. 2014), continuous EEG monitoring is commonly used to tailor the target temperature for each patient.(Coselli et al. 1988; Bavaria et al. 2001; Lima et al. 2011; Englum et al. 2013) Recent evidence suggests that optimal levels of metabolic suppression may be best achieved by targeting a deep state of BS known as ‘electrocerebral inactivity’ (ECI)(Michenfelder and Milde 1992; Mezrow et al. 1994), conventionally defined as the absence of appreciable electrical activity in the scalp EEG for at least 3 minutes when the voltage scale is set at 2 mV/mm .(James et al. 2014)
Despite its medical importance in neurological prognosis and cerebral protection, the neurophysiological mechanisms underlying burst suppression, and the character of BS induced by hypothermia in particular, have received little systematic investigation. A systematic understanding of temperature-dependent EEG changes during hypothermic burst suppression is important for three reasons. First, by clarifying the neurophysiological effects of competing surgical cooling strategies, it can advance the debate over the optimal surgical cooling procedures(Englum et al. 2013; Tian et al. 2013) Second, it is important for distinguishing ‘normal’ EEG changes during intraoperative neurophysiologic monitoring from those that indicate cerebral ischemia, a potentially devastating surgical complication that is often reversible if promptly recognized. Third, understanding burst suppression can provide fundamental insights into neural circuit mechanisms underlying brain electrical rhythms, and into the common processes underlying the EEG BS pattern induced by other conditions, such as anoxic brain damage or general anesthesia.
Models for the mechanisms of BS are constrained by four key observations. First, in scalp EEG recordings, burst onsets and offsets are typically synchronous across the scalp(Brenner 1985; Young 2000), suggesting a low-dimensional dynamical mechanism at work with the ability to produce rapid diffuse synchronization across cortical networks. Second, BS exhibits a monotonic sensitivity to the level of brain suppression. For example, the burst suppression ratio (BSR) – the fraction within a window of time spent in the suppressed state – systematically increases with increasing levels of general anesthetic, eventually reaching isoelectricity(Vijn and Sneyd 1998). Thus, BS is not monolithic, but varies continuously with some underlying biophysical variable. Third, the time scale of BS is considerably longer than for other neural activity. Specifically, whereas the ‘slow’ (delta-band) oscillations observed in the background EEG during sleep or anesthesia have cycle lengths between 0.5-2 seconds (0.5-2Hz), bursts may last several seconds and suppressions can last 10-20 seconds in light stages of anesthesia and up to several minutes in deeper stages(Vijn and Sneyd 1998; Ching et al. 2012). Fourth, in anesthesia-induced BS, the spectral characteristics of EEG activity within bursts in BS closely resembles the activity at lighter, pre-BS levels of anesthesia, suggesting that the processes responsible for suppressions interrupt what are otherwise the same mechanisms responsible for pre-BS EEG oscillations(Kroeger and Amzica 2007; Ching et al. 2012; Lewis et al. 2013).
Members of our group(Ching et al. 2012) recently proposed a unifying model to explain these observations, in which burst suppression results from the interaction of two cyclical processes: 1) a fast dynamical process responsible for the oscillations happening on the millisecond timescale of EEG background activity, and 2) a slow dynamical process, linked to the global metabolic state of the brain, operating on the seconds-to-minutes timescale, which serves as a gating mechanism for the first process. As a specific candidate for the slow gating process we proposed that decreased rates of ATP production in local cortical networks could gate neuronal potassium channels, leading to suppression of action potentials. An alternative, albeit not necessarily mutually exclusive suggestion from Amzica and colleagues is that fluctuations in extracellular calcium concentration facilitate switching between burst and suppression states(Ferron et al. 2009; Amzica and Kroeger 2011). Other modeling studies have linked the slow process to the availability of neurotransmitter, which may itself be linked to cerebral metabolism (Liley and Walsh 2013)
At the neural-systems level this dual-process (fast plus slow process) dynamical model, based largely on observations derived from general anesthesia-induced BS, makes specific predictions about the character of BS induced by other conditions of reduced cerebral metabolism, including deep hypothermia. Specifically, the model predicts that 1) the power spectrum of bursts will be largely invariant to changes in the depth of burst suppression, and 2) burst durations will decrease exponentially, while suppressions will increase exponentially(Westover et al. 2013).
To explore these predictions and to characterize the effects of temperature on BS, we studied patients undergoing deep hypothermia targeting profound cerebral metabolic suppression as part of routine care during thoracic aortic surgery with complete circulatory arrest (n=11). We systematically investigated how bursts and suppressions change throughout the course of cooling, maintenance of deep hypothermia, and rewarming, and compared differences across patients.
METHODS
Standard Protocol Approvals, Registrations, and Patient Consents
This retrospective study was conducted under a protocol approved by The Massachusetts General Hospital IRB. Informed consent was not required.
Patient Population
Supplementary Table 1 summarizes the patient characteristics and drugs administered during general anesthesia. Induction of anesthesia was with propofol (n=7), etomidate (n=2), and midazolam (n=2). For intubation muscle relaxation was achieved with a non-depolarizing muscle relaxant (atracurium, cisatracurium, succinylcholine, or vecuronium). For intubation muscle relaxation was achieved with a non-depolarizing muscle relaxant (atracurium, cisatracurium, succinylcholine, or vecuronium). General anesthesia outside the period of deep hypothermic circulatory arrest (DHCA) was maintained with either isoflurane (0.5-1.4% measured at end expiration, n=10) and intravenous narcotics (fentanyl, hydromorphone, or morphine), or in a single case with propofol 150mcg/kg/min) and sulfentanil (0.5 mcg/kg/hr). Throughout DHCA when patients were on bypass, the sole anesthetic was either isoflurane, administered continuously directly into the blood at a concentration of 1% (n=10) or propofol (150mcg/kg/hr, n=1).
EEG Recording and Anesthesia
All patients were anesthetized with midazolam, fentanyl, isoflurane, and a non-depolarizing muscle relaxant. Roller pump cardiopulmonary bypass (CPB) was instituted using standard venous cannulation (bicaval or two stage) and arterial cannulation of either the left femoral artery, right axillary artery or aortic arch connected via heparin-coated tubing, membrane oxygenator (Medtronic, Minneapolis MN) and open hard-shell venous reservoir. The left ventricle was usually vented through the right superior pulmonary vein. Heparin was administered to maintain the activated clotting times (ACT) above 450 seconds during CPB. Nasopharyngeal, bladder, pulmonary artery, arterial inflow, and venous outflow temperatures were continuously monitored.
Patients were cooled according to a standardized protocol for a minimum of 30 minutes with a maximum inflow/outflow temperature gradient of 10° C and inflow temperatures were not allowed to fall below 15° C. FiO2 was maintained at 1 (100%) during cooling and warming. Alpha-stat blood gas management was used for temperatures below 28° C with CO2 gas added to ventilation gas (approx. 3-5%) to achieve a pCO2 (at temp) = 40 mmHg and pH-stat was used above that blood temperature. Minimum hematocrits were between 25% and 30% depending on patient factors and surgeon's preferences.
Deep hypothermic circulatory arrest (DHCA) was not initiated until a nasopharyngeal temperature of 18° C was achieved and maintained for 30 minutes and the EEG was isoelectric, as determined by visual analysis. At the time of circulatory arrest the venous line was clamped after an exsanguination of about one liter. Retrograde cerebral perfusion was not generally used. When used, antegrade cerebral perfusion was maintained at 5-15 ml/kg/min. Throughout DHCA, the sole anesthetic administered was isoflurane, which was administered continuously delivered directly into the blood via the bypass circuit at a concentration of 1%.
At the end circulatory arrest patients were reperfused for 5 minutes at 18-20° C before rewarming. For rewarming the inflow/outflow gradient was again maintained at less than 10° C with temperature maximums of >37° C, >36° C and >35° C for blood, nasopharyngeal and bladder respectively.
Segmentation of burst suppression
Segmentation of EEG recordings into burst and suppression periods was performed in a semi-automated manner, using an adaptation of previously described methods(Brandon Westover et al. 2013; Lewis et al. 2013). Analysis focused in each patient on the period of EEG recording starting immediately before induction of deep hypothermia (<34 °C) and ending after return to near normothermia (>34 °C). Analysis was based on a single frontal EEG channel (bipolar derivation, Fp1-F7). For each case we first manually labeled a minimum of 10 minutes of unambiguous suppression periods throughout the EEG recording. We also manually identified and excluded from further analysis all periods contaminated by artifact, most of which could be identified as machine artifact originating from intermittent use of electrically operated surgical instruments. The data was then transformed in three steps: 1) signals were highpass filtered (detrended) by first convolving the signal with a gaussian kernel of width σ =2 seconds then subtracting the resulting lowpass signal from the original signal; 2) the instantaneous signal power was calculated by squaring the detrended signal and smoothing it by convolution with a gaussian kernel of width σ = 0.5 seconds. These transformations yielded a smooth measure approximating the ‘envelope’ or instantaneous high-frequency power of the signal. The value of this envelope during the manually labeled suppressions was used to set a threshold for burst detection (median plus three standard deviations of the envelope value during manually-labeled suppressions). Threshold crossings persisting for longer than 250 ms were labeled as bursts, and burst terminations were recorded when the envelope returned below threshold for 250ms. These cutoffs were determined by manually inspecting each EEG recording to confirm that the results were acceptable. All results were visually confirmed by an experienced clinical electroencephalographer (MBW) in the context of the entire 19-lead EEG with accompanying single lead EKG recording.
Spectral Analysis
We computed spectrograms (time-varying estimates of the EEG power spectrum) using Thomson's multitaper method(Thomson 1982; Bokil et al. 2007), implemented in the Chronux toolbox(Mitra and Bokil, 2007, http://www.chronux.org),(Bokil et al. 2010) (http://chronux.org).23 The spectral analysis parameters were: window length T = 4s with 0.1s overlap, time-bandwidth product TW = 3, number of tapers K = 5, and spectral resolution 2W of 0.75 Hz. Confidence intervals for the estimated power spectra were calculated using the Jackknife method(Tukey 1957; Miller 1968).
Testing for differences between the temperature at onset and offset of burst suppression or of electrocerebral inactivity was performed using paired-sample t-tests, calculated using Matlab statistics toolbox software (Mathworks, Natick, MA).
Comparison of Power Spectra
For significance testing of differences between EEG power spectra at different temperatures we used a z-statistic, the Two Group Test for Spectra (TGTS)(Bokil et al. 2007), as implemented by the Chronux routine, two_group_test_spectrum (http://www.chronux.org), with a cutoff of p < 0.05, calculated by the jackknife method.(Tukey 1957; Miller 1968; Bokil et al. 2007) Spectral differences were considered significant only if they were present for contiguous frequencies over a range greater than the spectral resolution 2W, because spectral estimates within <2W Hz of each other are correlated by virtue of the taper functions. Specifically, for frequencies f > 2W, the null hypothesis was rejected only if the test statistic exceeded the significance threshold over a contiguous frequency range ≥ 2W. (Bokil et al. 2007) For frequencies 0 ≤ f ≤ 2W, to account for the limited spectral resolution at frequencies close to zero, the null hypothesis was rejected only if the test statistic exceeded the significance threshold over a contiguous frequency range from 0 to max(f,W) ≤ 2W. We selected a significance threshold of p<0.05.
To allow comparisons of morphology between groups of spectra with different total power, we divided the power spectrum of each burst by its total power and multiplied by the total power of a reference spectrum, taken to be the median spectrum from the group with highest total power. In this way all spectra entering into the comparison have identical total power, and any remaining differences stemmed only from differences in the spectrum shape. Subsequent statistical comparison of the normalized spectra was carried out using the TGTS.
Burst Suppression Probability
We quantified the depth of burst suppression using the burst suppression probability (BSP), a number between 0 and 1, which describes the instantaneous probability of the EEG being in a state of suppression. A BSP value of 0 corresponds to a continuously active EEG with no suppression, whereas a value of 1 corresponds to a completely isoelectric or suppressed EEG. The BSP was calculated using previously published methods.(Chemali et al. 2011, 2013; Ching et al. 2013)
Of note, some authors avoid the term “burst suppression” when the BSP is <50%. For example, in the current version of the American Clinical Neurophysiological Society's Standardized Critical Care EEG Terminology, recordings are described as “nearly continuous” when BSP < 0.1 (i.e. when periods of suppression/attenuation take up <10% of the EEG recording), “discontinuous” for BSP between 10-49%, and “burst-suppression” when BSP>50%.(Hirsch et al. 2013) Nevertheless, in this paper we use the term “burst-suppression” whenever BSP>0.
Testing for systematic trends in the relationship between temperature and BSP was carried out by first computing a logistic transformation on the BSP time series to obtain x(ti) = log BSP (ti)/(1 − BSP(ti)). In the derivation of the BSP, the burst suppression state variable x(ti) represents the strength of the stimulus that is inciting burst suppression at a specific time ti. Given our hypothesis that burst suppression and thus BSP should increase with decreasing temperature, we modeled the relationship between BSP and temperature. We sampled the suppression state variable traces BSP traces at 3 minute time intervals, ti, plotted these against the corresponding temperature measurements T(ti), and fitted a regression line to the scatter plot of x(ti) vs T(ti). The variability in x(ti) was assessed by analyzing the width of the 95% percentile interval for x(ti) as a function of temperature, quantified using a Gaussian curve fit.
Burst and Suppression Duration vs Temperature
To quantify the systematic variation of burst and suppression durations with temperature, we computed empirical cumulative distribution functions (ECDFs), constructed functions to describe these ECDFs, and estimated their parameters. ECDFs were constructed using previously published methods.(Westover et al. 2013) Briefly, we divided the temperature range 20-35°C into 50 equally spaced bins. For each temperature bin we constructed two lists, containing the durations of bursts and suppressions, pooled across all patients’ EEG records, that occurred at a temperature within 0.5°C of the bin center. These burst-duration and suppression-duration lists are then treated as state “failure” or termination times, and an empirical cumulative distribution function (CDF) is computed from each list, defined as Fe(t|T) =/Ntot, the fraction of suppressions (resp. bursts) that terminate before reaching a duration for a given temperature T. The overall empirical distribution function thus forms a surface with time and temperature on the x and y axes, and the cumulative percentage of failures on the z axis.
We parameterized the empirical CDF surfaces using Weibull functions (CDFs), Fw(t|T) = 1 − exp(t/λ(T))θ, which are widely used in survival analysis and reliability engineering for failure time analysis. Based on the appearance of the empirical CDF surfaces, we chose to model the dependence of the scale parameter λ on temperature as an exponential function, i.e. for suppressions we set the scale parameter to increase exponentially with temperature, λ(T) = A exp(B · (T − 15)/(20)), whereas for bursts we set the scale parameter to decrease exponentially with temperature, λ(T) = A′ exp(B′ · (1 − (T − 15)/20)). Note that in these expressions temperature appears as number of degrees above 15°C, normalized by the temperature range (35C° - 15C°). The parameters θ and B were determined by a nonlinear least squares procedure using the fminsearch function in Matlab (Mathworks, Natick, MA). Goodness of fit for these was assessed by R2 values.
Burst Amplitude Differences vs Temperature
Comparisons of burst amplitudes (difference between maximum and minimum voltages) at different temperatures were carried out by calculating cumulative distribution functions (CDFs) for bursts within two distinct temperature intervals separated by 5°C, namely 15-22°C and 27-34°C.Differences between these CDFs were assessed by the two-sample Kolmogorov-Smirnov test(Kolmogorov 1933), using the kstest2 function in the Matlab statistics toolbox software (Mathworks, Natick, MA).
RESULTS
EEG Changes During Cooling, Deep Hypothermia, and Rewarming
The EEG dynamics during induction, maintenance, and rewarming from deep hypothermia are shown for three representative cases in Figures 1-3. The burst suppression probability (BSP) rises with deepening hypothermia (indicating deeper levels of burst suppression, e.g. increasing average time spent in the suppressed state and briefer suppressions) and then returns toward baseline upon rewarming. The onset and offset of BS in all cases occurred under mildly hypothermic conditions, in conjunction with administration of 1% isoflurane. There was no statistically significant difference of temperatures at onset and offset of BS (mean±std, onset 30.9±5.2 °C vs offset 28.9±3.7 °C, p=0.35). Burst suppression was typically maintained for several hours (2.6±1.0 hours).
Figure 1. Typical Electroencephalogram of Deep Hypothermia, Example 1.


(A) EEG voltage trace (Fp1). (B) Segmentation of the EEG into periods of suppression (white), non-suppression (‘burst’ state’) in black, and periods of artifact (red). (C) Spectrogram of the EEG. (D) Burst suppression probability (BSP), with overbars in red indicating periods of isoelectricity (two or more minutes with EEG voltage continuously less than 2 microvolts). (D) Temperature. (F) Representative examples of burst EEG voltage traces and (G) corresponding burst spectrograms at three different temperatures. (H) All bursts that occurred throughout surgery and had duration 30 seconds or less are shown, with temperature indicated by color. Burst amplitude and duration tend to decrease with temperatures.
Figure 3. Typical Electroencephalogram of Deep Hypothermia, Example 3.


See legend for Figure 1 for explanation of the subpanels
The target level of burst suppression, electrocerebral inactivity (ECI), failed to be achieved in 18% (2/11) cases, and occurred near the temperature nadir of each case. Among cases where ECI was attained, there was no statistically significant difference between the temperature at the first and last appearance of ECI (onset 22.6±2.8 °C vs offset 23.3±3.1 °C, p=0.66). In most cases ECI was not maintained continuously, but rather was interrupted by infrequent bursts. Consequently there tended to be multiple (7.2±5.4) relatively brief (5.8± 2.8 minutes) periods of ECI in succession. The total time that passed between the first and last instance of ECI varied but was typically near one hour (50.7±54.3 minutes), accounting for approximately one third of the average total time spent in burst suppression.
The differences between the pooled onset and offset temperatures for BS and the cooler temperatures at onset and offset of ECI generally differed by approximately 6°C (BS: 29.9±4.5°C vs ECI 23.0±2.9°C, p=3.3×10⁻⁶).
Burst Suppression Probability vs Temperature
We investigated the quantitative relationship between depth of hypothermia and depth of burst suppression by plotting the temperature sampled every three minutes against the corresponding time-varying burst suppression probability (BSP) pooled across patients (Figure 4A). The BSP was strongly inversely correlated with temperature (r= −0.7674 [95% CI: −0.79, −0.74]). The effect of temperature on BSP was least variable between patients around 20°C and 35°C, near the high and low temperatures for each case, at which points patients were either just entering the BS state or were close to or within the state of ECI. The dispersion in BSP values was more than twice as great for intermediate temperatures, most likely reflecting both between- and within-patient variation in responses to hypothermia. The within-patient variation was evident in the differing BSP values at equal temperatures during cooling and rewarming in individual patients (Figure 4B). On first inspection Figure 4A appears to suggest hysteresis; however, the relationship between the depth of BS for any given temperature during cooling vs rewarming varied across patients, with some achieving higher BSP values in the cooling phase, the reverse relationship for others, while for others very similar BSP values were achieved in both phases (data not shown).
Figure 4. Temperature vs Suppression Probability.

(A) The burst suppression probability (BSP) is plotted against the corresponding temperature at 3 minute intervals throughout the case, for the entire study cohort (black asterisks). A strong relationship is evident, with decreased brain temperatures correlating deeper levels of burst suppression, i.e. increased BSP. A regression line (straight red line) is fit to the data to show the overall trend, and a Gaussian curve was fit to the 95% interquantile range as a function of temperature using bins of width 1°C (dashed red lines). (B) A Gaussian curve (red dashed lines) provided a good fit (R2=0.83) through the interquantile difference measurements (black asterisks).
Burst Amplitudes vs Temperature
We next investigated the effect of hypothermia on burst amplitude. Specifically, we examined the cumulative distribution of burst amplitudes (Figure 5) within low (17-22°C) and high (27-32°C) ranges of temperatures. Burst amplitudes showed a marked shift toward lower amplitudes at lower temperatures, with a median burst amplitude for the low temperature range of 12.6 microvolts, vs 76.9 microvolts in the higher temperature range. This observation demonstrates that decreasing cerebral temperatures during burst suppression tends to produce lower amplitude bursts, and that the appearance of small bursts marks the onset of profound cerebral inactivation.
Figure 5. Burst and Suppression Lengths vs Temperature.

Empirical cumulative distribution functions (CDFs) are shown for suppression lengths (A) and burst lengths (B), together with parametric fits (C and D). The fitted models are Weibull cumulative distribution functions with exponentially decreasing (for suppressions) or increasing (for bursts) scale parameters, as described in the Supplementary Table 1. The median suppression and burst lengths derived from the fitted models are shown as superimposed dashed black lines.
Bursts Shorten and Suppressions Lengthen With Decreasing Temperature
In Figure 4 we saw that the overall relationship in the BSP vs temperature data can be captured reasonably well by fitting a straight line. However, in principle BSP changes can result from changes in either burst duration, suppression duration, or both. Visual analysis (e.g. Figures 1-3) suggests that burst durations decrease exponentially while the duration of suppression periods increases exponentially with decreasing temperatures. To quantify this relationship we fit survival curves to measurements of burst and suppression durations for both individual patients and pooled across all patients (Figure 6). The “raw” data shown in the upper panels of Figure 5 show multiple peaks. We considered it likely that these peaks represent variation or “noise” arising from having insufficient data to produce completely smooth CDF estimates. The underlying systematic trend appears to be exponential. Thus, we chose to fit these data with simple parametric survival models, as explained in the Methods section.
Figure 6. Burst Amplitudes vs Temperature.

Empirical cumulative distribution functions (CDFs) are shown for suppression amplitudes in mild hypothermia (27-32°, red curve) and deep hypothermia (17-22°, blue curve). The Kolmogorov-Smirnov (KS) statistic value, D, and associated p-value are also shown.
The median duration of suppressions increased in an approximately exponential fashion with decreasing temperature, while the median burst duration showed an approximately exponential systematic decrease. Median duration for both bursts and suppressions changed by approximately twofold as temperature decreased from 30 to 20°C: suppression nearly doubled by increasing from 6.9 to 13.2 seconds, while burst duration was reduced by nearly 1/2 by decreasing from 9.6 to 5.1 seconds.
Spectral Morphology of Bursts vs Temperature
Visual inspection of bursts within deep hypothermia suggests that as bursts become briefer and lower in amplitude, they also appear to become ‘simpler’, i.e. bursts appear as low-amplitude slow waves with little apparent higher frequency content (Figures 1-3). We considered two possible explanations for the appearance of simple, low-amplitude slow waves at low temperature. First, these waveforms may reflect a genuine reduction in the average spectrum of burst energy at high frequencies. Alternatively, the spectral differences between low-temperature bursts and bursts at warmer temperatures could be merely apparent, an illusion produced by the difference in overall amplitude.
To distinguish between these hypotheses, we compared individual and group average spectrograms for bursts under mild (27-34°C) and deep (15-22°C) hypothermia (Figure 7, left panels). In all individual cases and in the pooled analysis the average total power of burst spectra was higher across all frequencies (0-30Hz) at higher temperatures. After normalization for total power, the average morphology of burst spectra appeared nearly superimposable across all frequencies. Residual statistical differences remained, but were generally small (1-3dB, compared with 10-15dB before normalization), and varied between cases. Overall, these findings suggest that, despite reduced burst duration and overall power, the underlying spectral morphology of bursts is approximately invariant to temperature changes.
Figure 7. Comparison of Power Spectra at Different Temperatures.

Estimated power spectra for 3 cases and for all cases pooled together in deep (15-22°C) and mild (27-34°C) hypothermia are shown before (A) and after (B) normalization. Regions of the power spectra accepted as statistically indistinguishable are indicated by black bars.
Discussion
In this study of EEG patterns in patients with complete circulatory arrest for aortic surgery, we found that deep hypothermia induces a series of systematic changes in the characteristics of burst suppression leading up to complete suppression of the EEG. Average burst durations exponentially shrink, while suppression durations exponentially increase with decreasing temperature, in agreement with theoretical predictions.(Ching et al. 2012) Simultaneously, burst amplitudes systematically decrease with decreasing temperature, while the spectral structure of bursts remain substantially unchanged, also as predicted.(Ching et al. 2012) Finally, burst suppression under deep hypothermia exhibits considerable variability between patients, evident also in the wide variation of burst and suppression lengths at temperatures between those associated with burst suppression onset and ECI, and within patients, evident in the unintended fluctuations in burst suppression depth under surgical-anesthetic conditions intended to maintain ECI during critical portions of surgery. These findings have theoretical implications for our understanding of the mechanisms underlying burst suppression, and practical implications for optimal medical management of burst suppression.
Relationship of burst characteristics to neuronal network dynamics
The physiological mechanisms underlying burst suppression remain an area of active investigation. Several distinct mechanisms have been proposed to play key roles in the induction of BS, including increased cortical inhibition, evidenced by increases in neuronal membrane potassium conductance and hyperpolarization of neuronal membrane potentials(Steriade et al. 1994); decreased inhibition, evidenced by increased neuronal input resistance and extracellular chloride concentration(Ferron et al. 2009); slow oscillations in inhibition related to cyclical ATP depletion and regeneration(Ching et al. 2012); and modulations in excitatory synaptic efficiency due to cyclical depletion and recovery of interstitial calcium concentrations(Kroeger and Amzica 2007). It is also possible that different biophysicial mechanisms underlie the induction of burst suppression under different circumstances.
Nevertheless, the observation that the different physiological factors and etiological causes identified to date all lead the same well defined EEG state of burst suppression suggests a unifying dynamical mechanism(Ching et al. 2012; Liley and Walsh 2013). Accordingly, recent theoretical models have attributed burst suppression to an interaction between processes operating at different time scales, namely a fast process responsible for generating the “resting” EEG activity present before the onset of burst suppression and re-appearing during bursts, and a slow process that modulates the fast process. In this general dynamical model, the duration of bursts is governed by depletion of a substrate of some kind which subsequently recovers during suppression epochs. In what follows, for concreteness we will refer to substrate depletion as a decrease in cerebral metabolism, in keeping with the theoretical model proposed by our group(Ching et al. 2012). Nevertheless the essential points do not depend on the precise identity of the substrate, and can be adapted to any model of the fast-slow type.
A key prediction of the “fast-slow” or “depletion-recovery” model is that the neuronal circuit dynamics that generate activity within bursts are relatively invariant to the level of inactivation, i.e., to the BSP and related metrics such as the BSR(Ching et al. 2012). Our analysis suggests that, while the overall power in bursts decreases substantially as a function of cooling, the spectral morphology is largely unchanged.
To account for the novel observation of burst amplitude reduction with preserved spectral morphology observed under deep hypothermia, the mechanisms of the fast-slow dynamical model for BS can be understood as follows(Ching et al. 2012) (Figure 8): (i) the underlying neuronal circuit mechanisms within each burst do not significantly change after the onset of burst suppression; (ii) however, the progressive decrease in cerebral metabolism means that rate of substrate recovery slows, i.e., suppressions become longer; (iii) in addition, the effective rate of depletion during bursts becomes faster, i.e., bursts become shorter; (iv) and a smaller portion of the underlying circuit is able to manifest activity before depletion causes a subsequent suppression, i.e., the overall power in each burst goes down. Said another way, the progressive reduction in metabolism implies that a smaller number of cells can express the underlying circuit dynamics, for progressively shorter lengths of time. The lack of a qualitative change in spectral morphology further implies that the direct effect of cerebral metabolism on fast neuronal time scales is minimal.
Figure 8. Model explaining how deep hypothermia leads to shorter, weaker bursts.
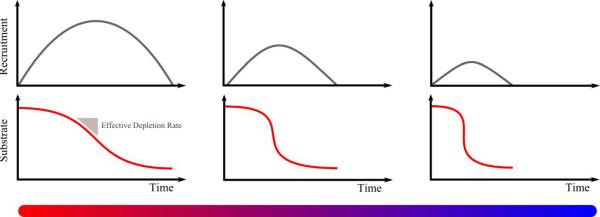
As the rate of substrate recovery decreases (with decreasing metabolic rate), fewer cells are recruited before precipitous depletion leads to suppression. In essence, the equivalent amount of neuronal activity leads to progressively more rapid depletion. Consequently, bursts become shorter and manifest less power. The intrinsic circuit mechanisms within each bursts, however, do not fundamentally change.
The above interpretation may also help to explain previous reports of exceptions to the general rule that BS is a synchronous process when viewed from the perspective of the scalp EEG. Instances of asynchronous burst suppression have been reported in rare cases of cortical deafferentation (Henry and Scoville 1952; Lazar et al. 1999), and these have been hypothesized to reflect large-scale differences in regional blood supply and autoregulation interfering with normal synchronizing mechanisms. More recent intracranial EEG recordings during neurosurgery for epilepsy have demonstrated that localized asynchronous burst suppression occurs in the intact brain.(Lewis et al. 2013) These observations are again consistent with the notion of differences in metabolic state and energetic demand in local circuits, supporting the expanded mechanism described above, in which networks can be differentially recruited into bursts. Thus, the existence of spatially sparse, transiently asynchronous bursts in intracranial EEG28 would suggest that those particular circuits have a lower metabolic threshold for activation than surrounding regions, whose more global activation gives rise to the classical synchronous BS that appears in scalp EEG. As temperature decreases, the model predicts that the intracranial EEG would be characterized by approximately synchronous but increasingly sparse activation of cortical subnetworks, giving rise to the synchronous but progressively lower-amplitude bursts in the scalp EEG.
Limitations
Our results are subject to several important limitations. First, the foregoing mechanistic considerations should be regarded as tentative. Although we have argued that qualitative differences between burst spectra at different temperatures appear small and after normalizing for total power, statistical differences between spectra were nevertheless present. It is possible that these differences relate to as yet unknown temperature-sensitive alterations in the underlying process responsible for generating bursts. In addition, scalp EEG recordings provide a fundamentally limited view of the spectral content of brain activity at higher frequencies. Consequently, our results cannot exclude the possibility of low-amplitude changes in the beta and gamma frequency bands with deepening hypothermia. For these reasons, definitive investigations of the detailed spectral structure and mechanisms of burst suppression under deep hypothermia will likely require intracranial EEG recordings and carefully controlled laboratory experiments.
A second limitation is that, unavoidably, the patients in our study all received anesthesia during hypothermia (see Supplementary Table 1). Undoubtedly, the temperature thresholds at which the onset of burst suppression occurs, the quantitative relationship between temperature and BSP, and the temperature thresholds at which we observed the onset of ECI, are all influenced by the presence of anesthetics. Isoflurane levels were measured and kept constant before and after bypass, but technically could not be measured during bypass; while propofol serum levels were not measured (n=1). Nevertheless, anesthetics were administered at constant rates during bypass (isoflurane at a concentration of 1% (n=10) or propofol at 150mcg/kg/hr, n=1). Thus, the observed overall shape of the BSP vs temperature plots and the strong dependence of burst and suppression characteristics on temperature (Figures 4-7) likely do in fact reflect primarily the dependence of burst suppression on depth of hypothermia rather than random drifting of anesthetic levels.
Clinical implications of burst suppression variability in deep hypothermia
Our analysis of 11 routine clinical cases demonstrates significant variability in the depth of burst suppression between and within patients in all but the warmest and coldest phases of surgery. Most importantly, under the same dose of isoflurane, ECI is attained at different temperatures in different patients, and fluctuations into and out of ECI once despite maintenance of relatively constant temperature and anesthetic conditions are relatively common. Consequently, it is not possible to reliably predict an individual patient's level of burst suppression or to ensure maintenance of ECI by simply targeting a predetermined temperature plus anesthetic combination. In turn, continuous EEG monitoring to allow continual fine-tuning of brain temperature and anesthetic levels is essential in cases for which maintaining a specific target level of BS or ECI are necessary to provide cerebral metabolic protection.
Clinical implications of retained burst morphology under deep hypothermia
Given that deep hypothermia is protective against anoxic brain injury, as evident from cases of neurological recovery of drowning victims after prolonged immersion(Conn 1979; Orlowski 1987) and from the large body of surgical and anesthesia experience with using deep hypothermia to bring the majority of patients safely through aortic arch surgery with complete circulatory arrest without significant neurological morbidity, these findings could have significant impact on clinical practice. Specifically, our findings suggest that the normal pattern of burst suppression throughout the descent toward ECI is for bursts to maintain relatively constant spectral morphology despite becoming briefer and lower in amplitude. Coupled with the mechanistic considerations above, this observation suggests that tracking the spectral morphology of bursts during deep hypothermia can be used to monitor whether the underlying neural circuit dynamics remain intact.
In turn, we hypothesize that the loss or alterations of normal spectral content within bursts may serve as a sensitive indicator of cerebral ischemic-anoxic injury. This hypothesis is supported by frequent appearance of pathological burst suppression patterns in patients with anoxic-ischemic brain injuries, which may be abnormally stereotyped from burst-to-burst(Hofmeijer et al. 2014) and in which normal EEG activity is frequently replaced by pathological patterns such as generalized periodic epileptiform discharges or other epileptiform activity. Finally, our results suggest an important potential application for tracking the spectral content of bursts in conditions other than hypothermia, in which the starting point is pathological rather than ‘normal’ burst suppression: In conditions such as pharmacologically-induced burst suppression to treat refractory status epilepticus, or in burst suppression as a manifestation of anoxic brain injury, continuous EEG monitoring to detect the evolution over time of burst morphology toward a normal pattern could be useful as a sensitive means of detecting recovery from injury, or the resolution of pathology. Such information may be invaluable for guiding medical treatment decisions and rendering more accurate neurological prognoses. Future studies will focus on developing a detailed understanding of the relationship of the spectral content of the EEG during burst suppression and other features of burst suppression to underlying cerebral pathology, and on the optimal use of this information to guide medical therapy and prediction of neurological outcome.
Supplementary Material
HIGHLIGHTS.
We investigated the effects of deep hypothermia on the human electroencephalogram.
Hypothermia induces a burst-suppression with bursts that are progressively longer and lower in amplitude, while the spectral content of bursts remains largely constant.
These findings support a model in which burst suppression across diverse etiologies arises from widespread cyclical depletion of cerebral metabolic resources.
Figure 2. Typical Electroencephalogram of Deep Hypothermia, Example 2.


See legend for Figure 1 for explanation of the subpanels.
Acknowledgements
American Brain Foundation (MBW); DP2-OD006454 (to PLP), DP1-OD003646 and TR01-GM104948 (to ENB), and T32GM007592 (to OA) from the National Institutes of Health, Bethesda, Maryland; FAER and MGH MAO/ECOR Faculty Development award to (OA); Funds from the Department of Anesthesia, Critical Care and Pain Medicine, Massachusetts General Hospital, Boston, Massachusetts. SC Holds a Career Award at the Scientific Interface from the Burroughs-Wellcome Fund.
Footnotes
Publisher's Disclaimer: This is a PDF file of an unedited manuscript that has been accepted for publication. As a service to our customers we are providing this early version of the manuscript. The manuscript will undergo copyediting, typesetting, and review of the resulting proof before it is published in its final citable form. Please note that during the production process errors may be discovered which could affect the content, and all legal disclaimers that apply to the journal pertain.
Conflicts of Interest: None of the authors have potential conflicts of interest to be disclosed.
REFERENCES
- Amzica F, Kroeger D. Cellular mechanisms underlying EEG waveforms during coma. Epilepsia. 2011;52(Suppl 8):25–7. doi: 10.1111/j.1528-1167.2011.03229.x. [DOI] [PubMed] [Google Scholar]
- Bavaria JE, Pochettino A, Brinster DR, Gorman RC, McGarvey ML, Gorman JH, et al. New paradigms and improved results for the surgical treatment of acute type A dissection. Ann Surg. 2001;234:336–42. doi: 10.1097/00000658-200109000-00007. discussion 342–3. [DOI] [PMC free article] [PubMed] [Google Scholar]
- Bigelow WG, Callaghan JC, HOPPS JA. General hypothermia for experimental intracardiac surgery; the use of electrophrenic respirations, an artificial pacemaker for cardiac standstill and radio-frequency rewarming in general hypothermia. Ann Surg. 1950;132:531–9. doi: 10.1097/00000658-195009000-00018. [DOI] [PMC free article] [PubMed] [Google Scholar]
- Bigelow WG, Lindsay WK, Greenwood WF. Hypothermia; its possible role in cardiac surgery: an investigation of factors governing survival in dogs at low body temperatures. Ann Surg. 1950;132:849–66. doi: 10.1097/00000658-195011000-00001. [DOI] [PMC free article] [PubMed] [Google Scholar]
- Bokil H, Andrews P, Kulkarni JE, Mehta S, Mitra P. Chronux: A Platform for Analyzing Neural Signals. J Neurosci Methods. 2010;192:146–51. doi: 10.1016/j.jneumeth.2010.06.020. [DOI] [PMC free article] [PubMed] [Google Scholar]
- Bokil H, Purpura K, Schoffelen J-M, Thomson D, Mitra P. Comparing spectra and coherences for groups of unequal size. J Neurosci Methods. 2007;159:337–45. doi: 10.1016/j.jneumeth.2006.07.011. [DOI] [PubMed] [Google Scholar]
- Brandon Westover M, Shafi MM, Ching S, Chemali JJ, Purdon PL, Cash SS, et al. Real-time segmentation of burst suppression patterns in critical care EEG monitoring. J Neurosci Methods. 2013;219:131–41. doi: 10.1016/j.jneumeth.2013.07.003. [DOI] [PMC free article] [PubMed] [Google Scholar]
- Brenner RP. The electroencephalogram in altered states of consciousness. Neurol Clin. 1985:615–31. [PubMed] [Google Scholar]
- Brown EN, Lydic R, Schiff ND. General anesthesia, sleep, and coma. N Engl J Med. 2010;363:2638–50. doi: 10.1056/NEJMra0808281. [DOI] [PMC free article] [PubMed] [Google Scholar]
- Chemali J, Ching S, Purdon PL, Solt K, Brown EN. Burst suppression probability algorithms: state-space methods for tracking EEG burst suppression. J Neural Eng. 2013;10:056017. doi: 10.1088/1741-2560/10/5/056017. [DOI] [PMC free article] [PubMed] [Google Scholar]
- Chemali JJ, Wong KFK, Solt K, Brown EN. A state-space model of the burst suppression ratio. Conf Proc IEEE Eng Med Biol Soc. 2011:1431–4. doi: 10.1109/IEMBS.2011.6090354. [DOI] [PMC free article] [PubMed] [Google Scholar]
- Ching S, Liberman MY, Chemali JJ, Westover MB, Kenny JD, Solt K, et al. Real-time closed-loop control in a rodent model of medically induced coma using burst suppression. Anesthesiology. 2013;119:848–60. doi: 10.1097/ALN.0b013e31829d4ab4. [DOI] [PMC free article] [PubMed] [Google Scholar]
- Ching S, Purdon PL, Vijayan S, Kopell NJ, Brown EN. A neurophysiological-metabolic model for burst suppression. Proc Natl Acad Sci U S A. 2012;109:3095–100. doi: 10.1073/pnas.1121461109. [DOI] [PMC free article] [PubMed] [Google Scholar]
- Cloostermans MC, van Meulen FB, Eertman CJ, Hom HW, van Putten MJAM. Continuous electroencephalography monitoring for early prediction of neurological outcome in postanoxic patients after cardiac arrest: A prospective cohort study. Crit Care Med. 2012;40:2867–75. doi: 10.1097/CCM.0b013e31825b94f0. [DOI] [PubMed] [Google Scholar]
- Conn AW. Near-drowning and hypothermia. Can Med Assoc J. 1979;120:397–400. [PMC free article] [PubMed] [Google Scholar]
- Coselli JS, Crawford ES, Beall AC, Jr, Mizrahi EM, Hess KR, Patel VM. Determination of brain temperatures for safe circulatory arrest during cardiovascular operation. Ann Thorac Surg. 1988;45:638–42. doi: 10.1016/s0003-4975(10)64766-2. [DOI] [PubMed] [Google Scholar]
- Englum BR, Andersen ND, Husain AM, Mathew JP, Hughes GC. Degree of hypothermia in aortic arch surgery - optimal temperature for cerebral and spinal protection: deep hypothermia remains the gold standard in the absence of randomized data. Ann Cardiothorac Surg. 2013;2:184–93. doi: 10.3978/j.issn.2225-319X.2013.03.01. [DOI] [PMC free article] [PubMed] [Google Scholar]
- Ferron J-F, Kroeger D, Chever O, Amzica F. Cortical inhibition during burst suppression induced with isoflurane anesthesia. J Neurosci. 2009;29:9850–60. doi: 10.1523/JNEUROSCI.5176-08.2009. [DOI] [PMC free article] [PubMed] [Google Scholar]
- Henry CE, Scoville WB. Suppression-burst activity from isolated cerebral cortex in man. Electroencephalogr Clin Neurophysiol. 1952;4:1–22. doi: 10.1016/0013-4694(52)90027-8. [DOI] [PubMed] [Google Scholar]
- Hirsch LJ, LaRoche SM, Gaspard N, Gerard E, Svoronos A, Herman ST, et al. American Clinical Neurophysiology Society's Standardized Critical Care EEG Terminology: 2012 version. J Clin Neurophysiol. 2013;30:1–27. doi: 10.1097/WNP.0b013e3182784729. [DOI] [PubMed] [Google Scholar]
- Hofmeijer J, Tjepkema-Cloostermans MC, van Putten MJAM. Burst-suppression with identical bursts: a distinct EEG pattern with poor outcome in postanoxic coma. Clin Neurophysiol. 2014;125:947–54. doi: 10.1016/j.clinph.2013.10.017. [DOI] [PubMed] [Google Scholar]
- James ML, Andersen ND, Swaminathan M, Phillips-Bute B, Hanna JM, Smigla GR, et al. Predictors of electrocerebral inactivity with deep hypothermia. J Thorac Cardiovasc Surg. 2014;147:1002–7. doi: 10.1016/j.jtcvs.2013.03.022. [DOI] [PMC free article] [PubMed] [Google Scholar]
- Koenig MA, Kaplan PW, Thakor NV. Clinical neurophysiologic monitoring and brain injury from cardiac arrest. Neurol Clin. 2006;24:89–106. doi: 10.1016/j.ncl.2005.11.003. [DOI] [PubMed] [Google Scholar]
- Kolmogorov A. Sulla Determinazione Empirica di una Legge di Distribuzione. G DellIstituto Ital Degli Attuari. 1933;4:83–91. [Google Scholar]
- Kroeger D, Amzica F. Hypersensitivity of the anesthesia-induced comatose brain. J Neurosci. 2007;27:10597–607. doi: 10.1523/JNEUROSCI.3440-07.2007. [DOI] [PMC free article] [PubMed] [Google Scholar]
- Lazar LM, Milrod LM, Solomon GE, Labar DR. Asynchronous pentobarbital-induced burst suppression with corpus callosum hemorrhage. Clin Neurophysiol. 1999;110:1036–40. doi: 10.1016/s1388-2457(99)00046-2. [DOI] [PubMed] [Google Scholar]
- Lewis LD, Ching S, Weiner VS, Peterfreund RA, Eskandar EN, Cash SS, et al. Local cortical dynamics of burst suppression in the anaesthetized brain. Brain J Neurol. 2013;136:2727–37. doi: 10.1093/brain/awt174. [DOI] [PMC free article] [PubMed] [Google Scholar]
- Liley DTJ, Walsh M. The Mesoscopic Modeling of Burst Suppression during Anesthesia. Front Comput Neurosci. 2013;7:46. doi: 10.3389/fncom.2013.00046. [DOI] [PMC free article] [PubMed] [Google Scholar]
- Lima B, Williams JB, Bhattacharya SD, Shah AA, Andersen N, Gaca JG, et al. Results of proximal arch replacement using deep hypothermia for circulatory arrest: is moderate hypothermia really justifiable? Am Surg. 2011;77:1438–44. [PMC free article] [PubMed] [Google Scholar]
- Marion DW, Penrod LE, Kelsey SF, Obrist WD, Kochanek PM, Palmer AM, et al. Treatment of traumatic brain injury with moderate hypothermia. N Engl J Med. 1997;336:540–6. doi: 10.1056/NEJM199702203360803. [DOI] [PubMed] [Google Scholar]
- Mezrow CK, Midulla PS, Sadeghi AM, Gandsas A, Wang W, Dapunt OE, et al. Evaluation of cerebral metabolism and quantitative electroencephalography after hypothermic circulatory arrest and low-flow cardiopulmonary bypass at different temperatures. J Thorac Cardiovasc Surg. 1994;107:1006–19. [PubMed] [Google Scholar]
- Michenfelder JD, Milde JH. The effect of profound levels of hypothermia (below 14 degrees C) on canine cerebral metabolism. J Cereb Blood Flow Metab. 1992;12:877–80. doi: 10.1038/jcbfm.1992.120. [DOI] [PubMed] [Google Scholar]
- Miller RG. Jackknifing variances. Ann Math Stat. 1968;39:567–82. [Google Scholar]
- Niedermeyer E, Sherman DL, Geocadin RJ, Hansen HC, Hanley DF. The burst-suppression electroencephalogram. Clin EEG Electroencephalogr. 1999;30:99–105. doi: 10.1177/155005949903000305. [DOI] [PubMed] [Google Scholar]
- Orlowski JP. Drowning, near-drowning, and ice-water submersions. Pediatr Clin North Am. 1987;34:75–92. doi: 10.1016/s0031-3955(16)36182-x. [DOI] [PubMed] [Google Scholar]
- Rossetti AO, Carrera E, Oddo M. Early EEG correlates of neuronal injury after brain anoxia. Neurology. 2012;78:796–802. doi: 10.1212/WNL.0b013e318249f6bb. [DOI] [PubMed] [Google Scholar]
- Stecker MM. Neurophysiology of surgical procedures for repair of the aortic arch. J Clin Neurophysiol. 2007;24:310–5. doi: 10.1097/WNP.0b013e31811ea855. [DOI] [PubMed] [Google Scholar]
- Stecker MM, Cheung AT, Pochettino A, Kent GP, Patterson T, Weiss SJ, et al. Deep hypothermic circulatory arrest: I. Effects of cooling on electroencephalogram and evoked potentials. Ann Thorac Surg. 2001;71:14–21. doi: 10.1016/s0003-4975(00)01592-7. [DOI] [PubMed] [Google Scholar]
- Stecker MM, Cheung AT, Pochettino A, Kent GP, Patterson T, Weiss SJ, et al. Deep hypothermic circulatory arrest: II. Changes in electroencephalogram and evoked potentials during rewarming. Ann Thorac Surg. 2001;71:22–8. doi: 10.1016/s0003-4975(00)02021-x. [DOI] [PubMed] [Google Scholar]
- Steriade M, Amzica F, Contreras D. Cortical and thalamic cellular correlates of electroencephalographic burst-suppression. Electroencephalogr Clin Neurophysiol. 1994;90:1–16. doi: 10.1016/0013-4694(94)90108-2. [DOI] [PubMed] [Google Scholar]
- Swank RL, Watson CW. Effects of barbiturates and ether on spontaneous electrical activity of dog brain. J Neurophysiol. 1949;12:137–60. doi: 10.1152/jn.1949.12.2.137. [DOI] [PubMed] [Google Scholar]
- Thomson DJ. Spectrum estimation and harmonic analysis. Proc IEEE. 1982;70:1055–96. [Google Scholar]
- Tian DH, Wan B, Bannon PG, Misfeld M, Lemaire SA, Kazui T, et al. A meta-analysis of deep hypothermic circulatory arrest versus moderate hypothermic circulatory arrest with selective antegrade cerebral perfusion. Ann Cardiothorac Surg. 2013;2:148–58. doi: 10.3978/j.issn.2225-319X.2013.03.13. [DOI] [PMC free article] [PubMed] [Google Scholar]
- Tukey JW. Variances of Variance Components: II. The Unbalanced Single Classification. Ann Math Stat. 1957;28:43–56. [Google Scholar]
- Vijn PC, Sneyd JR. I.v. anaesthesia and EEG burst suppression in rats: bolus injections and closed-loop infusions. Br J Anaesth. 1998;81:415–21. doi: 10.1093/bja/81.3.415. [DOI] [PubMed] [Google Scholar]
- Weiss AJ, Lin H-M, Bischoff MS, Scheumann J, Lazala R, Griepp RB, et al. A propensity score-matched comparison of deep versus mild hypothermia during thoracoabdominal aortic surgery. J Thorac Cardiovasc Surg. 2012;143:186–93. doi: 10.1016/j.jtcvs.2011.07.020. [DOI] [PubMed] [Google Scholar]
- Westover MB, Ching S, Shafi MM, Cash SS, Brown EN. Real-time segmentation and tracking of brain metabolic state in ICU EEG recordings of burst suppression. Conf Proc IEEE Eng Med Biol Soc. 2013:7108–11. doi: 10.1109/EMBC.2013.6611196. [DOI] [PMC free article] [PubMed] [Google Scholar]
- Yan TD, Bannon PG, Bavaria J, Coselli JS, Elefteriades JA, Griepp RB, et al. Consensus on hypothermia in aortic arch surgery. Ann Cardiothorac Surg. 2013;2:163–8. doi: 10.3978/j.issn.2225-319X.2013.03.03. [DOI] [PMC free article] [PubMed] [Google Scholar]
- Young GB. The EEG in coma. J Clin Neurophysiol. 2000;17:473–85. doi: 10.1097/00004691-200009000-00006. [DOI] [PubMed] [Google Scholar]
Associated Data
This section collects any data citations, data availability statements, or supplementary materials included in this article.