

Abstract
Background:
Coronal diffusion-weighted magnetic resonance imaging (DW-MRI) and apparent diffusion coefficient (ADC) values have gradually become applied (following conventional axial DW-MRI) in the renal analysis. To explore whether data obtained using coronal DW-MRI are comparable with those derived using axial DW-MRI, this preliminary study sought to assess the agreement in renal ADC values between coronal DW-MRI and axial DW-MRI.
Methods:
Thirty-four healthy volunteers were enrolled in the study; written consents were obtained. All subjects underwent respiratory-triggered axial and coronal DW-MRI using a 1.5-MR system with b values of 0 and 800 s/mm2. The signal-to-noise ratios (SNRs) of the two DW-MRI sequences were measured and statistically compared using the paired t-test. The extent of agreement of ADC values of the upper pole, mid-pole, and lower pole of the kidney; the mean ADC values of the left kidney and right kidney; and the mean ADC values of the bilateral kidneys were evaluated via calculation of intraclass correlation coefficients (ICCs) or Bland–Altman method between the two DW-MRI sequences.
Results:
The SNR of coronal DW-MR images was statistically inferior to that of axial DW-MR images (P < 0.001). The ICCs of the ADC values of each region of interest, and the mean ADC values of bilateral kidneys, between the two sequences, were greater than 0.5, and the mean ADCs of the bilateral kidneys demonstrated the highest ICC (0.869; 95% confidence interval: 0.739–0.935). In addition, 94.1% (32/34), 94.1% (32/34), and 97.1% (31/34) of the ADC bias was inside the limits of agreement in terms of the mean ADC values of the left kidneys, right kidneys, and bilateral kidneys when coronal and axial DWI-MRI were compared.
Conclusions:
ADC values derived using coronal DW-MRI exhibited moderate-to-good agreement to those of axial DW-MRI, rendering the former an additional useful DW-MRI method, and causing the ADC values derived using the two types of DW-MRI to be comparable.
Keywords: Apparent Diffusion Coefficient, Diffusion-weighted Magnetic Resonance Imaging, Humans, Kidney, Magnetic Resonance Imaging
INTRODUCTION
Diffusion-weighted magnetic resonance imaging (DW-MRI), an imaging method exploiting in vivo Brownian motion of water molecules, has been increasingly performed on the abdomen, particularly in liver and kidney, over the past decade,[1,2] The apparent diffusion coefficient (ADC) is a quantitative parameter calculated from DW-MR images and is of potential clinical utility across a range of applications. Additional utilities of DW-MRI, such as lesion detection and characterization upon abdominal MRI, have been confirmed in numerous publications.[3,4,5] In addition, ADC values have been confirmed to facilitate the preoperative diagnosis of renal lesions[6,7,8] and reflect renal function.[9,10,11] Conventional renal DW-MRI is performed in the axial plane. However, if lesions are located in the upper or lower pole of the kidney, the precise anatomical relationship between the lesion and the kidney cannot be demonstrated on such a plane. Renal coronal MRI enables more direct visualization of such types of renal lesions, and physicians in clinical practice tend to prefer coronal plane MRI. To date, coronal DW-MRI of the kidney has been but occasionally performed and reported.[11,12] However, whether ADC values derived from coronal DW-MRI are consistent with those from axial DW-MRI remains unclear. Therefore, in this study, we explored the extent of agreement in ADC values derived using both types of DW-MRI.
METHODS
Study population
All procedures were in accordance with the ethical standards of the World Medical Association (Declaration of Helsinki). Our institutional review board also approved this study. The inclusion criteria were as follows: (a) Age ≥ 18 years; (b) glomerular filtration rate (GFR) ≥90 ml·min−1 ·1.73 m−2; (c) agreement to participate in the study. The exclusion criteria were as follows: (a) age < 18 years; (b) GFR <90 ml·min−1 ·1.73 m−2; (c) a definite renal disease such as a renal tumor; (d) hypertension, diabetes mellitus, or other systematic disease; (e) a history of abdominal surgery; (f) pregnancy; (g) claustrophobia or intolerance of MRI scanning; and h. metal implants. Finally, 34 healthy volunteers (12 men and 22 women; age range, 25–60 years; mean age, 38.2 years) were enrolled in this study from August to November 2010 and written consent was obtained from all subjects.
Magnetic resonance imaging protocol
Magnetic resonance imaging examinations were performed using a 1.5-T MR imaging system (TwinSpeed Signa EXCITE HD; GE Healthcare, Milwaukee, WI, USA). The gradient strength of the magnet was 23 mT/m. Patients were imaged in the supine position using a surface phased-array coil. All subjects underwent respiratory axial DW-MRI with b values of 0 and 800 s/mm2, based on our previous study.[13] The parameters were as follows: Repetition time/time to echo, 5400/50–60 ms; flip angle, 90°; field of view (FOV), 36–40 cm; matrix, 128 × 128; section thickness, 5 mm; intersection gap, 1 mm; DW gradient, all directions; NE × 4. Next, the scanning direction was adjusted to the coronal plane, and the kidneys were placed centrally in the FOV. Coronal DW-MRI was also performed with b values of 0 and 800 s/mm2, an FOV of 48 × 48 cm and the same remaining parameters.
Imaging analysis
The signal-to-noise ratios (SNRs) of the two DW imaging sequences were measured on a GE Workstation (Version Advantage 4.3), and were calculated according to the equation: SNR = SIkidney/noise, where SI is signal intensity. To measure ADC values, one radiologist who had performed abdominal MRI for 5 years placed three regions of interest (ROI) in the upper, middle, and lower poles of the kidney, on both axial [Figure 1a–e] and coronal DW-MR images [Figure 2a], and the ROIs were automatically copied onto ADC maps [Figures 1b, d, f and 2b]. The ROIs were approximately 100 mm2 in area. The ADC value of each ROI, the mean ADC values of each kidney, and the mean ADC values of the bilateral kidneys were calculated. The ADC value of each ROI was calculated using the following equation: ADC mm2/s = ln[SI (b0)/SI (b1)]/(b1 − b0), where SI (b0) and SI (b1) are the signal intensities in the ROI obtained using two different gradient factors (b0 and b1).
Figure 1.
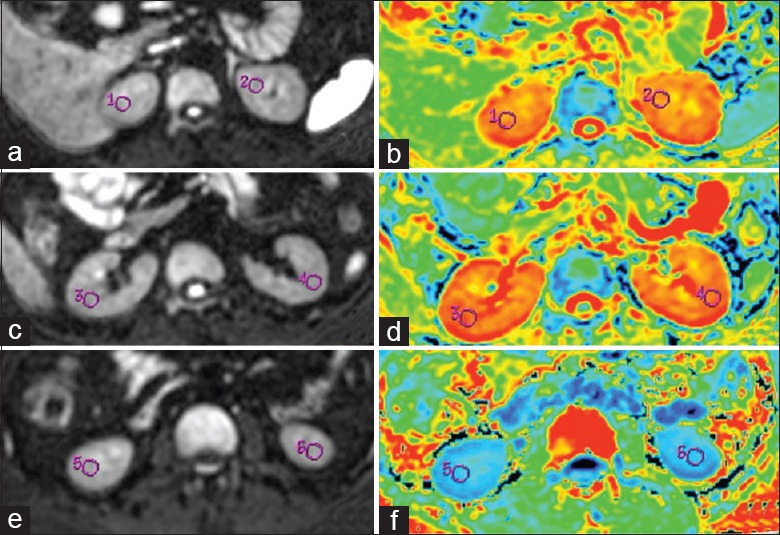
Axial Diffusion-weighted magnetic resonance images and apparent diffusion coefficient (ADC) maps of a healthy female volunteer. Three region of interests were placed in the upper pole (a, b), middle portion (c, d), and lower pole (e, f) of the bilateral kidneys, respectively. The mean ADC values of the left and right kidneys were 2.140 × 10⁻³ mm2/s and 2.170 × 10⁻³ mm2/s, respectively.
Figure 2.
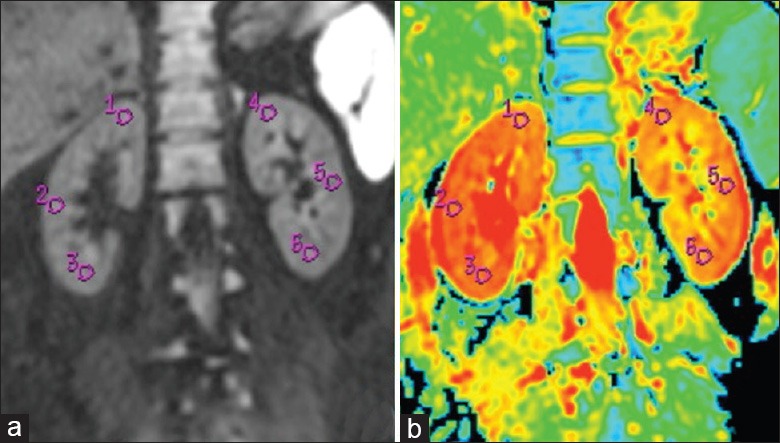
Coronal diffusion-weighted magnetic resonance image and apparent diffusion coefficient (ADC) map of the same volunteer in Figure 1. Three region of interests were placed in the upper pole, middle portion, and lower pole of the bilateral kidneys (a); respectively, and the mean ADC values of the left and right kidney were 2.167 × 10⁻³ mm2/s and 2.180 × 10⁻³ mm2/s, respectively (b).
Statistical analysis
All of the statistical analyses were performed using the commercially available software SPSS (Version 20.0; SPSS, Chicago, IL, USA) and MedCalc (Version 13.1, Mariakerke, Belgium). An error probability of P < 0.05 was considered to indicate a statistically significant difference.
The significance of SNR differences between axial and coronal DW-MRI were evaluated using the paired t-test, as were the ADC values of each ROI. Agreement between the ADC values of the upper pole, mid-pole, and lower pole of the kidney; the mean ADC values of each kidney; and the mean ADC values of bilateral kidneys were evaluated by calculation of ICCs between the two DW-MRI sequences. The agreement was defined as good (ICC > 0.75), moderate (ICC = 0.5–0.75), or poor (ICC < 0.5).
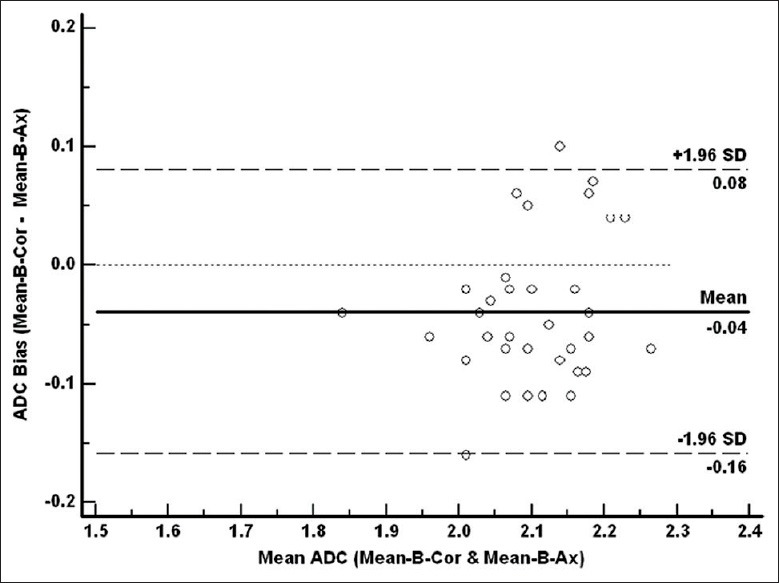
Bland–Altman analysis[14] was conducted, and the 95% limits of agreement for each pairwise ADC comparison (the mean ADC values of each kidney and bilateral kidneys) between the coronal and axial DW-MRI were plotted graphically.
RESULTS
The SNR of coronal DW-MRI (41.11 ± 7.66) was statistically inferior to that of axial DW-MRI (51.2 ± 8.60) (P < 0.001).
The ADC values of each ROI, the mean ADC values of each kidney, and the mean ADC values of the bilateral kidneys, upon coronal and axial DW-MRI, are listed in Table 1. When coronal and axial DW-MRI were compared, the intraclass correlation coefficients (ICCs) of the ADC values of each ROI ranged from 0.547 to approximately 0.808; the ICCs of the mean ADC values of the left and right kidneys were 0.786 and 0.836, respectively; and the mean ADC values of the bilateral kidneys showed the highest ICC (0.869, 95% confidence interval: 0.739–0.935) [Table 1].
Table 1.
ADC values of the kidney and ICCs of the ADC values between coronal and axial DWI
| Location | Mean ADC values (mean ± SD) (×10−3 mm2/s) | ICC | 95% CI | P | ||
|---|---|---|---|---|---|---|
| Coronal | Axial | Lower limit | Upper limit | |||
| Up-L | 2.093 ± 0.107 | 2.080 ± 0.108 | 0.572 | 0.144 | 0.786 | 0.009 |
| M-L | 2.100 ± 0.145 | 2.157 ± 0.097 | 0.572 | 0.142 | 0.786 | 0.009 |
| L-L | 2.052 ± 0.137 | 2.145 ± 0.119 | 0.692 | 0.382 | 0.846 | 0.001 |
| Mean-L | 2.082 ± 0.114 | 2.127 ± 0.087 | 0.786 | 0.572 | 0.893 | <0.001 |
| Up-R | 1.983 ± 0.136 | 2.089 ± 0.108 | 0.547 | 0.092 | 0.774 | 0.013 |
| M-R | 2.165 ± 0.110 | 2.155 ± 0.113 | 0.655 | 0.308 | 0.827 | 0.002 |
| L-R | 2.099 ± 0.162 | 2.102 ± 0.127 | 0.808 | 0.616 | 0.904 | <0.001 |
| Mean-R | 2.083 ± 0.114 | 2.114 ± 0.094 | 0.836 | 0.673 | 0.918 | <0.001 |
| Mean-B | 2.084 ± 0.096 | 2.122 ± 0.083 | 0.869 | 0.739 | 0.935 | <0.001 |
ICC: Intraclass correlation coefficient; 95% CI: 95% confidence level; Up-L: Upper pole of the left kidney; M-L: Mid-pole of the left kidney; L-L: Lower pole of the left kidney; Mean-L: Mean ADC value of the left kidney; Up-R: Upper pole of the right kidney; M-R: Mid-pole of the right kidney; L-R: Lower pole of the right kidney; Mean-R: Mean ADC value of the right kidney; Mean-B: Mean ADC value of the bilateral kidneys; ADC: Apparent diffusion coefficient; DWI: Diffusion-weighted imaging; SD: Standard deviation.
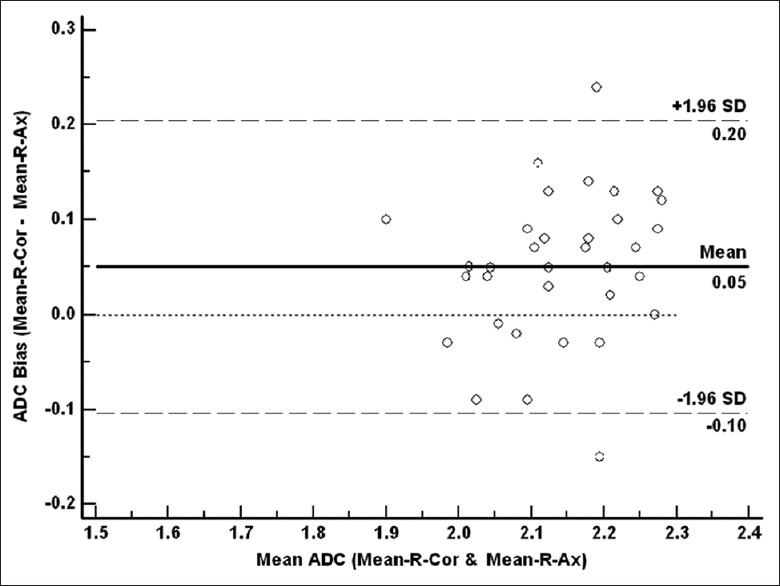
Graphical representation of Bland–Altman mean differences and the limits of agreement are shown in Figures 3–5, which reveal agreement among the ADC values of each kidney, and the bilateral kidneys, when either DW-MRI sequence was run. In addition, 94.1% (32/34), 94.1% (32/34), and 97.1% (31/34) of the ADC biases were inside the limits of agreement when the mean ADC values of the left kidney, right kidney, and bilateral kidneys, between coronal and axial DWI-MRI, respectively, were compared.
Figure 3.
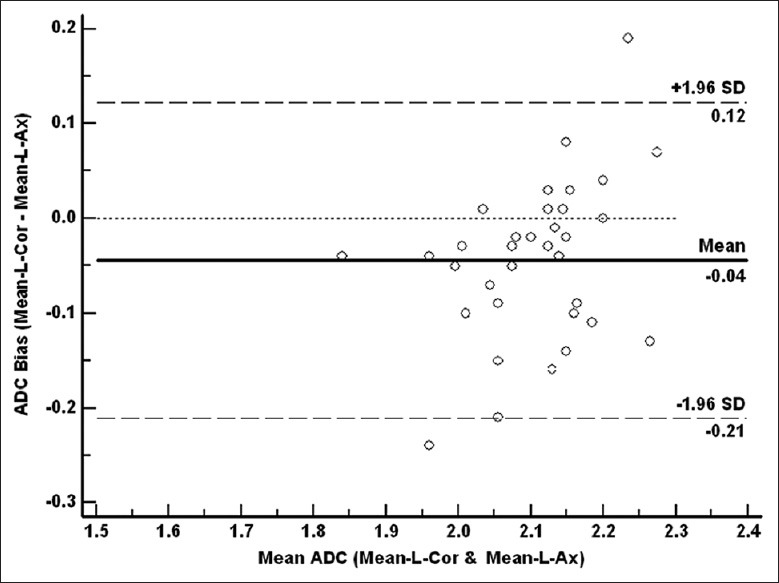
Bland-Altman plots of differences in apparent diffusion coefficient (ADC) measurements between the mean ADC value of the left kidney on coronal diffusion-weighted magnetic resonance (DW-MR) imaging (Mean-L-Cor) and that on axial DW-MR (Mean-L-Ax) (y-axis) against the mean ADC value between the Mean-L-Cor and Mean-L-Ax (x-axis), with the mean absolute difference (bias) (continuous line) and the 95% confidence interval of the mean difference (limits of agreement) (dashed lines).
Figure 5.
Bland-Altman plots of the difference in apparent diffusion coefficient (ADC) measurements between the mean ADC value of the bilateral kidneys on coronal diffusion-weighted magnetic resonance (DW-MR) imaging (Mean-B-Cor) and that on axial DW-MR (Mean-B-Ax) (y-axis) against the mean ADC value between the Mean-B-Cor and Mean-B-Ax (x-axis), with the mean absolute difference (bias) (continuous line) and 95% confidence interval of the mean difference (limits of agreement) (dashed lines).
Figure 4.
Bland-Altman plots of the difference in apparent diffusion coefficient (ADC) measurements between the mean ADC value of right kidney on coronal diffusion-weighted magnetic resonance (DW-MR) imaging (Mean-R-Cor) and that on axial DW-MR (Mean-R-Ax) (y-axis) against the mean ADC value between the Mean-R-Cor and Mean-R-Ax (x-axis), with the mean absolute difference (bias) (continuous line) and 95% confidence interval of the mean difference (limits of agreement) (dashed lines).
DISCUSSION
In the present study, although the SNR of coronal DW-MRI was inferior to that of conventional axial DW-MRI, the ADC values of the kidney as determined by coronal DW-MRI and axial DW-MRI showed moderate-to-good agreement and the agreement between the mean ADC values of the bilateral kidneys exhibited the highest ICC. These findings are of clinical and scientific significance because they mean that the ADC values obtained from coronal DW-MRI and axial DW-MRI are comparable. Moreover, the axial renal diameter is shorter than the coronal; thus, fewer scanning slices in the coronal plane can cover the whole kidney. Thus, scanning time will probably be less than that of axial DW-MRI, an advantageous feature, particularly for breath-hold DW-MRI. The reason why the SNR of coronal DW-MRI is slightly lower than that of axial DW-MRI is unclear; however, this may probably be ascribed to more obvious noise in the former scan, due to marked distortion of the peripheral parts of coronal DW images.
Respiratory-triggered DW-MRI rather than breath-hold DW-MRI was used in the current study because, in clinical practice, patients referred for MRI (particularly DW-MRI) are sometimes in poor general condition due to underlying malignant disease and have inadequate breath-holding capacity. Respiratory-triggered DW-MRI is a viable option in such patients because, during attempted breath-holding, some patients cannot avoid jerky, involuntary inspiratory efforts that create deleterious artifacts upon breath-hold DW-MRI. Furthermore, it was earlier confirmed that respiratory-triggered DW-MRI affords better imaging quality than breath-hold DW-MRI.[15] Furthermore, respiratory-triggered DW-MRI was as effective as breath-hold DW-MRI in preventing misregistration,[16] and the results of our previous studies demonstrated that the ADC values were similar, as was ADC data scattering, in both sequences.
A wide range of renal parenchymal ADCs has been reported in the literature,[6,17,18] probably attributable to differences in the MRI systems used and specific sequence parameters (mainly different b values). The latter point was recently noted by Zhang et al.,[19] who also indicated that ADCs measured with low b values exhibited high standard deviations. Thus, selection of b values has been pivotal in DW-MRI studies. We chose b values of 0 and 800 s/mm2 as optimal parameters in light of our previous data[13] showing that DW-MRI data obtained with b values of 0 and 800 s/mm2 better reflect the actual ADC values of the renal parenchyma and renal lesions. In the present study, the ADC values of the kidney in coronal DW-MRI and axial DW-MRI ranged from (2.082 ± 0.114) × 10−3 mm2/s to (2.127 ± 0.087) × 10−3 mm2/s, in agreement with the ADCs for normal renal parenchyma reported by Cova et al.[20] and Squillaci et al.[21] ((2.19 ± 0.17) × 10−3 mm2/s and (2.20 ± 0.20) × 10−3 mm2/s, respectively). However, recent reports have suggested that ADC values obtained by a conventional mono-exponential model of DWI were not precise[19] and that the intravoxel incoherent motion DW imaging (IVIM-DWI) parameters f(p) and D (t) obtained via bi-exponential fitting of multi-b value-DWI afford higher accuracy when renal lesions are studied.[22] However, in our present study, IVIM-DWI was not used because the scanning time is much longer than that of conventional DW-MRI, being possibly unacceptable in routine clinical practice. Upon improvement of IVIM-DWI, and decrease in the scanning time, we plan to explore this modality in coronal DW-MRI or axial DW-MRI.
Our study had several limitations. Only normal volunteers were enrolled; subjects with renal lesions were not. Therefore, the situation is rather artificial, further investigation is needed. In addition, renal parenchyma is relatively more homogeneous than renal tumors, and ROI placement may have a smaller impact on ADC measurements on kidneys than on renal tumors, which are heterogeneous. However, research on normal renal parenchyma provides the base for further investigation of renal tumors. Second, age or gender may impact on ADC measurement and thus, the results of this study. To date, no thorough evidence has been adduced confirming any relationship between ADC values and age or gender; we plan such work in a future study. Finally, we used only a 1.5-T MRI platform. ADC values may differ between 1.5-T and 3.0-T MR systems, and our results may not be applied to work with the latter system.
CONCLUSION
We suggest that coronal DW-MRI can be an additional DW-MRI method to calculate ADC values in normal kidneys, and will be potentially utilized to evaluate the renal lesions.
ACKNOWLEDGMENTS
We would like to express our gratitude to Professor J.G. (Hans) Blickman, Editor-in-Chief of the European Journal of Radiology, for advice regarding the revision of our paper. We would also like to offer our gratitude for the support and assistance afforded by Zhen-Yu Zhou Ph.D. of GE Healthcare MR Research China.
Footnotes
Edited by: Li-Shao Guo
Source of Support: This study was supported by a grant from Clinical Support Fund of Chinese People's Liberation Army General Hospital (No. 2012FC-TSYS-3049).
Conflict of Interest: None declared.
REFERENCES
- 1.Taouli B, Koh DM. Diffusion-weighted MR imaging of the liver. Radiology. 2010;254:47–66. doi: 10.1148/radiol.09090021. [DOI] [PubMed] [Google Scholar]
- 2.Wang H, Zhang X, Ye H. Applications of diffusion-weighted magnetic resonance imaging in renal cell carcinoma. Expert Rev Anticancer Ther. 2011;11:1017–22. doi: 10.1586/era.11.77. [DOI] [PubMed] [Google Scholar]
- 3.Lassel EA, Rao R, Schwenke C, Schoenberg SO, Michaely HJ. Diffusion-weighted imaging of focal renal lesions: A meta-analysis. Eur Radiol. 2014;24:241–9. doi: 10.1007/s00330-013-3004-x. [DOI] [PubMed] [Google Scholar]
- 4.Ramírez-Galván YA, Cardona-Huerta S, Ibarra-Fombona E, Elizondo-Riojas G. Apparent diffusion coefficient (ADC) value to evaluate BI-RADS 4 breast lesions: Correlation with pathological findings. Clin Imaging. 2015;39:51–5. doi: 10.1016/j.clinimag.2014.09.015. [DOI] [PubMed] [Google Scholar]
- 5.Kang TW, Kim SH, Jang KM, Choi D, Ha SY, Kim KM, et al. Gastrointestinal stromal tumours: Correlation of modified NIH risk stratification with diffusion-weighted MR imaging as an imaging biomarker. Eur J Radiol. 2015;84:33–40. doi: 10.1016/j.ejrad.2014.10.020. [DOI] [PubMed] [Google Scholar]
- 6.Paudyal B, Paudyal P, Tsushima Y, Oriuchi N, Amanuma M, Miyazaki M, et al. The role of the ADC value in the characterisation of renal carcinoma by diffusion-weighted MRI. Br J Radiol. 2010;83:336–43. doi: 10.1259/bjr/74949757. [DOI] [PMC free article] [PubMed] [Google Scholar]
- 7.Sandrasegaran K, Sundaram CP, Ramaswamy R, Akisik FM, Rydberg MP, Lin C, et al. Usefulness of diffusion-weighted imaging in the evaluation of renal masses. AJR Am J Roentgenol. 2010;194:438–45. doi: 10.2214/AJR.09.3024. [DOI] [PubMed] [Google Scholar]
- 8.Thoeny HC. Salt Lake City, USA: ISMRM; 2013. Added value of DWI for your clinical practice renal lesions: Added value of diffusion MRI. [Google Scholar]
- 9.Xu Y, Wang X, Jiang X. Relationship between the renal apparent diffusion coefficient and glomerular filtration rate: Preliminary experience. J Magn Reson Imaging. 2007;26:678–81. doi: 10.1002/jmri.20979. [DOI] [PubMed] [Google Scholar]
- 10.Yildirim E, Kirbas I, Teksam M, Karadeli E, Gullu H, Ozer I. Diffusion-weighted MR imaging of kidneys in renal artery stenosis. Eur J Radiol. 2008;65:148–53. doi: 10.1016/j.ejrad.2007.03.007. [DOI] [PubMed] [Google Scholar]
- 11.Xu X, Fang W, Ling H, Chai W, Chen K. Diffusion-weighted MR imaging of kidneys in patients with chronic kidney disease: Initial study. Eur Radiol. 2010;20:978–83. doi: 10.1007/s00330-009-1619-8. [DOI] [PubMed] [Google Scholar]
- 12.Notohamiprodjo M, Glaser C, Herrmann KA, Dietrich O, Attenberger UI, Reiser MF, et al. Diffusion tensor imaging of the kidney with parallel imaging: Initial clinical experience. Invest Radiol. 2008;43:677–85. doi: 10.1097/RLI.0b013e31817d14e6. [DOI] [PubMed] [Google Scholar]
- 13.Wang H, Cheng L, Zhang X, Wang D, Guo A, Gao Y, et al. Renal cell carcinoma: Diffusion-weighted MR imaging for subtype differentiation at 3.0 T. Radiology. 2010;257:135–43. doi: 10.1148/radiol.10092396. [DOI] [PubMed] [Google Scholar]
- 14.Bland JM, Altman DG. Statistical methods for assessing agreement between two methods of clinical measurement. Lancet. 1986;1:307–10. [PubMed] [Google Scholar]
- 15.Nasu K, Kuroki Y, Sekiguchi R, Nawano S. The effect of simultaneous use of respiratory triggering in diffusion-weighted imaging of the liver. Magn Reson Med Sci. 2006;5:129–36. doi: 10.2463/mrms.5.129. [DOI] [PubMed] [Google Scholar]
- 16.Kandpal H, Sharma R, Madhusudhan KS, Kapoor KS. Respiratory-triggered versus breath-hold diffusion-weighted MRI of liver lesions: Comparison of image quality and apparent diffusion coefficient values. AJR Am J Roentgenol. 2009;192:915–22. doi: 10.2214/AJR.08.1260. [DOI] [PubMed] [Google Scholar]
- 17.Yoshikawa T, Kawamitsu H, Mitchell DG, Ohno Y, Ku Y, Seo Y, et al. ADC measurement of abdominal organs and lesions using parallel imaging technique. AJR Am J Roentgenol. 2006;187:1521–30. doi: 10.2214/AJR.05.0778. [DOI] [PubMed] [Google Scholar]
- 18.Kilickesmez O, Inci E, Atilla S, Tasdelen N, Yetimoglu B, Yencilek F, et al. Diffusion-weighted imaging of the renal and adrenal lesions. J Comput Assist Tomogr. 2009;33:828–33. doi: 10.1097/RCT.0b013e31819f1b83. [DOI] [PubMed] [Google Scholar]
- 19.Zhang JL, Sigmund EE, Chandarana H, Rusinek H, Chen Q, Vivier PH, et al. Variability of renal apparent diffusion coefficients: Limitations of the monoexponential model for diffusion quantification. Radiology. 2010;254:783–92. doi: 10.1148/radiol.09090891. [DOI] [PMC free article] [PubMed] [Google Scholar]
- 20.Cova M, Squillaci E, Stacul F, Manenti G, Gava S, Simonetti G, et al. Diffusion-weighted MRI in the evaluation of renal lesions: Preliminary results. Br J Radiol. 2004;77:851–7. doi: 10.1259/bjr/26525081. [DOI] [PubMed] [Google Scholar]
- 21.Squillaci E, Manenti G, Cova M, Di Roma M, Miano R, Palmieri G, et al. Correlation of diffusion-weighted MR imaging with cellularity of renal tumours. Anticancer Res. 2004;24:4175–9. [PubMed] [Google Scholar]
- 22.Chandarana H, Lee VS, Hecht E, Taouli B, Sigmund EE. Comparison of biexponential and monoexponential model of diffusion weighted imaging in evaluation of renal lesions: Preliminary experience. Invest Radiol. 2011;46:285–91. doi: 10.1097/RLI.0b013e3181ffc485. [DOI] [PubMed] [Google Scholar]