

Abstract
We developed and validated a fully articulated model of the thoracolumbar spine in opensim that includes the individual vertebrae, ribs, and sternum. To ensure trunk muscles in the model accurately represent muscles in vivo, we used a novel approach to adjust muscle cross-sectional area (CSA) and position using computed tomography (CT) scans of the trunk sampled from a community-based cohort. Model predictions of vertebral compressive loading and trunk muscle tension were highly correlated to previous in vivo measures of intradiscal pressure (IDP), vertebral loading from telemeterized implants and trunk muscle myoelectric activity recorded by electromyography (EMG).
1. Introduction
Musculoskeletal models of the human body are now widely used to gain insight into normal human movement, pathologic conditions, and the effects of surgical or rehabilitative treatments [1]. These models allow the determination of the forces on muscles, bones, and joints that are generally not measurable in vivo. However, whereas the extremities, cervical spine, and lumbar spine have been the subjects of significant musculoskeletal modeling efforts, the thorax has not. Prior musculoskeletal models have incorporated the thorax as a single rigid segment [2], have neglected the mechanical contribution of the ribs and sternum [2–5], or have lacked an anatomically realistic model of the rib cage [6], making them unsuitable for predicting thoracic skeletal and muscular loading. A few prior models included an articulated thoracic spine, but not the rib cage or the detailed thoracic musculature [3,5,7–9]. In addition, these prior models were not validated against in vivo measures of spine and trunk muscle loading, and were only used to assess vertebral loading during a neutral standing posture. Other computational models of the thorax have utilized finite element analysis, focusing on thorax deformation and predicting injury tolerances in motor vehicle accidents [10]. However, these models do not include muscular anatomy and therefore are also not suitable for studying the in vivo thoracic skeletal loads that occur during normal daily activities. A detailed, fully articulated, musculoskeletal model of the thoracolumbar spine and rib cage would allow prediction of the in vivo skeletal and muscular loads that occur in the thorax during different activities and facilitate investigations into the biomechanical mechanisms underlying, and potential treatments for, multiple thoracic diseases and conditions, including vertebral fractures, hyperkyphosis, scoliosis, respiratory insufficiency, and back pain.
Musculoskeletal models typically rely on detailed cadaver dissections or anatomical descriptions to determine muscle position and architectural parameters [2,11–13]. Although this type of data is necessary for creating detailed models that account for a muscle group's individual fascicles and many attachments, the resulting models are generic and reflect input parameters from a small and potentially heterogeneous sample. Further, muscle areas and positions derived from cadavers may not be representative of muscle anatomy in vivo, due to the effects of preserving medium and dehydration [14]. Muscle anatomy assessed in vivo using medical imaging such as CT or magnetic resonance imaging (MRI) could be used in combination with detailed cadaver studies to create musculoskeletal models that are more physiologically relevant. Further, the use of clinical imaging data could allow construction of models that are tailored to specific populations or individuals depending on the research or clinical objective.
Therefore, the objectives of this study were to develop and validate an anatomically detailed musculoskeletal model of the spine, including the lumbar and thoracic vertebrae, ribs, and sternum, which accurately predicts lumbar and thoracic vertebral loading during different activities. In developing the model, we employed a novel approach that used CT scans of the trunk from subjects sampled from a community-based cohort to adjust the CSA and position of the trunk muscles in the model. To validate the accuracy of the model, we compared vertebral loading and trunk muscle tension predicted by the model to previously collected in vivo measurements of IDP, vertebral compression from telemeterized implants, and trunk muscle myoelectric activity from EMG.
2. Methods
2.1. Definition of Skeletal Anatomy and Joints in the Model.
We created a model of the full thoracolumbar spine and rib cage using opensim musculoskeletal modeling software [1]. The skeletal anatomy was based on CT scans of a 25-year-old male (obtained from the opensim geometry file library), 50th percentile for height and weight (height = 175 cm and weight = 78 kg). The positions and orientations of the vertebral bodies, defining the curvature of the spine, were based on average measurements available in the literature with thoracic kyphosis (T1–T12 Cobb angle) set to 50 deg and lumbar lordosis (L1–L5 Cobb angle) set to −43 deg [15,16]. The size and shape of the ribs and sternum were based on published morphometric equations that describe the position of three to five major landmarks on each rib [17]. Cubic splines were fit to these landmarks to model the shape of each individual rib. Point to point actuators were placed between the ends of the ribs and the sternum (ribs 1–7) or between the ends of adjacent ribs (ribs 8–10) to represent forces transmitted by costal cartilage. The actuators generate a compressive or tensile force along their length, and these forces are determined as part of the same static optimization routine that computes muscle forces in the model (described later). The optimal force of these actuators was set to a high value (1000 N) so that optimization would favor loading of the actuators over the muscles, allowing the costal cartilage to supply as much supporting force as possible to the ends of the ribs. The value of 1000 N for the costal cartilage actuators was chosen based on the results of a sensitivity analysis (described in Sec. 2.4).
The arms, head, and neck were incorporated from other previously published and freely available opensim models (Vasavada neck model [13] and Stanford VA Upper Extremity model [18]). The upper extremity model includes shoulder, elbow, wrist, and radioulnar joints, allowing us to simulate physiologic movement of the upper extremities during different activities, such as lifting and carrying objects. The head and neck were adapted into a single lumped body connected to T1 via a ball joint (three rotational degrees-of-freedom). The intervertebral joints (L5/S1 to T1/T2) were modeled as ball joints with a center of rotation placed at the geometric center of the intervertebral disk, allowing for segmental movement of the thoracic and lumbar spine in three dimensions. The hip joint, connecting the pelvis to the ground, was modeled as a pin joint (one rotational degree-of-freedom) allowing for anterior and posterior tilting of the pelvis.
For each type of trunk movement (flexion/extension, lateral bending, and axial rotation), prior studies were used to determine the percentage of total motion that occurs at the pelvis and the individual lumbar and thoracic intervertebral joints. For trunk flexion/extension, the ratio of lumbar flexion to pelvic flexion (lumbopelvic ratio) was computed as a function of total trunk flexion, ranging from approximately 2.5 at the beginning of trunk flexion to 1.0 at end range of motion (Supplemental Table 1 available under “http://dx.doi.org/10.1115/1.4030408” tab for this paper on the ASME Digital Collection) [19]. The lumbar and thoracic regions were set to contribute approximately equally to the spine component of trunk flexion (51% lumbar and 49% thoracic) [20,21]. For lateral bending, the lumbar and thoracic spines were set to contribute 27% and 73% of total trunk movement, respectively [20,22,23]. For axial rotation, the lumbar and thoracic spines were set to contribute 17% and 83% of total trunk movement, respectively [24,25]. The distribution of movement at each intervertebral joint is presented in Supplemental Table 2 (available under “http://dx.doi.org/10.1115/1.4030408” tab for this paper on the ASME Digital Collection).
The costovertebral joints connecting the ribs to the thoracic vertebrae (T1–T12 on the left and right sides) were modeled as pin joints [26,27], allowing for the physiologic motion of the ribs during ventilation [28] and the proper transmission of forces between ribs and the thoracic spine during activities. Each rib rotates about its own cervical axis, which is a vector pointing between the costovertebral and costotransverse joints [26,27]. The positions of these joints on the thoracic vertebral bodies were estimated using data from Schultz et al. [29,30], and used to set the positions and orientations of the costovertebral joints in the model (Supplemental Table 3 available under “http://dx.doi.org/10.1115/1.4030408” tab for this paper on the ASME Digital Collection).
The mass and center of mass positions of body segments in the model were based on published anthropometric ratios [31–33]. The mass of the trunk was partitioned among the vertebral bodies and sacrum, with the mass of each trunk slice and its anterior offset relative to the vertebral body determined from prior cadaver studies [31–33]. The lumped head and neck body was assigned a single mass [31]. The ribs, sternum, clavicles, and scapulae were each assigned an arbitrarily low mass of 0.0001 kg. The mass properties of the humeri, radii, ulnae, and hands from the Stanford VA Upper Extremity model [18] were maintained, since these corresponded to a 50th percentile 25-year-old male.
2.2. Model Muscle Anatomy.
Muscles that attach to the spine and thorax were incorporated from previously published opensim models (Fig. 1 and Table 1) [2,13,18]. As opposed to attaching to a single rigid thorax body, these muscles were edited to attach to the individual thoracic vertebral bodies, ribs, clavicles, scapulae, and sternum. The major lumbar spine and abdominal muscle groups were incorporated from the Christophy lumbar spine model [2,34], and muscles attaching to the upper and mid-thorax were adapted from the Vasavada cervical spine model [13] and the Stanford VA upper extremity model [18]. Additional muscle groups were then added, including the external and internal intercostals, the thoracic multifidus, the lower portion of the trapezius, the serratus anterior [35,36], and the transversus abdominis [37]. Each muscle group is represented by multiple fascicles crossing one or more joints, and each fascicle is represented by a Hill-Type model that modulates force generating potential due to changes in muscle fiber length and velocity [38]. Muscle architectural parameters (physiological CSA, pennation angle, optimal fiber length, and tendon slack length) for muscles incorporated from previous opensim models, as well as for the muscles we added, were based on prior literature studies or estimated (Supplemental Table 4 available under “http://dx.doi.org/10.1115/1.4030408” tab for this paper on the ASME Digital Collection) lists all muscle architectural parameters used in the model, including their source and how they were calculated or estimated). The maximum isometric force a muscle can generate is equal to its physiologic CSA (PCSA) multiplied by a constant maximum muscle stress (MMS) [14]. We used a MMS of 100 N/cm2 for all muscles except the shoulder muscle groups, which were set to 140 N/cm2 [18]. We performed a sensitivity study to justify our selection of MMS, described in Sec. 2.4.
Fig. 1.

(a) Image of the new musculoskeletal spine model shown with and without muscles. (b) The model can simulate sagittally symmetric and asymmetric activities. Here, the model is simulating 30 deg trunk flexion and 20 deg trunk lateral bending to the right.
Table 1.
Muscle groups incorporated into the model. Muscle fascicles from previously published opensim models attached to a single rigid thorax, so these muscles were updated to attach to individual thoracic vertebral bodies, ribs, and the sternum in the new model.
| Source | Muscle groups included in model |
|---|---|
| opensim lumbar spine model [2] | Lumbar and thoracic erector spinae, lumbar multifidus, psoas major, quadratus lumborum, latissimus dorsi, external and internal obliques, and rectus abdominis |
| opensim cervical spine model [13] | Cervical erector spinae, cervical multifidus, sternocleidomastoid, scalenes, longus colli, splenius, semispinalis, levator scapulae, and superior trapezius |
| opensim upper extremity model [18] | Deltoid, supraspinatus, infraspinatus, subscapularis, teres minor, teres major, pectoralis major, and coracobrachialis |
| Added in current study | Internal and external intercostals, serratus anterior, inferior trapezius, thoracic multifidus, and transversus abdominis |
Because more precise data were lacking, the PCSA of the external and internal intercostals were estimated using rib lengths (approximately between the rib tubercles posteriorly and the ends of the bony ribs anteriorly) multiplied by 5 mm, the estimated thickness of the external and internal intercostal muscle sheets together (2.5 mm thickness for each sheet). The external intercostals were set to form angles of approximately 40 deg relative to the superior ribs and the internal intercostals were set to form angles of approximately 120 deg relative to the inferior ribs [39,40]. Optimal fiber lengths were computed as the distance between attachment points on adjacent ribs, and pennation angles and tendon slack lengths were assumed to be 0 deg and 0.1 mm, respectively. Muscle architectural parameters for the thoracic multifidus and the lower trapezius were estimated from the cervical [13] and lumbar multifidus [2] and the upper trapezius, respectively [12,13].
2.3. Adjustment of Muscle CSA and Position Using In Vivo CT Measurements.
The CSA and position of the muscles in this and other models are derived from multiple sources, mostly consisting of dissection studies using a small, heterogeneous group of cadavers [2,11–13]. Thus, to ensure physiologic size and position we used previously collected CT-based measurements of trunk muscle CSA and position performed in a sample of participants from the community-based Framingham Heart Study Offspring and Third Generation Multidetector CT Study [41] to adjust muscle CSA and position in the model. Specifically, we previously measured the CSA and position (medial–lateral (ML) and anterior–posterior (AP) moment arms with respect to the vertebra) of several major trunk muscle groups (rectus abdominis, latissimus dorsi, trapezius, external oblique, internal oblique, erector spinae, mutlifidus, psoas major, quadratus lumborum, serratus anterior, and pectoralis major) in 51 men (mean age = 59.4, Ht = 177.6 cm, Wt = 86.3 kg) [42]. Measurements were made at the mid-plane of each vertebral body between T6 and L5. In our spine model, each muscle group consists of multiple fascicles. To facilitate the comparison and then adjustment of our model to the CT cohort data, we calculated an equivalent muscle group CSA and position at each vertebral mid-plane in the model (Fig. 2). To do so, for each muscle group at each vertebral mid-plane in the model, we summed the CSAs of the individual fascicles crossing the vertebral mid-plane to compute an equivalent muscle group CSA at that level. Similarly, we computed the centroid of the fascicles crossing the vertebral mid-plane to find the AP and ML moment arms of the muscle group relative to the vertebral centroid. Figure 2 illustrates this process by showing how trapezius group CSA and position at T9 were calculated from the model.
Fig. 2.

Method for calculating muscle group CSA and moment arm in the model at different transverse planes, facilitating comparisons to muscle group CSA and moment arm made on axial CT images. The example above shows the calculation of trapezius CSA and moment arm at the T9 midvertebral plane in the model (a), which we would like to compare to measurements of trapezius CSA and moment arm made on axial CT at the T9 midplane (b). The four trapezius fascicles in the model that cross the T9 midplane are schematically shown in (c), where they are plotted relative to the T9 vertebral body centroid. The size of the circles is equal to the CSA of the individual fascicles, and these areas are summed to get trapezius CSA at T9. The centroid of the fascicles is then calculated and used to find the ML and AP moment arms of the muscle group relative to the vertebral centroid.
We adjusted the CSA of nine muscle groups (rectus abdominis, latissimus dorsi, trapezius, external oblique, internal oblique, erector spinae, mutlifidus, psoas major, and quadratus lumborum) between T6 and L5 in the model to match the average CSA measurements from men in our CT cohort (Table 2). We were unable to adjust CSA of the serratus anterior and the pectoralis major because these fascicles were primarily oriented parallel to the transverse plane in the model, whereas our muscle measurements were made within the transverse plane. We then adjusted the AP and ML moment arms of erector spinae, multifidus, rectus abdominis, and trapezius to match the average male AP and ML moment arm measurements from our CT cohort. The moment arms of the other muscle groups in the model were generally within two standard deviations of the measured moment arms, and therefore did not require adjustment.
Table 2.
RMSE values for the pre-adjusted and adjusted models versus the cohort CT measurements of muscle morphology. CSA was scaled for all nine muscle groups, but AP moment arms and ML moment arms were only scaled for rectus abdominis, trapezius, erector spinae, and multifidus. The adjusted model has lower RMSE values for the scaled muscle parameters.
|
CSA RMSE (cm2) |
AP moment arm RMSE (cm) |
ML moment arm RMSE (cm) |
||||
|---|---|---|---|---|---|---|
| Pre-adjusted model | Adjusted model | Pre-adjusted model | Adjusted model | Pre-adjusted model | Adjusted model | |
| Rectus abdominis | 1.24 | 0.80 | 1.07 | 0.32 | 2.33 | 0.42 |
| Latissimus dorsi | 1.77 | 1.67 | 1.28 | 1.25 | 2.18 | 2.18 |
| Trapezius | 3.11 | 0.68 | 1.41 | 0.43 | 1.27 | 0.47 |
| External oblique | 4.38 | 1.43 | 1.33 | 1.59 | 5.53 | 5.26 |
| Internal oblique | 1.99 | 1.17 | 2.31 | 2.32 | 2.34 | 2.37 |
| Erector spinae | 5.99 | 2.10 | 1.92 | 0.36 | 1.82 | 0.34 |
| Multifidus | 1.86 | 0.40 | 1.11 | 0.34 | 0.74 | 0.21 |
| Psoas major | 2.60 | 1.37 | 0.52 | 0.54 | 0.73 | 0.72 |
| Quadratus lumborum | 2.97 | 0.83 | 0.55 | 0.54 | 1.40 | 1.38 |
To adjust the CSA of a muscle group in the model, we multiplied fascicle CSA by the ratio of measured muscle group CSA to model muscle group CSA at each vertebral level where the muscle was present, and then averaged across vertebral levels to compute an adjusted fascicle CSA. The following equation describes the adjustment process for each muscle fascicle in a muscle group:
| (1) |
where CSAmeasured_gr is the average CSA of the equivalent muscle group from CT measurements, CSAmodel_gr is the pre-adjusted CSA of the muscle group in the model, CSAmodel_fas is the pre-adjusted CSA of the fascicle, CSAadjusted_fas is the adjusted fascicle CSA, and L is the vertebral levels where the muscle was measured. The adjusted CSAs of the fascicles were then used to calculate adjusted equivalent muscle group areas in the model, following the same method outlined in Fig. 2.
To adjust the AP and ML moment arms of a muscle group, we calculated the difference between CT-measured and model equivalent AP and ML moment arms at each vertebral level where the muscle was measured, and used linear interpolation to estimate this difference in the regions between measurements. The attachment points of individual fascicles were then automatically moved this amount within the transverse plane to reduce the difference between the model and the measured data. To evaluate the effectiveness of our CSA and moment arm adjustments, we computed root mean square errors (RMSE) for both the pre-adjusted and the adjusted models versus the measured cohort CT data.
2.4. Sensitivity Studies.
We performed four analyses to assess the sensitivity of our model to key assumptions. First, we characterized the effect of MMS on vertebral compressive loading. A wide range of values (approximately 20–140 N/cm2) has been reported in the literature for MMS [18,43]. A value of 46 N/cm2 is often used in spine models for muscles of the trunk [11], derived by computing the MMS that would allow the extension strength of a lumbar spine model to best match average L5-level trunk extensor moments measured in a different study. Given the uncertainty in this parameter, we varied MMS between 20 and 140 N/cm2 (in increments of 10). Another source of uncertainty is the PCSA of the internal and external intercostals, so we varied this parameter from 25% to 175% (in increments of 25%) of its baseline value. In another analysis, we tested the sensitivity of our model's vertebral compressive loading predictions to the optimal force of the costal cartilage actuators, which we varied from 0 N (equivalent to no actuators present) to 1000 N in 100 N increments (results are reported in Supplemental Fig. 1 available under “http://dx.doi.org/10.1115/1.4030408” figure for this paper on the ASME Digital Collection). Finally, we tested the sensitivity of our model's vertebral compressive loading predictions to the locations of the intervertebral joints. The instantaneous axes of rotation (IAR) of the intervertebral joints vary substantially between individuals, vertebral levels, and with disk health, and for simplicity we located the IAR at the geometric center of each disk. To assess the impact of this assumption on vertebral compressive loading predictions, we compared loading estimates from our baseline model to those from a model in which the lumbar intervertebral joints were shifted posterior and inferior to match the IARs reported by Pearcy and colleagues (results are reported in Supplemental Fig. 2 available under “http://dx.doi.org/10.1115/1.4030408” tab for this paper on the ASME Digital Collection) [44].
2.5. Validation of Vertebral Compressive Loading and Muscle Force Predictions.
To evaluate the accuracy of vertebral loading and muscle force predictions from the model, we simulated a variety of activities for which prior studies have acquired in vivo measures of IDP, vertebral implant loads, or myoelectric activity of trunk muscles. A list of these validation studies with the activities they investigated, the characteristics of the study participants, and the primary measurements made is found in Table 3 [45–51]. For each validation study we created a version of our spine model that was scaled to the average height and weight of the study participants, and we estimated muscle group CSA and AP and ML moment arms from previously published regressions [42] using the average age, sex, height, and weight of the study participants. We then adjusted the CSA and moment arms in the model to match the CSA and moment arms predicted by regression using our muscle adjustment algorithm (Sec. 2.3). These spine models were used to simulate the static, isometric activities performed in the validation studies so that the model predictions could be correlated with the measured data. For each activity, muscle forces that satisfy static equilibrium were computed using an optimization routine that minimizes the sum of cubed muscle activations, which is equivalent to maximizing muscle endurance [52,53].
Table 3.
Studies used for validation of the model. For each study, the average age, height, and weight of the study participants was used to scale the model size, mass, and muscle CSA and moment arms, and the model was then used to simulate the listed isometric activities. Measured IDP, vertebral implant loads, and trunk muscle myoelectric activity (EMG) were compared to vertebral loading and trunk muscle tension predicted by the model. For studies with N > 1, we list the mean body mass and height, and the range of ages for the study subjects. BM = body mass and HT = height.
| Study | Subjects | Subject characteristics | Measures | Activities |
|---|---|---|---|---|
| Andersson et al. [45] | 3F | BM = 61 kg | L3/L4 IDP | 10–50 deg lumbar flexion, 10.2 kg each hand |
| 1M | HT = 173 cm | T4 EMG | ||
| Ages 26–34 | ||||
| Polga et al. [46] | 4 M | BM = 73 kg | T6–T7 or | Standing |
| 2 W | HT = 178 cm | T7–T8 IDP | Standing, 10-kg in each hand at the side | |
| Ages = 19–47 | T9–T10 or | Standing, 10-kg in each hand, elbows 90 deg | ||
| T10–T11 IDP | 30 deg trunk flexion | |||
| 30 deg trunk flexion, 10-kg in each hand | ||||
| 15 deg trunk extension | ||||
| 30 deg axial rotation to the left | ||||
| 20 deg lateral bend to the right | ||||
| Rohlmann et al. [51] | 2 M | BM = 70 kg | L1 Implant load | Standing |
| HT = 169 cm | 30 deg trunk flexion | |||
| Ages = 62–71 | 15 deg trunk extension | |||
| 30 deg axial rotation to the left | ||||
| 20 deg lateral bend to the right | ||||
| Elevate right arm 90 deg | ||||
| Elevate arms 90 deg | ||||
| Abduct arms 90 deg | ||||
| Sato et al. [47] | 8 M | BM = 73 kg | L4/L5 IDP | Standing |
| HT = 174 cm | 30 deg trunk flexion | |||
| 15 deg trunk extension | ||||
| Ages = 22–29 | ||||
| Schultz et al. [48] | 3 W | BM = 63 kg | L3/L4 IDP | Standing |
| 1 M | HT = 174 cm | L1–L5 EMG | Standing, arms in, holding 8 kg | |
| Ages = 19–23 | Standing, arms out | |||
| Standing, arms out, holding 8 kg | ||||
| 30 deg trunk flexion, arms out | ||||
| 30 deg trunk flexion, arms out, holding 8 kg | ||||
| Takahashi et al. [49] | 3 M | BM = 72 kg | L4/L5 IDP | Standing |
| HT = 176 cm | L3 EMG | Standing, 5 kg in each hand at the side | ||
| Ages = 24–26 | 10 deg trunk flexion | |||
| 10 deg trunk flexion, 5 kg in each hand | ||||
| 20 deg trunk flexion | ||||
| 20 deg trunk flexion, 5 kg in each hand | ||||
| 30 deg trunk flexion | ||||
| 30 deg trunk flexion, 5 kg in each hand | ||||
| Wilke et al. [50] | 1 M | BM = 72 kg | L4/L5 IDP | Standing |
| HT = 174 cm | Standing, 20-kg in left hand at the side | |||
| Age = 45 | Standing, 20-kg in each hand at the side | |||
| 30 deg trunk flexion | ||||
| 30 deg trunk flexion, 10-kg in each hand | ||||
| 90 deg trunk flexion | ||||
| 15 deg trunk extension | ||||
| 30 deg axial rotation to the left | ||||
| 20 deg lateral bend to the right |
To compare vertebral compressive loads predicted by the model to measured IDP, we converted vertebral compressive loading from the model to an estimated IDP using vertebral body CSA and a previously published correction factor
| (2) |
where F C is the compressive load in the axial direction of the vertebral body predicted by our model, CSAVert is the CSA of the vertebral body, and 0.66 is a correction factor for translating between IDP and compressive loading [54–56]. Although the correction factor has only been computed for lumbar intervertebral disks, we also used this same correction factor to estimate IDP in the thoracic spine, because no study that we are aware of has determined a thoracic-specific correction factor. CSAVert was measured in three of the studies reporting lumbar IDP [47,49,50], and a value of 18 cm2, reported by Wilke et al. [50], was used for the lumbar IDP studies that did not measure CSAVert [45,48]. For thoracic levels, we measured CSAVert in our own CT scans of subjects that closely matched the study participants in sex, age, height, and weight.
Vertebral loads recorded from telemeterized vertebral body implants were reported as a percentage of neutral standing load [51], so vertebral loads predicted by the model were also presented this way for comparison.
Measured myoelectric activity for the erector spinae was correlated with erector spinae tension predicted by the model. The tensions of the erector spinae fascicles closest to the reported electrode locations were summed for comparisons to these validation studies. For instance, Andersson et al. [45] measured myoelectric activity to the left and right of T4, so only the erector spinae fascicles crossing the T4 vertebral level were included in the comparison.
3. Results
3.1. Adjustment of Muscle CSA and Position.
The adjustment process significantly reduced the difference between muscle CSA and moment arm measured in our CT cohort and muscle CSA and moment arm in our adjusted model, as assessed by RMSE (Table 2). For example, the CSA and AP and ML moment arms of the erector spinae group in the model were generally adjusted to be within one standard deviation of the measured data (Fig. 3).
Fig. 3.
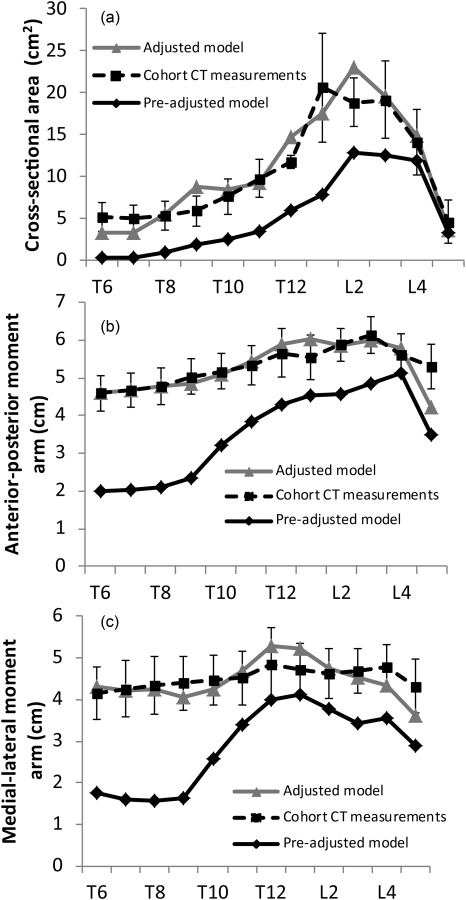
Muscle anatomy for the baseline model (pre-adjusted model) was derived from prior cadaver studies and anatomical descriptions. We generated a new model with muscle group CSA and position scaled to match average in vivo values of muscle CSA and position that were measured on CT scans in a sample of older males (cohort CT measurements) at the vertebral midslices of T6–L5 for several major muscle groups. (a)–(c) The improvement in CSA, AP moment arm, and ML moment arm for the erector spinae muscle group in the adjusted versus pre-adjusted model. The error bars are ±1 standard deviations of the measured data.
3.2. Sensitivity Studies.
We found that the model was unable to satisfy equilibrium even for low intensity activities, such as 30 deg trunk flexion and 20 deg trunk lateral bending, for MMS values below 40 N/cm2. For higher intensity activities, such as 30 deg trunk flexion with 10 kg weights in each hand and upright standing while holding 10 kg weights in each hand and elbows flexed 90 deg, the model was unable to satisfy equilibrium for MMS values below 60 N/cm2. To ensure that our model muscle strength was strong enough to satisfy equilibrium for all of the activities in the validation studies, we chose to set MMS at 100 N/cm2, which is at the higher end of the range of measured values [43]. For the shoulder muscle groups, we retained the value of 140 N/cm2 used by Holzbaur et al. [18]. For values of MMS for which the model was able to satisfy equilibrium, there were very small differences in vertebral loading for increasing values of MMS. For instance, the differences in vertebral compressive loading for MMS values between 60 N/cm2 and 100 N/cm2 were less than 1.5% for vertebral levels below T7, less than 6% for levels T3–T7, and less than 13% at T1 and T2.
Varying the PCSA of the intercostals had a minimal effect on vertebral compressive loading in the lumbar spine, but a larger effect in the thoracic spine. For 30 deg trunk flexion, using 25% of the baseline PCSA caused vertebral loading to increase by 2–7% for vertebrae in the upper thoracic spine, and decrease by up to 5% for vertebrae in the mid- to lower-thoracic spine. Using 175% of the baseline PCSA caused vertebral loading to decrease by 2–10% for vertebrae in the upper thoracic spine and increase by up to 4% for vertebrae in the mid- to lower-thoracic spine. For upright standing while holding 10 kg weights in each hand and elbows flexed 90 deg, using 25% of the baseline PCSA caused vertebral loading to increase by up to 39% between T1 and T12, and using 175% of the baseline PCSA caused vertebral loading to decrease by 1–18% between T1 and T12.
3.3. Validation Studies.
Vertebral compressive loading estimates from the lumbar and thoracic regions of the model were strongly correlated to previously reported IDP measurements for a variety of sagittally symmetric and asymmetric activities (r = 0.91 for lumbar and r = 0.87 for thoracic loading, Fig. 4). The slopes and intercepts of the linear trend lines relating measured IDP to model IDP were not significantly different than one and zero, respectively (95% confidence intervals for the slopes were 0.767–1.096 for lumbar loading and 0.989–1.966 for thoracic loading, and 95% confidence intervals for the intercepts were −0.205 to 0.147 for lumbar loading and −1.178 to 0.178 for thoracic loading). However, the model slightly under predicted the magnitude of lumbar loading and over predicted the magnitude of thoracic loading for certain activities. L1 vertebral compressive loading predicted by the model was highly correlated with the loads recorded from telemeterized L1 vertebral body implants from two patients for a variety of activities (r = 0.88, Fig. 5), except for extension in which the model predictions of compressive load exceeded the recorded measurements. The slope and intercept of the linear trend line were not significantly different than one and zero, respectively (95% confidence interval for the slope was 0.302–1.044 and 95% confidence interval for the intercept was −4.312 to 101.634).
Fig. 4.

The model was used to simulate activities for which IDP measurements have been previously reported. Vertebral compressive force predicted by the model was converted to an estimated IDP using vertebral area and a correction factor of 0.66. IDP estimated by the model was correlated with IDP measurements made in the lumbar (a) and thoracic spine (b). The error bars in (b) are the range of IDP reported by Polga et al. [46]. The dashed lines represent unity.
Fig. 5.

The model was used to simulate the activities reported in Rohlmann et al. [51], for which vertebral loading at L1 was recorded from telemeterized vertebral implants in two individuals. (a) Vertebral loading is expressed as a percentage of standing load. Error bars are the range of data reported in the study. (b) The correlation between measured and model predicted loading is shown.
Finally, erector spinae muscle tension predicted by the model was highly correlated with measured myoelectric activity in both the lumbar and thoracic regions of the spine, with correlation coefficients of r = 0.98, r = 0.98, and r = 0.91 at T4, L3, and L1–L5, respectively (Fig. 6).
Fig. 6.

The model was used to simulate a range of activities for which trunk muscle myoelectric activity has been previously reported by (a) Takahashi et al. at L3 [49], (b) Schultz et al. at L1–L5 [48], and (c) Andersson et al. at T4 [45]. Measured myoelectric activity was correlated with the sum of erector spinae fascicle tensions predicted by the model at the spine levels measured.
4. Discussion
We created a fully articulated model of the thoracic and lumbar spine that included the individual vertebrae, ribs, sternum, and the major trunk muscle groups. The model can simulate daily activities in a quasi-static fashion, with muscle forces being solved via an optimization routine that minimizes the sum of cubed muscle activations, which is equivalent to maximizing muscle endurance. The unique features of this model are the detailed anatomy of the rib cage, including the associated musculature, and the ability to compute thoracic as well as lumbar vertebral loading. Moreover, the ribs can move relative to the thoracic vertebral bodies in a realistic fashion via the costovertebral pin joints, and the thoracic and lumbar vertebral bodies can move relative to each other via intervertebral ball joints, allowing for realistic spine motion. The costal cartilages connecting the ribs to the sternum are modeled as actuators that can provide a tensile or compressive force along their length. These connections, along with the costovertebral joints and the intercostal muscles, facilitate load sharing amongst the skeletal structures comprising the thorax. Overall, our model's predictions of vertebral loading and trunk muscle tension were well correlated with measurements of IDP, loading from telemeterized implants, and trunk muscle myoelectric activity. The high correlations between model predictions and measured values imply that our model is correctly capturing the relative change in vertebral loading and muscle tension that occurs between different activities.
Our model's predictions of lumbar vertebral loading and trunk muscle tension were highly correlated (r > 0.90) to in vivo measures of IDP and myoelectric activity taken from a variety of prior studies, indicating that our model's lumbar loading estimates have an accuracy equivalent to previous models of the lumbar spine [4,48]. A major strength of the current study was our conversion of vertebral compressive force from the model to an estimated IDP using vertebral CSA and a previously published correction factor [54–56]. This conversion process allowed us to determine how accurately our model was predicting loading magnitude. The slope and intercept of the linear trend line relating measured IDP to model estimated IDP did not differ significantly from one and zero, respectively, indicating that loading magnitudes from the model were well matched to measured disk pressure magnitudes.
Vertebral compressive loading predicted by the model at L1 closely matched in vivo measurements of L1 compressive load recorded from telemeterized implants for all activities except trunk extension (Fig. 5) [51]. The range of loading measured by Rohlmann et al. for extension was lower than the model predictions (42% versus 114% standing load). However, the precise amount of trunk extension performed in the study by Rohlmann et al. was not specified, so an initial assumption of 15 deg was used in the model. In an attempt to explain the discrepancy between the model predictions and the measured data we also simulated 5 deg and 30 deg of trunk extension, which generated vertebral compressive loads of 94% and 137% standing load, respectively, indicating that positioning effects do not explain why the in vivo load was substantially lower than the model predictions. Another possible reason for the lower measured in vivo load could be due to the fact that the patients had bisegmental spinal fixators implanted posteriorly to stabilize the spine. These fixators could offload the vertebral body implant during extended postures. Further, the facet joints have been shown to transfer compressive load during trunk extension, thereby offloading the vertebral body. The model estimates total vertebral loading, and does not differentiate between the vertebral body and the facet joints, while the measurement only includes the vertebral body. This could also be a reason for why the model predicts higher vertebral loading during trunk extension than is measured in vertebral bodies. Removing extension from the correlation analysis improved the correlation coefficient between measured and model from r = 0.88 to r = 0.97. Han et al. found a similar result when comparing their model of the lumbar spine [4] to the telemeterized vertebral loads reported by Rohlmann et al. The model predictions from Han et al. matched the implant loads closely, except for extension in which they predicted 120% of standing load versus the measured value of 42% of standing load.
There was only one study that measured thoracic IDP in vivo [46], limiting our ability to fully validate the model's predictions of vertebral compressive loading in the thoracic spine. Nonetheless, thoracic vertebral loading predicted by the model generally correlated well with measured IDP from this study. In addition, thoracic erector spinae tension predicted by the model was highly correlated with measured myoelectric activity at T4. The model over-predicted thoracic IDP for a few lifting activities: 30 deg trunk flexion with weights in each hand (at the mid- and lower-thoracic spine) and standing upright with weights in each hand and elbows flexed 90 deg (at the lower thoracic spine). One possible cause for this could be the absence of intra-abdominal pressure and intrathoracic pressure from the model [4,57,58]. Prior studies have shown that both intra-abdominal pressure and intrathoracic pressure are elevated during heavy lifting and other strenuous activities [48,59], and these pressures could act to unload the thoracic and lumbar spines [58]. Although thoracic IDP was over-predicted by the model for these heavy lifting activities, lumbar IDP was not. In the future, the mechanical effects of intra-abdominal pressure and intrathoracic pressure should be incorporated into the model to clarify their effects on both lumbar and thoracic spine loading.
Other mechanical factors that might influence thoracic spine loads in vivo include the stiffness of the intervertebral joint and the bending stiffness of the costal cartilage, both of which could act to change the forces and moments applied to the spine. These factors were not included in the present version of the model due to limited experimental data on the value of these properties. For instance, most in vitro studies measuring intervertebral joint stiffness have focused on only a few lumbar spinal levels. Future experimental studies measuring costal cartilage stiffness and intervertebral joint stiffness at multiple thoracic and lumbar levels is an important area of future work, as well as developing methods to incorporate these factors into musculoskeletal models.
A final source of potential error in the model's thoracic load predictions could be the pattern of intercostal muscle activation. Although the role of the external and internal intercostals is well documented during ventilation [40,60], the extent to which these muscles activate during daily activities and lifting is less clear. McGill and Sharratt demonstrated significant myoelectric activity of the intercostal muscles for a few activities, including a squat lift of between 72 and 91 kg [61], providing evidence that the intercostals activate during daily activities, especially strenuous ones. Higher intercostal activation and tension could change the stiffness and load-sharing characteristics of the thorax, either increasing or decreasing the amount of load carried by the thoracic vertebrae. The current model, combined with measurements of intercostal myoelectric activity during daily activities, could be used in the future to elucidate the important nonventilation related roles of this muscle group.
A major strength of the current study was the use of in vivo muscle morphology measurements to adjust the CSA and position of several major trunk muscle groups in the model. Prior models have typically relied on detailed cadaver dissection to account for a muscle group's individual fascicles and many attachments. For instance, the erector spinae muscle group in the opensim lumbar spine model [2], which was incorporated into the current study's model, consists of 76 individual fascicles based on the detailed dissections of Bogduk et al. [11,62]. However, the data from cadaver dissection is derived from a small, heterogeneous sample and may not be representative of a broader population. Moreover, our base musculoskeletal model was derived by combining several existing models and adding new muscle fascicles, and it was not clear whether this process would lead to a physiologically accurate and broadly representative model. Indeed, prior to adjustment, the CSA and AP and ML moment arms of the erector spinae were more than two standard deviations smaller than the averages from our measured CT cohort. After adjustment, the CSA and AP and ML moment arms in the model matched the measured data very closely (Fig. 3 and Table 2). In the future, medical imaging data from other regions (i.e., shoulder, upper thoracic, and cervical spines) could be used to adjust the CSA and position of muscles in these other areas to further enhance the biofidelity of the model. Moreover, this method of adjusting a musculoskeletal model to match in vivo muscle morphology measurements can be used to tailor a model to a specific research question or to an individual person. For instance, the study of vertebral fracture etiology requires a model representative of an older adult population. Other factors that vary between individuals and likely influence in vivo loads, such as spine curvature [63–65] and rib cage size and shape [17,66,67], can also easily be incorporated in future versions of the model to provide an even better subject-specific model.
In conclusion, we used opensim to develop an anatomically detailed, fully articulated model of the thoracic and lumbar spine that includes the individual ribs, sternum, and associated musculature. We also created a unique approach for adjusting the size and position of muscle fascicles in this model using in vivo CT measurements of muscle morphology. Comparison of vertebral loading and muscle activation predictions to multiple prior reports of in vivo IDP, vertebral implant loads, and myoelectric activity demonstrated that the model accurately predicts vertebral compressive loading and trunk muscle tension for a variety of activities. Altogether, this new thoracolumbar spine model will be useful for future studies aimed at understanding the biomechanical pathology of various thoracic conditions, such as vertebral fracture and thoracic back pain.
Supplementary Material
Acknowledgment
This work was supported by grants from the National Institutes of Health (R01AR053986, F31AG041629, and K99AG042458), and by the National Heart, Lung, and Blood Institute (NHLBI) Framingham Heart Study (NIH/NHLBI Contract No. N01-HC-25195).
Contributor Information
Alexander G. Bruno, Harvard-MIT Health Sciences and , Technology Program, , Massachusetts Institute of Technology, , Cambridge, MA 02139; Center for Advanced Orthopaedic Studies, , Beth Israel Deaconess Medical Center, , 330 Brookline Ave., RN121, , Boston, MA 02215 , e-mail: agbruno@mit.edu.
Mary L. Bouxsein, Harvard-MIT Health Sciences and , Technology Program, , Massachusetts Institute of Technology, , Cambridge, MA 02139 Center for Advanced Orthopaedic Studies, , Beth Israel Deaconess Medical Center, , 330 Brookline Ave., , Boston, MA 02215; Department of Orthopedic Surgery, , Harvard Medical School, , Boston, MA 02115 , e-mail: mbouxsei@bidmc.harvard.edu.
Dennis E. Anderson, Mem. ASME , Center for Advanced Orthopaedic Studies, , Beth Israel Deaconess Medical Center, , 330 Brookline Ave., , Boston, MA 02215 Department of Orthopedic Surgery, , Harvard Medical School, , Boston, MA 02115 , e-mail: danders7@bidmc.harvard.edu.
Nomenclature
- CSAadjusted_fas =
adjusted cross-sectional area of a fascicle in the model
- CSAmeasured_gr =
average cross-sectional area of a muscle group from CT measurements
- CSAmodel_fas =
pre-adjusted cross-sectional area of a fascicle in the model
- CSAmodel_gr =
pre-adjusted cross-sectional area of a muscle group in the model
- CSAVert =
cross-sectional area of the vertebral body
- FC =
compressive load in the axial direction of the vertebral body
- IDPmodel =
intradiscal pressure estimated from the model
- L =
vertebral levels where a muscle group was measured on CT
References
- [1]. Delp, S. L. , Anderson, F. C. , Arnold, A. S. , Loan, P. , Habib, A. , John, C. T. , Guendelman, E. , and Thelen, D. G. , 2007, “OpenSim: Open-Source Software to Create and Analyze Dynamic Simulations of Movement,” IEEE Trans. Biomed. Eng., 54(11), pp. 1940–1950. 10.1109/TBME.2007.901024 [DOI] [PubMed] [Google Scholar]
- [2]. Christophy, M. , Faruk Senan, N. A. , Lotz, J. C. , and O'Reilly, O. M. , 2012, “A Musculoskeletal Model for the Lumbar Spine,” Biomech. Model. Mechanobiol., 11(1–2), pp. 19–34. 10.1007/s10237-011-0290-6 [DOI] [PubMed] [Google Scholar]
- [3]. Briggs, A. M. , van Dieën, J. H. , Wrigley, T. V. , Greig, A. M. , Phillips, B. , Lo, S. K. , and Bennell, K. L. , 2007, “Thoracic Kyphosis Affects Spinal Loads and Trunk Muscle Force,” Phys. Ther., 87(5), pp. 595–607. 10.2522/ptj.20060119 [DOI] [PubMed] [Google Scholar]
- [4]. Han, K. S. , Zander, T. , Taylor, W. R. , and Rohlmann, A. , 2012, “An Enhanced and Validated Generic Thoraco-Lumbar Spine Model for Prediction of Muscle Forces,” Med. Eng. Phys., 34(6), pp. 709–716. 10.1016/j.medengphy.2011.09.014 [DOI] [PubMed] [Google Scholar]
- [5]. Keller, T. S. , Colloca, C. J. , Harrison, D. E. , Harrison, D. D. , and Janik, T. J. , 2005, “Influence of Spine Morphology on Intervertebral Disc Loads and Stresses in Asymptomatic Adults: Implications for the Ideal Spine,” Spine J., 5(3), pp. 297–309. 10.1016/j.spinee.2004.10.050 [DOI] [PubMed] [Google Scholar]
- [6]. Iyer, S. , Christiansen, B. A. , Roberts, B. J. , Valentine, M. J. , Manoharan, R. K. , and Bouxsein, M. L. , 2010, “A Biomechanical Model for Estimating Loads on Thoracic and Lumbar Vertebrae,” Clin. Biomech. (Bristol, Avon), 25(9), pp. 853–858. 10.1016/j.clinbiomech.2010.06.010 [DOI] [PMC free article] [PubMed] [Google Scholar]
- [7]. Briggs, A. , Wrigley, T. , van Dieën, J. , Phillips, B. , Lo, S. , Greig, A. , and Bennell, K. , 2006, “The Effect of Osteoporotic Vertebral Fracture on Predicted Spinal Loads In Vivo,” Eur. Spine J., 15(12), pp. 1785–1795. 10.1007/s00586-006-0158-0 [DOI] [PubMed] [Google Scholar]
- [8]. Harrison, D. E. , Colloca, C. J. , Harrison, D. D. , Janik, T. J. , Haas, J. W. , and Keller, T. S. , 2005, “Anterior Thoracic Posture Increases Thoracolumbar Disc Loading,” Eur. Spine J., 14(3), pp. 234–242. 10.1007/s00586-004-0734-0 [DOI] [PMC free article] [PubMed] [Google Scholar]
- [9]. Keller, T. S. , Harrison, D. E. , Colloca, C. J. , Harrison, D. D. , and Janik, T. J. , 2003, “Prediction of Osteoporotic Spinal Deformity,” Spine, 28(5), pp. 455–462. 10.1097/01.BRS.0000048651.92777.30 [DOI] [PubMed] [Google Scholar]
- [10]. Murakami, D. , Kobayashi, S. , Torigaki, T. , and Kent, R. , 2006, “Finite Element Analysis of Hard and Soft Tissue Contributions to Thoracic Response: Sensitivity Analysis of Fluctuations in Boundary Conditions,” Stapp Car Crash J., 50, pp. 169–189. [DOI] [PubMed] [Google Scholar]
- [11]. Bogduk, N. , Macintosh, J. E. , and Pearcy, M. J. , 1992, “A Universal Model of the Lumbar Back Muscles in the Upright Position,” Spine, 17(8), pp. 897–913. 10.1097/00007632-199208000-00007 [DOI] [PubMed] [Google Scholar]
- [12]. Kamibayashi, L. K. , and Richmond, F. J. , 1998, “Morphometry of Human Neck Muscles,” Spine, 23(12), pp. 1314–1323. 10.1097/00007632-199806150-00005 [DOI] [PubMed] [Google Scholar]
- [13]. Vasavada, A. N. , Li, S. , and Delp, S. L. , 1998, “Influence of Muscle Morphometry and Moment Arms on the Moment-Generating Capacity of Human Neck Muscles,” Spine, 23(4), pp. 412–422. 10.1097/00007632-199802150-00002 [DOI] [PubMed] [Google Scholar]
- [14]. Narici, M. , 1999, “Human Skeletal Muscle Architecture Studied In Vivo by Non-Invasive Imaging Techniques: Functional Significance and Applications,” J. Electromyography Kinesiology, 9(2), pp. 97–103. 10.1016/S1050-6411(98)00041-8 [DOI] [PubMed] [Google Scholar]
- [15]. Bernhardt, M. , and Bridwell, K. H. , 1989, “Segmental Analysis of the Sagittal Plane Alignment of the Normal Thoracic and Lumbar Spines and Thoracolumbar Junction,” Spine, 14(7), pp. 717–721. 10.1097/00007632-198907000-00012 [DOI] [PubMed] [Google Scholar]
- [16]. Kuntz, C. , Levin, L. S. , Ondra, S. L. , Shaffrey, C. I. , and Morgan, C. J. , 2007, “Neutral Upright Sagittal Spinal Alignment From the Occiput to the Pelvis in Asymptomatic Adults: A Review and Resynthesis of the Literature,” J. Neurosurg.: Spine, 6(2), pp. 104–112. 10.3171/spi.2007.6.2.104 [DOI] [PubMed] [Google Scholar]
- [17]. Gayzik, F. S. , Yu, M. M. , Danelson, K. A. , Slice, D. E. , and Stitzel, J. D. , 2008, “Quantification of Age-Related Shape Change of the Human Rib Cage Through Geometric Morphometrics,” J. Biomech., 41(7), pp. 1545–1554. 10.1016/j.jbiomech.2008.02.006 [DOI] [PubMed] [Google Scholar]
- [18]. Holzbaur, K. R. , Murray, W. M. , and Delp, S. L. , 2005, “A Model of the Upper Extremity for Simulating Musculoskeletal Surgery and Analyzing Neuromuscular Control,” Ann. Biomed. Eng., 33(6), pp. 829–840. 10.1007/s10439-005-3320-7 [DOI] [PubMed] [Google Scholar]
- [19]. Tafazzol, A. , Arjmand, N. , Shirazi-Adl, A. , and Parnianpour, M. , 2014, “Lumbopelvic Rhythm During Forward and Backward Sagittal Trunk Rotations: Combined In Vivo Measurement With Inertial Tracking Device and Biomechanical Modeling,” Clin. Biomech., 29(1), pp. 7–13. 10.1016/j.clinbiomech.2013.10.021 [DOI] [PubMed] [Google Scholar]
- [20]. White, A. A., 3rd , and Panjabi, M. M. , 1978, “The Basic Kinematics of the Human Spine. A Review of Past and Current Knowledge,” Spine, 3(1), pp. 12–20. 10.1097/00007632-197803000-00003 [DOI] [PubMed] [Google Scholar]
- [21]. Wong, K. W. , Luk, K. D. , Leong, J. C. , Wong, S. F. , and Wong, K. K. , 2006, “Continuous Dynamic Spinal Motion Analysis,” Spine, 31(4), pp. 414–419. 10.1097/01.brs.0000199955.87517.82 [DOI] [PubMed] [Google Scholar]
- [22]. Fujimori, T. , Iwasaki, M. , Nagamoto, Y. , Matsuo, Y. , Ishii, T. , Sugiura, T. , Kashii, M. , Murase, T. , Sugamoto, K. , and Yoshikawa, H. , 2013, “Kinematics of the Thoracic Spine in Trunk Lateral Bending: In Vivo Three-Dimensional Analysis,” Spine J., 14(9), pp. 1991–1999. 10.1016/j.spinee.2013.11.054 [DOI] [PubMed] [Google Scholar]
- [23]. Rozumalski, A. , Schwartz, M. H. , Wervey, R. , Swanson, A. , Dykes, D. C. , and Novacheck, T. , 2008, “The In Vivo Three-Dimensional Motion of the Human Lumbar Spine During Gait,” Gait Posture, 28(3), pp. 378–384. 10.1016/j.gaitpost.2008.05.005 [DOI] [PubMed] [Google Scholar]
- [24]. Fujii, R. , Sakaura, H. , Mukai, Y. , Hosono, N. , Ishii, T. , Iwasaki, M. , Yoshikawa, H. , and Sugamoto, K. , 2007, “Kinematics of the Lumbar Spine in Trunk Rotation: In Vivo Three-Dimensional Analysis Using Magnetic Resonance Imaging,” Eur. Spine J., 16(11), pp. 1867–1874. 10.1007/s00586-007-0373-3 [DOI] [PMC free article] [PubMed] [Google Scholar]
- [25]. Fujimori, T. , Iwasaki, M. , Nagamoto, Y. , Ishii, T. , Kashii, M. , Murase, T. , Sugiura, T. , Matsuo, Y. , Sugamoto, K. , and Yoshikawa, H. , 2012, “Kinematics of the Thoracic Spine in Trunk Rotation: In Vivo 3-Dimensional Analysis,” Spine, 37(21), pp. E1318–E1328. 10.1097/BRS.0b013e318267254b [DOI] [PubMed] [Google Scholar]
- [26]. Duprey, S. , Subit, D. , Guillemot, H. , and Kent, R. W. , 2010, “Biomechanical Properties of the Costovertebral Joint,” Med. Eng. Phys., 32(2), pp. 222–227. 10.1016/j.medengphy.2009.12.001 [DOI] [PubMed] [Google Scholar]
- [27]. Lemosse, D. , Le Rue, O. , Diop, A. , Skalli, W. , Marec, P. , and Lavaste, F. , 1998, “Characterization of the Mechanical Behaviour Parameters of the Costo-Vertebral Joint,” Eur. Spine J., 7(1), pp. 16–23. 10.1007/s005860050021 [DOI] [PMC free article] [PubMed] [Google Scholar]
- [28]. Wilson, T. A. , Rehder, K. , Krayer, S. , Hoffman, E. A. , Whitney, C. G. , and Rodarte, J. R. , 1987, “Geometry and Respiratory Displacement of Human Ribs,” J. Appl. Physiol. (1985), 62(5), pp. 1872–1877. [DOI] [PubMed] [Google Scholar]
- [29]. Andriacchi, T. , Schultz, A. , Belytschko, T. , and Galante, J. , 1974, “A Model for Studies of Mechanical Interactions Between the Human Spine and Rib Cage,” J. Biomech., 7(6), pp. 497–507. 10.1016/0021-9290(74)90084-0 [DOI] [PubMed] [Google Scholar]
- [30]. Schultz, A. B. , Benson, D. R. , and Hirsch, C. , 1974, “Force-Deformation Properties of Human Costo-Sternal and Costo-Vertebral Articulations,” J. Biomech., 7(3), pp. 311–318. 10.1016/0021-9290(74)90024-4 [DOI] [PubMed] [Google Scholar]
- [31]. de Leva, P. , 1996, “Adjustments to Zatsiorsky–Seluyanov's Segment Inertia Parameters,” J. Biomech., 29(9), pp. 1223–1230. 10.1016/0021-9290(95)00178-6 [DOI] [PubMed] [Google Scholar]
- [32]. Liu, Y. K. , Laborde, J. M. , and Van Buskirk, W. C. , 1971, “Inertial Properties of a Segmented Cadaver Trunk: Their Implications in Acceleration Injuries.,” Aerosp. Med., 42(6), pp. 650–657. [PubMed] [Google Scholar]
- [33]. Pearsall, D. , Reid, J. , and Livingston, L. , 1996, “Segmental Inertial Parameters of the Human Trunk as Determined From Computed Tomography,” Ann. Biomed. Eng., 24(2), pp. 198–210. 10.1007/BF02667349 [DOI] [PubMed] [Google Scholar]
- [34]. Stokes, I. A. , and Gardner-Morse, M. , 1999, “Quantitative Anatomy of the Lumbar Musculature,” J. Biomech., 32(3), pp. 311–316. 10.1016/S0021-9290(98)00164-X [DOI] [PubMed] [Google Scholar]
- [35]. Garner, B. A. , and Pandy, M. G. , 2001, “Musculoskeletal Model of the Upper Limb Based on the Visible Human Male Dataset,” Comput. Methods Biomech. Biomed. Eng., 4(2), pp. 93–126. 10.1080/10255840008908000 [DOI] [PubMed] [Google Scholar]
- [36]. Garner, B. A. , and Pandy, M. G. , 2003, “Estimation of Musculotendon Properties in the Human Upper Limb,” Ann. Biomed. Eng., 31(2), pp. 207–220. 10.1114/1.1540105 [DOI] [PubMed] [Google Scholar]
- [37]. Brown, S. H. , Ward, S. R. , Cook, M. S. , and Lieber, R. L. , 2011, “Architectural Analysis of Human Abdominal Wall Muscles: Implications for Mechanical Function,” Spine, 36(5), pp. 355–362. 10.1097/BRS.0b013e3181d12ed7 [DOI] [PMC free article] [PubMed] [Google Scholar]
- [38]. Thelen, D. G. , 2003, “Adjustment of Muscle Mechanics Model Parameters to Simulate Dynamic Contractions in Older Adults,” ASME J. Biomech. Eng., 125(1), pp. 70–77. 10.1115/1.1531112 [DOI] [PubMed] [Google Scholar]
- [39]. Saumarez, R. C. , 1986, “An Analysis of Action of Intercostal Muscles in Human Upper Rib Cage,” J. Appl. Physiol., 60(2), pp. 690–701. [DOI] [PubMed] [Google Scholar]
- [40]. Wilson, T. A. , Legrand, A. , Gevenois, P. A. , and De Troyer, A. , 2001, “Respiratory Effects of the External and Internal Intercostal Muscles in Humans,” J. Physiol., 530(Pt 2), pp. 319–330. 10.1111/j.1469-7793.2001.0319l.x [DOI] [PMC free article] [PubMed] [Google Scholar]
- [41]. Hoffmann, U. , Massaro, J. M. , Fox, C. S. , Manders, E. , and O'Donnell, C. J. , 2008, “Defining Normal Distributions of Coronary Artery Calcium in Women and Men (From the Framingham Heart Study),” Am. J. Cardiol., 102(9), pp. 1136–1141. 10.1016/j.amjcard.2008.06.038 [DOI] [PMC free article] [PubMed] [Google Scholar]
- [42]. Anderson, D. E. , D'Agostino, J. , Bruno, A. G. , Manoharan, R. K. , and Bouxsein, M. L. , 2012, “Regressions for Estimating Muscle Parameters in the Thoracic and Lumbar Trunk for Use in Musculoskeletal Modeling,” J. Biomech., 45(1), pp. 66–75. 10.1016/j.jbiomech.2011.10.004 [DOI] [PMC free article] [PubMed] [Google Scholar]
- [43]. Narici, M. V. , Roi, G. S. , and Landoni, L. , 1988, “Force of Knee Extensor and Flexor Muscles and Cross-Sectional Area Determined by Nuclear Magnetic Resonance Imaging,” Eur. J. Appl. Physiol. Occup. Physiol., 57(1), pp. 39–44. 10.1007/BF00691235 [DOI] [PubMed] [Google Scholar]
- [44]. Pearcy, M. J. , and Bogduk, N. , 1988, “Instantaneous Axes of Rotation of the Lumbar Intervertebral Joints,” Spine, 13(9), pp. 1033–1041. 10.1097/00007632-198809000-00011 [DOI] [PubMed] [Google Scholar]
- [45]. Andersson, G. B. , Ortengren, R. , and Nachemson, A. , 1977, “Intradiskal Pressure, Intra-Abdominal Pressure and Myoelectric Back Muscle Activity Related to Posture and Loading,” Clin. Orthop. Relat. Res., 129, pp. 156–164. 10.1097/00003086-197711000-00018 [DOI] [PubMed] [Google Scholar]
- [46]. Polga, D. J. , Beaubien, B. P. , Kallemeier, P. M. , Schellhas, K. P. , Lew, W. D. , Buttermann, G. R. , and Wood, K. B. , 2004, “Measurement of In Vivo Intradiscal Pressure in Healthy Thoracic Intervertebral Discs,” Spine, 29(12), pp. 1320–1324. 10.1097/01.BRS.0000127179.13271.78 [DOI] [PubMed] [Google Scholar]
- [47]. Sato, K. , Kikuchi, S. , and Yonezawa, T. , 1999, “In Vivo Intradiscal Pressure Measurement in Healthy Individuals and in Patients With Ongoing Back Problems,” Spine, 24(23), pp. 2468–2474. 10.1097/00007632-199912010-00008 [DOI] [PubMed] [Google Scholar]
- [48]. Schultz, A. , Andersson, G. , Ortengren, R. , Haderspeck, K. , and Nachemson, A. , 1982, “Loads on the Lumbar Spine. Validation of a Biomechanical Analysis by Measurements of Intradiscal Pressures and Myoelectric Signals,” J. Bone Jt. Surg., 64(5), pp. 713–720. [PubMed] [Google Scholar]
- [49]. Takahashi, I. , Kikuchi, S. , Sato, K. , and Sato, N. , 2006, “Mechanical Load of the Lumbar Spine During Forward Bending Motion of the Trunk—A Biomechanical Study,” Spine, 31(1), pp. 18–23. 10.1097/01.brs.0000192636.69129.fb [DOI] [PubMed] [Google Scholar]
- [50]. Wilke, H.-J. , Neef, P. , Hinz, B. , Seidel, H. , and Claes, L. , 2001, “Intradiscal Pressure Together With Anthropometric Data—A Data Set for the Validation of Models,” Clin. Biomech., 16(Suppl. 1), pp. S111–S126. 10.1016/S0268-0033(00)00103-0 [DOI] [PubMed] [Google Scholar]
- [51]. Rohlmann, A. , Graichen, F. , Kayser, R. , Bender, A. , and Bergmann, G. , 2008, “Loads on a Telemeterized Vertebral Body Replacement Measured in Two Patients,” Spine, 33(11), pp. 1170–1179. 10.1097/BRS.0b013e3181722d52 [DOI] [PubMed] [Google Scholar]
- [52]. Crowninshield, R. D. , and Brand, R. A. , 1981, “A Physiologically Based Criterion of Muscle Force Prediction in Locomotion,” J. Biomech., 14(11), pp. 793–801. 10.1016/0021-9290(81)90035-X [DOI] [PubMed] [Google Scholar]
- [53]. Hughes, R. E. , 2000, “Effect of Optimization Criterion on Spinal Force Estimates During Asymmetric Lifting,” J. Biomech., 33(2), pp. 225–229. 10.1016/S0021-9290(99)00153-0 [DOI] [PubMed] [Google Scholar]
- [54]. Dreischarf, M. , Rohlmann, A. , Zhu, R. , Schmidt, H. , and Zander, T. , 2013, “Is it Possible to Estimate the Compressive Force in the Lumbar Spine From Intradiscal Pressure Measurements? A Finite Element Evaluation,” Med. Eng. Phys., 35(9), pp. 1385–1390. 10.1016/j.medengphy.2013.03.007 [DOI] [PubMed] [Google Scholar]
- [55]. Nachemson, A. , 1960, “Lumbar Intradiscal Pressure: Experimental Studies on Post-Mortem Material,” Acta Orthop. Scand. Suppl., 43, pp. 1–104. 10.3109/ort.1960.31.suppl-43.01 [DOI] [PubMed] [Google Scholar]
- [56]. Nachemson, A. , 1966, “The Load on Lumbar Disks in Different Positions of the Body,” Clin. Orthop. Relat. Res., 45, pp. 107–122. [PubMed] [Google Scholar]
- [57]. de Zee, M. , Hansen, L. , Wong, C. , Rasmussen, J. , and Simonsen, E. B. , 2007, “A Generic Detailed Rigid-Body Lumbar Spine Model,” J. Biomech., 40(6), pp. 1219–1227. 10.1016/j.jbiomech.2006.05.030 [DOI] [PubMed] [Google Scholar]
- [58]. Stokes, I. A. , Gardner-Morse, M. G. , and Henry, S. M. , 2010, “Intra-Abdominal Pressure and Abdominal Wall Muscular Function: Spinal Unloading Mechanism,” Clin. Biomech. (Bristol, Avon), 25(9), pp. 859–866. 10.1016/j.clinbiomech.2010.06.018 [DOI] [PMC free article] [PubMed] [Google Scholar]
- [59]. Cholewicki, J. , Ivancic, P. C. , and Radebold, A. , 2002, “Can Increased Intra-Abdominal Pressure in Humans Be Decoupled From Trunk Muscle Co-Contraction During Steady State Isometric Exertions?,” Eur. J. Appl. Physiol., 87(2), pp. 127–133. 10.1007/s00421-002-0598-0 [DOI] [PubMed] [Google Scholar]
- [60]. De Troyer, A. , and Boriek, A. M. , 2011, “Mechanics of the Respiratory Muscles,” Compr. Physiol., 1(3), pp. 1273–1300. [DOI] [PubMed] [Google Scholar]
- [61]. McGill, S. M. , and Sharratt, M. T. , 1990, “Relationship Between Intra-Abdominal Pressure and Trunk EMG,” Clin. Biomech., 5(2), pp. 59–67. 10.1016/0268-0033(90)90039-9 [DOI] [PubMed] [Google Scholar]
- [62]. Macintosh, J. E. , and Bogduk, N. , 1991, “The Attachments of the Lumbar Erector Spinae,” Spine, 16(7), pp. 783–792. 10.1097/00007632-199107000-00017 [DOI] [PubMed] [Google Scholar]
- [63]. Boyle, J. J. , Milne, N. , and Singer, K. P. , 2002, “Influence of Age on Cervicothoracic Spinal Curvature: An Ex Vivo Radiographic Survey,” Clin. Biomech. (Bristol, Avon), 17(5), pp. 361–367. 10.1016/S0268-0033(02)00030-X [DOI] [PubMed] [Google Scholar]
- [64]. Bruno, A. G. , Anderson, D. E. , D'Agostino, J. , and Bouxsein, M. L. , 2012, “The Effect of Thoracic Kyphosis and Sagittal Plane Alignment on Vertebral Compressive Loading,” J. Bone Miner. Res., 27(10), pp. 2144–2151. 10.1002/jbmr.1658 [DOI] [PMC free article] [PubMed] [Google Scholar]
- [65]. Manns, R. A. , Haddaway, M. J. , McCall, I. W. , Cassar Pullicino, V. , and Davie, M. W. J. , 1996, “The Relative Contribution of Disc and Vertebral Morphometry to the Angle of Kyphosis in Asymptomatic Subjects,” Clin. Radiol., 51(4), pp. 258–262. 10.1016/S0009-9260(96)80342-4 [DOI] [PubMed] [Google Scholar]
- [66]. Shi, X. , Cao, L. , Reed, M. P. , Rupp, J. D. , Hoff, C. N. , and Hu, J. , 2014, “A Statistical Human Rib Cage Geometry Model Accounting for Variations by Age, Sex, Stature and Body Mass Index,” J. Biomech., 47(10), pp. 2277–2285. 10.1016/j.jbiomech.2014.04.045 [DOI] [PubMed] [Google Scholar]
- [67]. Weaver, A. A. , Schoell, S. L. , and Stitzel, J. D. , 2014, “Morphometric Analysis of Variation in the Ribs With Age and Sex,” J. Anat., 225(2), pp. 246–261. 10.1111/joa.12203 [DOI] [PMC free article] [PubMed] [Google Scholar]
Associated Data
This section collects any data citations, data availability statements, or supplementary materials included in this article.