

SUMMARY
Studies of locomotion in mice suggest that circuits controlling the alternating between left and right limbs may have a modular organization with distinct locomotor circuits being recruited at different speeds. It is not clear, however, whether such a modular organization reflects specific behavioral outcomes expressed at different speeds of locomotion. Here, we use detailed kinematic analyses to search for signatures of a modular organization of locomotor circuits in intact and genetically modified mice moving at different speeds of locomotion. We show that wild-type mice display three distinct gaits: two alternating, walk and trot, and one synchronous, bound. Each gait is expressed in distinct ranges of speed with phenotypic inter-limb and intra-limb coordination. A fourth gait, gallop, closely resembled bound in most of the locomotor parameters but expressed diverse inter-limb coordination. Genetic ablation of commissural V0V neurons completely removed the expression of one alternating gait, trot, but left intact walk, gallop, and bound. Ablation of commissural V0V and V0D neurons led to a loss of walk, trot, and gallop, leaving bound as the default gait. Our study provides a benchmark for studies of the neuronal control of locomotion in the full range of speeds. It provides evidence that gait expression depends upon selection of different modules of neuronal ensembles.
INTRODUCTION
Locomotion is an essential behavior needed for animals and humans to interact with the environment. An important aspect of locomotion is the ability to regulate the speed. In non-limbed locomotion, changes in speed are signaled by changes in undulatory frequencies and amplitudes of the motor outputs. In limbed locomotion, the coordination of muscle activity is more complex and changes in locomotor speed may additionally involve changes in coordination between limbs, generating specific patterns of limb movements, or gaits. For vertebrates, the control of locomotor movements is to a large degree accomplished by activity in neuronal networks, or central pattern generators (CPGs), localized in the spinal cord.
An emergent principle from studies of vertebrate locomotion is that the CPG has a modular composition with different neuronal circuits recruited at different speeds of locomotion. In zebrafish, changes in speed may reflect the recruitment of distinct premotor neuron pathways in the spinal cord, regulating frequency and amplitude of the motor output [1–3]. Locomotor studies in transgenic mice have shown that left-right alternation at all speeds completely depends on the presence of V0 commissural interneurons, which have axons crossing in the midline and are genetically characterized by the early expression of the transcription factor Dbx1 [4]. In the absence of these neurons, mice can only perform a “quadrupedal hopping”. V0 neurons can be subdivided into inhibitory V0D neurons and excitatory V0V neurons. Studies in the isolated spinal cord show that the V0D commissural interneurons secure hindlimb alternation at low locomotor frequencies, whereas the V0V commissural interneurons maintain hindlimb alternation at high frequencies of locomotion. Excitatory ipsilaterally projecting subsets of Chx10 expressing V2a neurons are known to be critically involved in left-right alternation [5–10] particularly at high locomotor speeds [6]. These observations suggest that the left-right alternating circuits in the mammalian CPG have a modular organization with distinct locomotor circuits, recruited in a speed-dependent manner. However, it is not clear whether such a modular organization underlies specific behavioral outcomes in intact mice when mice move at different speeds.
Here, we study mice that move spontaneously at different speeds and use kinematic analyses to describe three distinct gaits, walk, trot, and bound, expressed in distinct locomotor frequencies/speeds and with distinct patterns of inter-limb and intra-limb coordination. An intermediate gait, gallop, was expressed in overlapping frequencies with trot and bound. In mice with ablated V0V neurons, alternating gait at low speeds of locomotion corresponded to walk, whereas gallop and bound were expressed at higher speeds of locomotion. Trot was absent. In mice in which all V0 neurons were deleted, bound remained the only gait that was present. Our combined findings in wild-type and mutant mice imply that modular CPG circuits govern locomotion in mice. Our study provides a benchmark for studies of the neuronal control of locomotion in wild-type mice and in transgenic mice with specific perturbations in locomotor networks as well as for mice with disease-related changes affecting locomotion.
RESULTS
Four Gaits Characterize Mouse Locomotion
To determine how mice locomote during forward over-ground locomotion, we allowed them to run on a stationary elevated runway at different speeds of locomotion. Based on the footprint patterns and kinematic analyses, we identified the presence of three distinct gaits—walk, trot, and bound—that were expressed in mostly non-overlapping ranges of locomotor speeds and a fourth intermediate gait—gallop—that was expressed in locomotor speeds overlapping with trot and bound.
Walk
Walk was defined as a pattern of limb movement where three or four feet were simultaneously in contact with the ground (Movie S1; Figure 1A) [11]. In the most common walk pattern (>60% of the total walking steps), one forelimb was lifted from the ground to initiate the movement (Figure 1A), followed by consecutive lifting of the diagonal hindlimb, the opposite (homologous) forelimb, and then the ipsilateral (homolateral) hindlimb. Two lessfrequent walking patterns were also observed and characterized by alternation of homologous limbs (Figures S1A and S1B). In the further analysis, we only compile data from the most common pattern of walk to avoid mixing the different walk patterns in the phase plots. The total walking steps were 20% of the total analyzed steps.
Figure 1. Mice Exhibit Four Gaits.
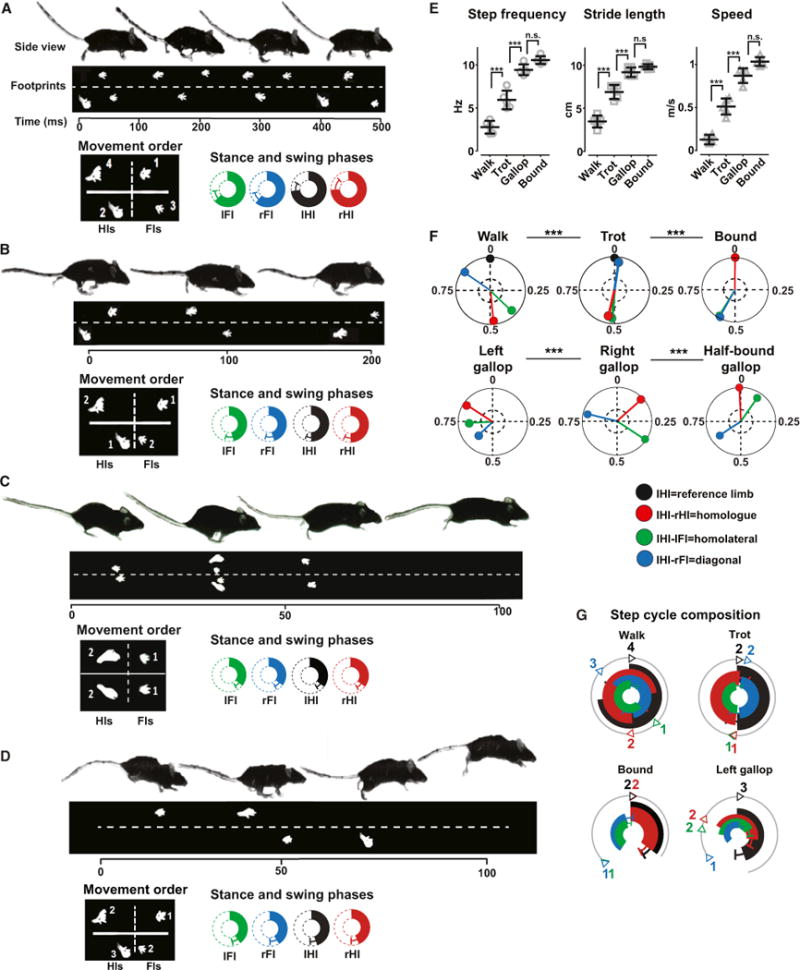
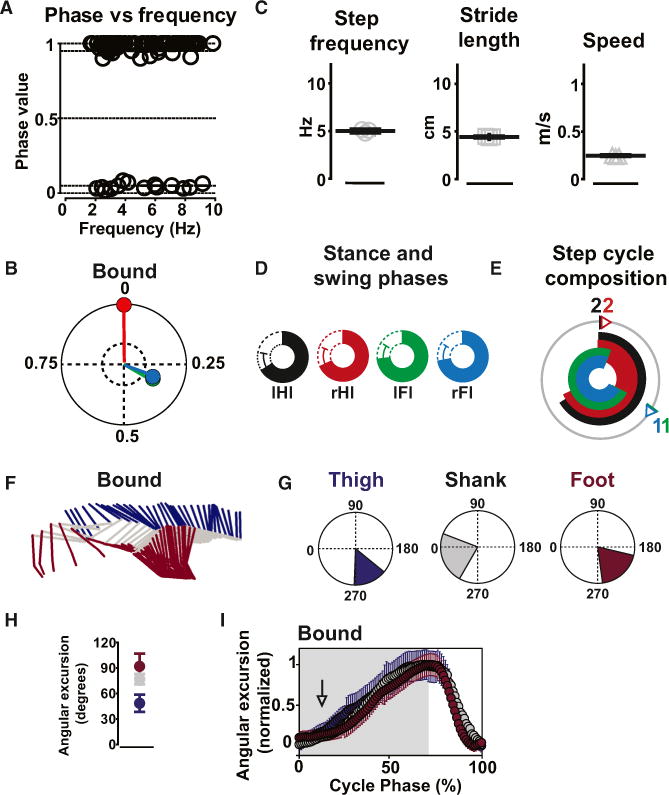
(A–D) Side views of mice showing a sequence of walk (A), trot (B), bound (C), and gallop (D) with indication of footprints of the hind- and the forelimbs below. The scale bars give time in ms. The square box in the bottom panel to the left indicates the order of the movements of the feet (Fls, forelimbs; Hls, hindlimbs). The circular plots below show the duration of the stance phase (filled bars) and swing phases (open bars), in percent of a normalized step cycle (mean ± SD). IFI, left forelimb, green; IHI, left hindlimb, black; rFI, right forelimb, blue; rHI, right hindlimb, red.
(E) Mean (±SD) step frequency (walk [Hz]: 2.7 ± 0.7; trot: 5.9 ± 1.0; gallop: 9.8 ± 0.7; bound: 10 ± 0.4), stride length (walk [cm]: 3.4 ± 0.6; trot: 6.8 ± 0.8; gallop: 9.1 ± 0.5; bound: 9.8 ± 0.2), and speed (walk [m/s]: 0.09 ± 0.05; trot: 0.51 ± 0.09; gallop: 0.91 ± 0.8; bound: 1.0 ±0.05) for walk, trot, gallop, and bound (number of steps: walk, n = 66; trot, n = 174; gallop, n = 61; bound, n = 26). The mean for individual mice (n = 5) are represented in the graph by single points in each category.
(F) Circular plots with the mean phase values between the IHI, the reference (black vector: phase value equals 0) and the right hindlimb (IHI-rHI; red vector), left forelimb (IHI-IFI; green vector), and the right forelimb (IHI-rFI; blue vector) for walk, trot, bound, and the different types of gallop. Gallop was sorted using the leading hindlimb into right and left gallop (right gallop: n = 11; left gallop: n = 40) and half-bound gallop (n = 10). Phase values of 0.5 correspond to strict alternation, whereas phase values of 0 or 1 correspond to strict synchrony. The length of the vector indicated the concentration of phase values around the mean. The dotted inner circles represent a significance level of p = 0.05. The limb coordination was significantly different during the different types of gallop (Watson and William’s test; p < 0.05).
(G) Circular bar graphs of the stance phase in normalized step cycles during walk, trot, bound, and gallop. The mean phase values (obtained from values in F) set the onsets of the stance phases, and the duration of individual stance phases are obtained from data presented in the plots in the lower panel in (A), with specific color codes for the individual legs. The circular bar graphs only show the stance phase of the individual legs. The numbers correspond to order of movements of the feet (see A and B).
See also Figure S1 and Movies S1, S2, S3, and S4.
Walk was characterized by long stance phase durations for individual limbs (about 70% of the normalized step cycle; circular bar plots in Figure 1A), a low mean step frequency (Figure 1E, left panel), a short mean stride length (Figure 1E, middle panel), and a low mean speed of locomotion (Figure 1E, right panel; see also Figure S1C).
Phase analysis of the inter-limb coordination during a step cycle showed that the homologous limbs were alternating (0.48 ± 0.03; mean phase ± SD for the forelimbs and 0.48 ± 0.07 for the hindlimbs; red vector; Figure 1F, upper left panel) and that the forelimbs always touched the ground before the corresponding diagonal hindlimbs (rFI before IHI; diagonal phase coupling of 0.84 ± 0.06; blue vector; Figure 1F, upper left panel).
The step-cycle composition during walk can be appreciated in circular bar plots (Figure 1G, upper left panel). The long stance phase of the individual legs constrained the animal to have at least three feet simultaneously on the ground.
Trot
Trot was characterized by a pattern of movement where diagonal pairs of limbs (e.g., left forelimb and right hindlimb) moved forward simultaneously and homologous pairs of limbs (e.g., hindlimbs) were in alternation (Movie S2; Figure 1B). Trot showed intermediate ranges of stance phase durations (about 50% of the normalized step cycle for all limbs; circular bar plots in Figure 1B), intermediate mean step frequency (Figure 1E), mean stride length (Figure 1E, middle panel), and mean speed of locomotion (Figure 1E, right panel) that were significantly different from walk (p < 0.01; one-way ANOVA followed by Bonferroni’s post-test). Trot was the most-common gait displayed in our experiments (53% of all steps analyzed), covering a large range of speeds (from 0.28 ± 0.08 to 0.71 ± 0.13 m/s; Figure S1C).
Synchronous activation of diagonal limbs (0.02 ± 0.1; blue vector; Figure 1F, upper middle panel), accompanied by alternation between homologous limbs (forelimbs: 0.45 ± 0.07; hindlimbs: 0.53 ± 0.08; red vector; Figure 1F, upper middle panel) and homolateral limbs (0.51 ± 0.1; green vector; Figure 1F, upper middle panel), describes the typical inter-limb coordination of trot. The coordination pattern during trot was significantly different from walk (Watson and William’s test; p < 0.001).
The plot of the step-cycle composition for the stance phases during trot highlights the lack of overlap between stance phases of homologous limbs and the specific pattern of limb coordination with two diagonal limbs simultaneously in stance phase and the others in swing phase (Figure 1G, upper right panel).
Bound
Bound was seen as a pattern of movement of the limbs where the animal moved the forelimbs and hindlimbs in synchrony throughout the movement. The animals exhibited one single phase of suspension right after the hindlimb generated push off from the ground, landing with the forelimbs in synchrony (Figure 1C). Bound never appeared in the first or second steps of a run, and it was never maintained for more than a few consecutive steps (Movie S3). Bound was found in 8% of the steps analyzed.
Bound was characterized by a significantly shorter stance phase duration (about 34% of a normalized step cycle for all limbs; Figure 1C, circular bar plots) than trot (one-way ANOVA followed by Bonferroni post-test; p < 0.001). The synchronization of the swing phase during the aerial phase allowed the animal to reach a high mean step frequency (Figure 1E, left panel), long mean stride length (Figure 1E, middle panel), and high mean speed of locomotion (Figure 1E, right panel; see also Figure S1C). These values were significantly different from trot (p < 0.001).
Synchronization of the homologous limbs (0 ± 0.02 for the forelimbs and 0 ± 0.007 for the hindlimbs; red vector; Figure 1F, upper right panel) accompanied by homolateral (0.57 ± 0.1; green vector; Figure 1F, upper right panel) and diagonal limb alternation (0.56 ± 0.05; blue vector; Figure 1F, upper right panel) characterized bound, which was significantly different from trot (Watson and Williams test; p < 0.001).
The plot of the step-cycle composition for stance and swing phase during bound shows that the short stance phase and the synchronous pattern of activation of forelimbs and hindlimbs are the conditions for the animal to have a synchronized swing phase with all limbs simultaneously in the air (Figure 1G, lower left panel).
Gallop
At medium-to-high frequencies of locomotion, mice also use a gait that was neither trot nor bound. This pattern of movement of the limbs was characterized as gallop that could be divided into three types: half-bound gallop; left gallop; and right gallop (Movie S4). In half-bound gallop, like in bound, the hindlimbs moved in synchrony (0.0 ± 0.02; mean ± SD; red vector in Figure 1F, lower right panel), whereas the forelimbs, in contrast to bound, moved out of phase (0.57 ± 0.09). Left and right gallop were characterized by a phase shift in the hindlimb synchronization. In left gallop, the left hindlimb was leading the right hindlimb (0.83 ± 0.06; mean phase ± SD; red vector in Figure 1F, lower left panel) and vice versa for right gallop (0.13 ± 0.06; red vector in Figure 1F, lower middle panel). Typically, in left gallop, the left forelimb was also leading the right forelimb (transverse gallop). Gallop was found in 19% of all measured steps.
The duration of the stance phase (about 43% in each limb; Figure 1D, circular bar plots) during gallop was slightly but significantly shorter than during trot (one-way ANOVA followed by Bonferroni’s post-test; p < 0.001) and longer than during bound (p < 0.01). The mean step frequency (Figure 1E, right panel), the mean stride length (Figure 1E, middle panel), and the mean speed (Figure 1E, left panel; see also Figure S1C) were, however, not significantly different from those observed during bound (p > 0.05). Gallop covered a speed range that was overlapping with trot and gallop (Figure S1C).
The step-cycle composition for left gallop is shown in Figure 1G (lower left panel). The sequential activation of the limbs with a substantial overlap between swing phases generated an aerial phase. Gallop was significantly different from walk, trot, and bound (Watson and William’s test; p < 0.001).
The combined analysis show that mice express three distinct gaits, two alternating ones, walk and trot, and one synchronous one, bound, that are expressed in mostly non-overlapping ranges of locomotor speeds. These three gaits show unique four-leg coordination patterns and step-cycle compositions, reflecting a gait-specific control of the inter-limb coordination. Gallop was identified as a fourth intermediate gait that was expressed in overlapping frequencies with both trot and bound. It shared similarities in many locomotor parameters with bound but deviated significantly in the four-limb coordination, especially at the forelimb level. Therefore left-right coordination during gallop appears as intermediate between trot and bound.
Gait-Specific Modifications at the Single-Limb Level
To further reveal the features of the different gaits, we extended our analysis to include kinematic analyses of flexor/extensor activity around the hip, knee, and ankle joints in individual limbs.
The stick diagrams in Figure 2A show the characteristic sequence of hindlimb movement during a single step of walk, trot, bound, and gallop (thigh, blue; shank, gray; foot, magenta). The angular excursions of the three limb segments were measured (Figure 2B) and quantified (Figure 2C) using ten steps that displayed a step frequency and a stride length equal to the mean step frequency and mean stride length measured for each gait.
Figure 2. Intra-limb Coordination during Different Gaits.
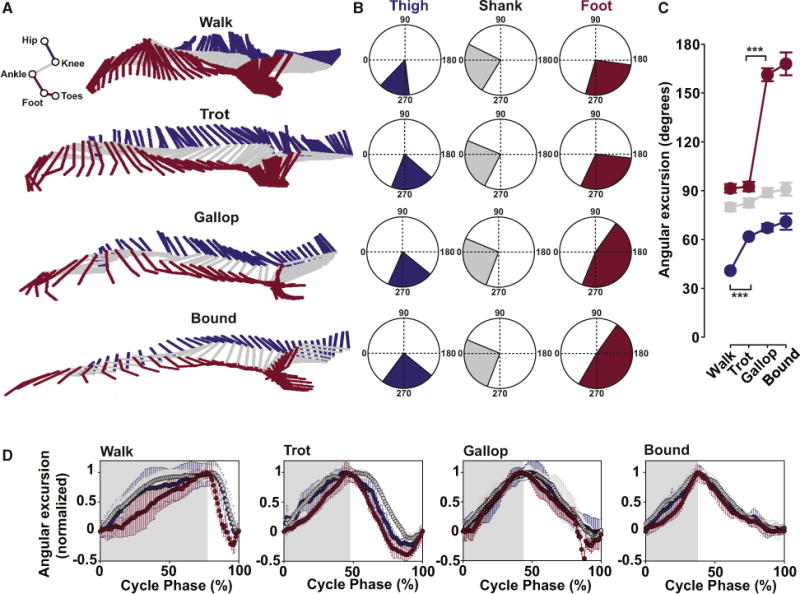
(A) Stick diagrams of the left hindlimb during a typical step during walk (top), trot (second from top), gallop (second from bottom), and bound (bottom). The thigh is violet, the shank gray, and the foot magenta.
(B) Mean ranges of angular excursions in degrees for walk, trot, gallop, and bound. Same color code for thigh, shank, and foot as in (A).
(C) Mean angular excursion (±angular deviation) of each joint in the four gaits. Note the phenotypic changes from walk to trot to gallop/bound. Data were compared using Watson and Williams’s test (***p < 0.001).
(D) Normalized angular excursions of thigh, shank, and foot for walk, trot, bound, and gallop plotted as a function of a normalized step cycle with stance indicated in gray and swing in white. The three segments are sequentially activated in the stance phase during walk, less so during trot, but not at all during gallop and bound, where a high degree of synchronous activity in both the stance and the swing phases is present (seen as an overlap between the curves).
The shank showed similar excursions in all gaits (Figure 2C, middle panels; 80° ± 2° for walk, 82° ± 3° for trot, 88° ± 3° for gallop, and 91° ± 4° for bound). The excursions of the thigh and foot showed a greater variation between the gaits. The transition from walk to trot was accompanied by a significant increase in the angular excursion of the thigh from 41° ± 1° to 62° ± 2° (left panels in Figures 2B and 2C; p < 0.001) with no significant changes in the angular excursions of the shank and the foot (middle panels in Figures 2B and 2C; p > 0.05). When the gait changed from trot to gallop, a dramatic increase in the foot displacement appeared (from 92° ± 3° during trot to 161° ± 6° during gallop; right panels in Figures 2B and 2C). Bound showed a value of angular excursion for the foot similar to gallop (168° ±15°; Figure 2C; p > 0.05).
When the angular excursions of the thigh, the shank, and the foot were plotted as a function of the stance and swing phase of a normalized step cycle during walk, trot, gallop, and bound, it became clear there was an increased synchronization of the three limb segments as the movement changed from walk to trot to gallop and bound (Figure 2D). During walk and trot, the three segments were activated sequentially during the stance and swing phases (Figure 2D). During gallop and bound, the three segments showed similar activation for the thigh, the shank, and the foot during both stance and swing phase (Figure 2D).
This analysis reveals that the walk, trot, and bound show discrete kinematic signatures of the intra-limb coordination. In contrast, bound and gallop share the same intra-limb coordination.
Gait Switches Happen Instantaneously
From the analysis of the different gaits, a drastic change in limb coordination clearly occurred when the animal switched from one gait to another. To characterize the dynamics of these switches, we performed a detailed analysis of the spontaneous gait switches during a single run. We used step-by-step analysis monitoring the steps before, during, and after the transition phase. We analyzed three specific switches: (1) switches from low to medium speeds (from walk to trot; Figure 3A), (2) switches from high to medium speeds (from gallop to trot; Figure 3B), and (3) switches with large speed change (from walk to gallop and vice versa; Figure 3C).
Figure 3. Gait Transitions Happen Instantaneously.
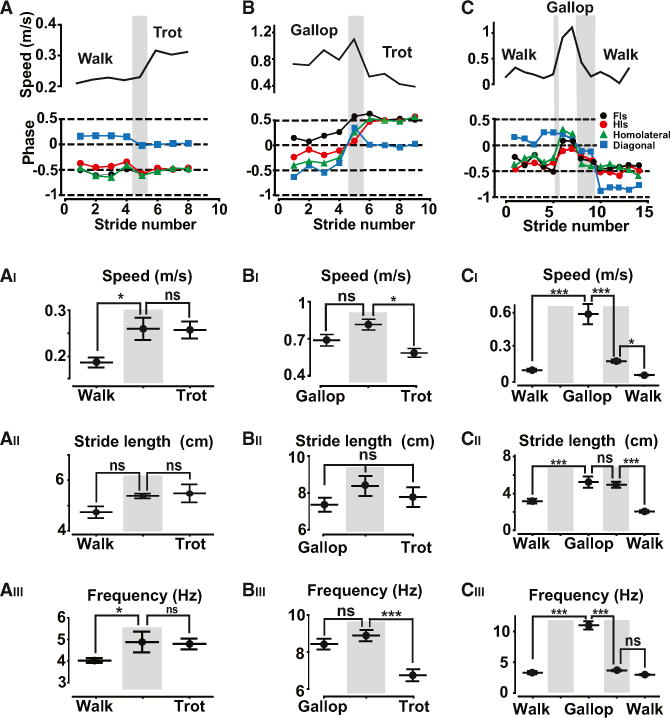
Consecutive steps showing gait switch from walk to trot (A), from gallop to trot (B), and from walk to gallop to walk (C). Each panel displays the instantaneous speed during each step (top) and the phase differences between homologous limbs (Fls, black circles; Hls, red circles), homolateral limbs (IHI-IFI: green triangles) and diagonal limbs (IHI-rFI: blue squares). In all graphs, the transition phases are indicated with a gray background. (AI–CIII) The dynamic of the gaits switches were analyzed by calculating the mean speed, the mean stride length, and the mean step frequency before, during, and after the transition phase. The switch from walk to trot (n = 14; N = 3) resulted in an increase in speed (AI) as a result of a significant increase in locomotor frequency (AIII) with retained stride length (AII). The switch from gallop to trot (n = 7; N = 3) was accompanied by a significant decrease in speed (BI) mediated by an abrupt decrease in step frequency (BIII) with no changes in stride length (BII). The switch from walk to gallop (n = 10; N = 3) was instantaneous with no transition steps signifying the abrupt increase in speed (CI), which was obtained by an significant increase in both the stride length (CII) and the frequency of locomotion (CIII). The switch from gallop to walk (n = 9; N = 3) required transition steps, and a significant decrease in speed (CI) was obtained by a decrease both in stride length (CII), and step frequency (CIII). All data show mean ± SEM and were compared using one-way ANOVA followed by Bonferroni’s post-test (*p < 0.05, **p < 0.01, and ***p < 0.001).
The switch from walk to trot happened with one intermediate step, which was neither walk nor trot. It appeared at a typical speed of locomotion (0.25 ± 0.02 m/s; Figure 3AI). A single intermediate step was also sufficient for switching from gallop to trot. The single transition step had a coordination that was neither gallop nor trot (Figure 3B) and occurred at a specific speed of locomotion (0.75 ± 0.05 m/s; Figure 3BI). Most striking was the switch from walk to gallop (Figure 3C). Inter-limb coordination directly changed from walk to gallop with no intermediate step (Figure 3C), allowing a dramatic increase in speed (from 0.1 ± 0.01 m/s to 0.58 ± 0.08 m/s; Figure 3CI). The switch from gallop to walk involved one or two intermediate steps in which the inter-limb coordination was neither gallop nor walk (Figure 3C). It always led to a severe reduction in speed (Figure 3CI).
Variations in speed were generated by a significant change in step frequency (Figures 3AII, 3BII, and 3CII). Only in the case of the largest changes of locomotor speed (as from walk to gallop) did the stride length change significantly but always after the step frequency had changed (compare Figures 3AIII, 3BIII, and 3CIII).
In summary, the switch from one gait to another was abrupt, involving one or two transition steps or even instantaneous, with no intermediate step.
Alternating Gaits Are Lost in Mice Lacking V0 Commissural Interneurons
The presence of four main gaits, walk, trot, gallop, and bound with specific locomotor parameters and inter-limb coordination, gait-dependent intra-limb coordination, and defined transition speeds, suggests a modular organization of the locomotor networks controlling the gaits. To assess this conjecture further, we applied the analysis presented here to locomotor data of a previous study of mice where excitatory V0 commissural interneurons or all V0 commissural interneurons were ablated [4].
Trot Is Selectively Lost in V0V-Ablated Mice
We analyzed locomotor data from the V0V-ablated mice (Vglut2::Cre; Dbx1-DTA mice) that were spontaneously running with locomotor frequencies from 2 to 9 or 10 Hz. Hindlimb alternation (n = 37; N = 3) was present at low locomotor frequencies (<3 Hz), and it was replaced by synchronization at higher frequencies of locomotion (n=87; N = 3; Figure 4A). When the steps were sorted into gaits based on four-limb coordination, all alternating steps in the V0V-ablated mice corresponded to walk (Figure 4B, upper left panel; Movie S5) with no sign of trot. The steps, seen at higher frequencies of locomotion, corresponded to bound (24% of the total steps; Figure 4B, upper right panel), half-bound gallop (26%; Figure 4B, lower panel), and left and right gallop (50%; Figure 4B, middle panels; Movie S6).
Figure 4. Trot Is Lost in Mice Lacking Excitatory V0V Commissural Interneurons.
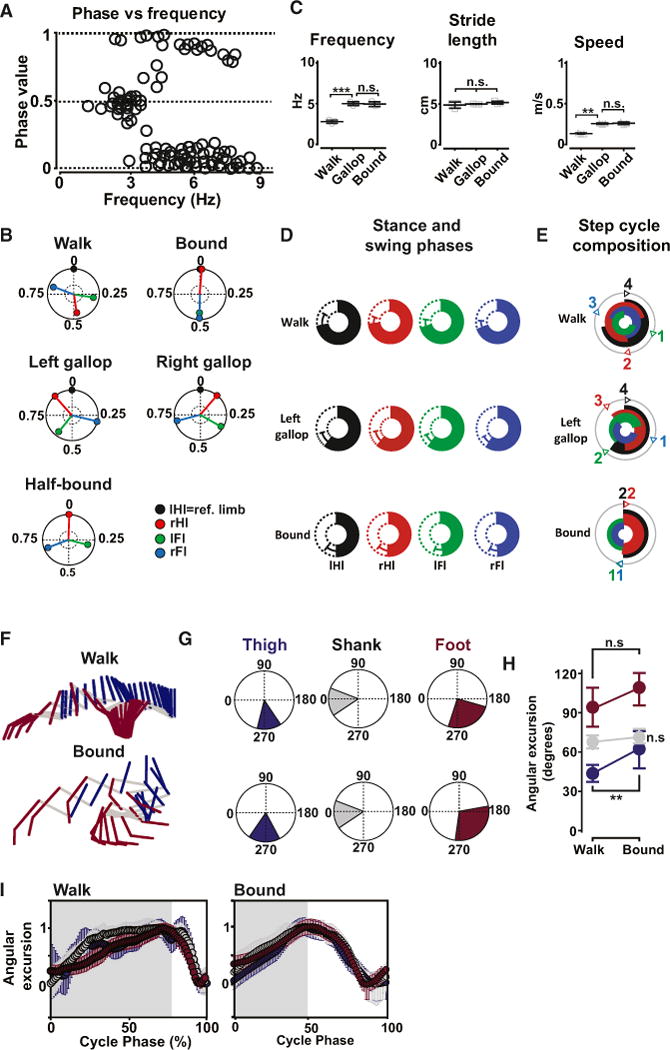
(A) V0v-ablated mice (Vglut-2::Cre; Dbx1-DTA) displayed hindlimb alternation (phase values around 0.5) at low frequencies of locomotion (n = 36; N = 3) and hindlimb synchronization (phase values around 0 or 1; n = 86; N = 3) at medium to high frequencies of locomotion.
(B) Circular plots showing phase values of the rHI (red vector), the IFI (green vector), and rFI (blue vector) with respect to the reference IHI (black vector) for steps in (A). All the steps with hindlimb alternation displayed pattern of movement of the limbs typical of walk, whereas all the steps with hindlimb phase values around 0 or 1 displayed pattern of movement of the limbs typical of gallop (right, left, and half-bound gallop) or bound. Trot was never seen.
(C) Mean values (±SD) for frequency (walk [Hz]: 2.7 ± 0.4; gallop: 4.9 ± 1.0; bound: 4.9 ± 0.7), stride length (walk [cm]: 4.8 ± 0.1; gallop: 4.9 ± 0.2; bound: 5.1 ± 0.1), and speed (walk [m/s]: 0.13 ± 0.04; gallop: 0.24 ± 0.05; bound: 0.25 ± 0.06) of locomotion obtained from data in (B). Note that gallop and bound appeared at much lower frequencies in V0V-ablated mice than in wild-type mice. The significant change in mean speed between walk and mean speed in gallop and bound was mainly obtained by changing the step frequency (one-way ANOVA followed by Bonferroni’s post-test; *p < 0.05; **p < 0.01; ***p < 0.001).
(D) Circular bar plots of the stance (colored bars) and swing phase (open bars), expressed as % of a step cycle (mean ± SD) for the IHI (black), the rHI (red), the IFI (green), and the rFI (blue) during walk (top), left gallop (middle), and bound (bottom).
(E) Step-cycle composition for the stance phase during walk, left gallop, and bound in V0V-ablated mice. The small number in the outer gray circle represents the sequence of activations of the limbs (same color code as in D). There was no aerial phase during gallop and bound in the V0V-ablated mice.
(F) Stick diagrams of the left hindlimb during walk and bound in a V0V-ablated mouse.
(G) Mean ranges of angular excursions in degrees during walk and bound plotted in circular plots (same color code as F).
(H) Mean angular excursions (±angular deviation) for each segment in (G). The mean angular excursion increased for the thigh, but not for the shank and foot, when switching from walk to bound in the V0V-ablated animals.
(I) Normalized angular excursions of thigh, shank, and foot for walk and bound plotted as a function of a normalized step cycle with stance indicated in gray and swing in white. The kinematic of the three segments is similar to wild-type mice with a sequential activation of the three segments during walk and a strict synchronization in each phase of the step cycle during bound. See also Figure S2 and Movies S5 and S6.
The mean step frequency of walk observed in V0V-ablated mice resembled that seen during walk in wild-type mice (Student’s t test; p > 0.05; see also Figure S2A). The mean stride length of walk was slightly longer in V0V-ablated mice compared to wild-type mice (Figure S2B), but the mean speed of walking was not significantly different (Figure S2C). The frequency and speed of locomotion where V0V-ablated mice switched from walk to gallop were in the same range as in wild-type mice (Figure S2). Accordingly, the step frequencies of gallop and bound in V0V-ablated mice were covering the entire range of trot and part of the range of gallop and bound in wild-type (Figure S2A; note though that the fastest frequencies for gallop and bound was missing in V0V-ablated mice), leading to a lower mean frequency than in wild-type mice (Figure 4C, left panel). The stride length was significantly lower than in wild-type (Figures S2B and 4C, middle panel), leading to lower speeds of locomotion than in wild-type mice (Figures S2C and 4C, right panel).
Walk in V0V-ablated mice showed the same step-cycle composition as walk in wild-type mice (Figures 4D and 4E, upper panels). In contrast, due to a long stance phase duration (about 60% of the step cycle during gallop and about 50% of the step cycle during bound; Figure 4D, middle and lower panels), gallop and bound in the V0V-ablated mice lacked the aerial phase (Figure 4E, middle and lower panels).
The intra-limb coordination of walk in V0V-ablated mice (Figure 4F, upper panel) exhibited angular excursions that were not significantly different to walk in wild-type mice (Figures 4G, upper panels, and 4H; Watson and William’s test; p > 0.05). Switching from walk to gallop in V0V-ablated mice caused a significant increase in angular excursion for the thigh, but not for the foot (Figures 4G, lower panels, and 4H). The lack of increase in angular excursion for the foot is explained by a shorter stride length during gallop or bound observed in the V0V-ablated mice compared to the wild-type mice. Strikingly, the synchronous activation of all limb joints seen during gallop and bound in wild-type mice was also seen during gallop or bound in V0V-ablated mice (Figure 4F).
All together, these data show that the V0V-ablated mice selectively have lost the ability to trot, whereas the ability to walk, gallop, and bound is still present.
Bound Is the Only Gait Observed in the V0-Ablated Mice
Next, we analyzed the data from animals in which all V0 neurons were ablated (E1Ngn2::Cre; Dbx1-DTA).
The V0-ablated mice did not show left-right alternation of the hindlimbs (Figure 5A), as also previously reported [4], but only synchronous left-right limb movements (mean phase value: 0 ± 0.03; mean ± SD). The synchronous left-right limb movements were also seen in the forelimbs. The four-limb coordination corresponded to bound in 95% of the steps at all speeds of locomotion (Figure 5B; Movie S7). In 5% of the steps, half-bound was expressed with full synchronization of hindlimbs and small deviations (around 0.1 phase values) from full synchronization in the forelimbs. Thus, walk and trot as well as left and right gallop and for the most part half-bound were completely absent in V0-ablated animals.
Figure 5. Walk, Trot, and Gallop Are Lost in Mice with Ablation of V0 Commissural Interneurons.
(A) Phase values of hindlimbs plotted as a function of the step frequency in mice with selective loss of V0 neurons (E1Ngn2::Cre; Dbx1:DTA) showing synchronization of hindlimbs at all frequencies of locomotion (n = 107; N = 3).
(B) Circular plots showing phase values for the rHI (red), the IFI (green), and rFI (blue) with respect to the reference IHI (black) for steps in (A). Walk and trot and left and right gallop were never seen.
(C) Mean values (±SD) of step frequency (5 ± 0.18 Hz), stride length (4.4 ± 0.7 cm), and speed (0.22 ± 0.07 m/s) of locomotion.
(D) Circular bar plots with stance (colored bars) and swing phase (open bars), expressed as % of a step cycle (mean ± SD) for the IHI (black vector), the rHI (red), the IFI (green), and the rFI (blue) for bound in V0-ablated animals. The mean stance phase duration is significantly longer than the one measured in bound for wild-type and V0V-ablated mice (one-way ANOVA followed by Bonferroni’s post-test; p < 0.001).
(E) Step composition for the stance phase in bound. There was no typical aerial phase of bounding as seen in wild-type mice.
(F) Stick diagrams of the left hindlimb during walk and bound in a V0-ablated mouse.
(G) The mean range of angular excursion for the thigh, the shank, and the foot were measured. Same color code as in (F).
(H) Mean angular excursions (±angular deviation) for each segment in (G).
(I) Normalized angular excursions of thigh, shank, and foot for bound plotted as a function of a normalized step cycle with stance indicated in gray and swing in white. The activation of the three segments was typical of bound in wild-type animals with strong synchronous activation in both stance and swing phase.
The mean step frequency (Figure 5C, left panel), the mean stride length (Figure 5C, middle panel), and the mean speed of locomotion (Figure 5C, right panel) were significantly lower than observed in wild-type bound (Figure 1E; Student’s t test; p < 0.05). These differences in the average locomotor parameters were present because bound was expressed at all frequencies of locomotion in the V0-ablated mice, although the fastest frequencies for gallop and bound were missing in V0-ablated mice (Figure S2A). V0-ablated mice had shorter stride length than in wild-type mice (Figure S2B), leading to average speeds of locomotion similar to what is seen in V0V-ablated mice (Figure S2C) but slower than in wild-type mice (Figure S2C).
The difference to wild-type bound was also seen in the stance phase duration (stance phase was around 65% of the normalized step cycle; Figure 5D). Accordingly, the aerial phase— typical of bound in wild-type mice—was absent in bound in V0-ablated mice (Figure 5E).
The average angular excursions of the thigh, the shank, and the foot (Figures 5F and 5G) were significantly lower in V0-ablated mice (Figure 5H; Watson and William’s test; p < 0.001) than during wild-type bound. However, the synchronization of all the segments typical of bound in wild-type mice was also present in V0-ablated mice (Figure 5I).
The Alternating Gaits Interact with the Fully Synchronized Gait to Allow Expression of Gallop
The studies of Dbx1 mutant mice show that when alternation is present as in V0V-ablated mice, gallop is still expressed, whereas in the complete absence of alternation as in V0-ablated mice gallop disappears. To further study the influence of walk and trot on the gallop, we made a detailed analysis of the left-right hindlimb coordination during gallop in wild-type and V0V-ablated mice.
During gallop, phase values for hindlimb coordination in wild-type mice (Figure 6A) were more dispersed in the upper part of the circular plot than in V0V-ablated mice (Figure 6B). In the V0-ablated mice where gallop was not present, the two hindlimbs were in perfect synchronization at all times (Figure 6C).
Figure 6. Coordination of Gallop Is Affected by the Presence of Walk and Trot.
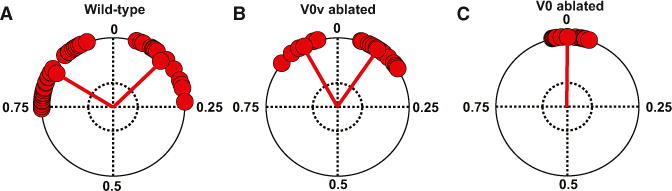
Hindlimb phase coordination during gallop in (A) wild-type and in (B) V0V-ablated (Vglut-2::Cre; Dbx1:DTA) mice and (C) bound in V0-ablated mice (E1Ngn2::Cre; Dbx1:DTA). Wild-type mice exhibited more diverse phase values (from −0.23 to 0.24; left; n = 51) than V0V-ablated mice (between −0.17 and 0.18; middle; n = 43). The mean phases for left and right gallop were 0.83 ± 0.011 and 0.12 ± 0.015, respectively, in wild-type mice and 0.92 ± 0.08 and 0.09 ± 0.007, respectively, in V0V-ablated mice. The mean phase values for left and right gallop are significantly different between wild-type and V0V-ablated mice (Watson and William’s test; p < 0.001). V0-ablated mice showed perfect synchronization of the hindlimb movements (0 ± 0.007; right; n = 88).
The strong correlation between the dispersion of phase values for hind-limb coordination and the number of alternating gaits suggests that gallop is an intermediate gait created in interaction between walk/trot and bound circuitries.
DISCUSSION
In this study, we have developed an analysis method to describe locomotion in mice moving over a wide range of speeds. We show that mice display three gaits—walk, trot, and bound—appearing in distinct speed ranges with specific inter- and intralimb coordination. A fourth gait, gallop, was found to closely resemble bound. It was expressed in overlapping locomotor speeds with trot and bound, and it exhibited a mixed inter-limb coordination. Switches between gaits were abrupt. Genetic elimination of commissural interneurons caused specific gait losses. Our study provides a comprehensive description of the gaits in mice at different speeds of locomotion and suggests a modular organization of the mammalian locomotor network.
Methodological Considerations and Differences to Previous Studies of Mouse Locomotion
There have been a number of kinematic studies of treadmill [6, 12–14] and over-ground [15–17] locomotion in wild-type mice. Several of them performed locomotor studies at restricted low speeds (<0.4 m/s) of locomotion [12, 15, 17] without classifying the alternating gait. Other studies covered locomotor speeds where trot and gallop might be executed [6, 13, 14, 16, 18]. However, in none of these studies was the step-by-step pattern of movement of the limbs classified as gaits and related to speed as described here. Instead, average values for runs, containing many steps, were given [6, 16, 18, 19], and/or the alternating gaits were lumped into one category [6, 13, 14] or not classified at all [18]. The presence of gallop has only been reported sporadically [13], and bound has never been reported before (except as quadrupedal hopping in mutant mice) [4, 20]. Our study, therefore, provides new information about the full complement of gaits seen in mice. Furthermore, the assignment of locomotor parameters to gaits provides unique information about the execution of the locomotor behavior that has not been extracted from previous studies.
The Expression of Gaits Signifies a Modular Organization of the Locomotor Networks in Mice
The most significant finding in the present study is that the gaits appear to be controlled by locomotor circuits that may be recruited to secure appropriate motor coordination at different speeds of locomotion. The two alternating gaits, walk and trot, and the synchronous gait bound are expressed in mostly non-overlapping frequency domains. Gallop appears as an intermediate gait expressed in a speed domain overlapping with trot and bound. The distinct phenotypic expression of gaits, abrupt switches between gaits, and the selective loss of specific gaits in mice with ablation of commissural interneurons suggest that the neuronal circuits controlling locomotion are organized in a modular fashion to secure the expression of different behavioral outcomes.
The differences between walk and trot are clearly displayed in the left-right alternation at the hindlimb and forelimb levels. We have previously proposed that left-right alternation is secured by both excitatory and inhibitory commissural interneurons [21–29], belonging to the V0 class of neurons [27, 30]. Commissural interneurons are operating in a dual mode fashion with inhibitory V0D neurons securing alternation at low speeds of locomotion and excitatory V0V neurons securing alteration at medium to high speeds of locomotion [4]. This dual mode organization of the left-right alternating V0 circuits was, however, not linked to phenotypic gaits. We have made this link in the present study. First, the two alternating gaits—walk and trot—are expressed in mutually non-overlapping frequencies/speeds of locomotion, with walk expressed at frequencies of locomotion below 3 to 4 Hz and trot in frequencies of locomotion from 3 or 4 Hz to 8 or 9 Hz. The switch from walk to trot happens abruptly and in a narrow range of locomotor speeds. Second, the alternating gait that remains in V0V-ablated mice corresponds to walk and is expressed in the same frequency range as reported for walk in wild-type mice. The combined analysis, therefore, suggests that left-right alternation during walk is solely dependent on the presence of inhibitory V0D neurons, whereas left-right alternation during trot solely depends on excitatory V0V neurons. The dual modular operation of the left-right alternating systems, therefore, has a behavioral distinct correlate, namely walk and trot.
The present study also shows that wild-type mice use gallop and bound for high-speed locomotion. Bound and gallop were present in V0V-ablated mice, whereas bound (previously named quadrupedal hopping by us in [4]) was the only gait expressed in V0-ablated mice. These findings suggest that excitatory non-V0 neurons (e.g., V3 neurons) [29] are responsible for the left-right synchronous limb movements during bound. Our study shows that, in the absence of the walk and/or trot, bound can be recruited even at very low speeds of locomotion, where it is normally not expressed. The frequency range for gallop/bound that was observed in V0V-ablated and V0-ablated mice was slightly reduced with the highest frequencies for gallop/bound being absent in the mutants (Figure S2A). This may suggest that the V0 neurons in addition to being involved in controlling pattern may also set the frequency of locomotion. However, a contributing factor to the lower maximal frequencies seen in mutants as compared to the wild-type mice is that the wild-type mice were studied at 2 months of age, whereas the mutants were studied at 1 month of age because the V0-ablated mice die at that age [4]. In all cases, the flexibility in frequency control of bound is striking and is not shared by walk, which is only active in a restricted range of locomotor frequencies. When walk and trot are absent (as in V0-ablated mice), bound becomes the default mode.
During gallop, the most-common pattern of coordination was represented by left and right gallop with near synchronous activity of hindlimbs and alternating activity of forelimbs. Gallop with variable forelimb and hindlimb coordination was seen both in wild-type mice and in V0V-ablated mice, serving as an intermediate gait between trot and bound (wild-type mice) or walk and bound (V0V-ablated mice). The analysis of left-right hindlimb coordination in wild-type and V0V-ablated mice shows that left-right coordination during gallop is affected by the presence of alternating gaits. We therefore suggest that the alternating circuits controlling walk and trot interact with the circuits generating synchronous bound to produce the specific coordination of movement of the limbs observed in gallop. The intra-limb coordination that was similar in gallop and bound in wild-type mice appears to be strongly dominated by the bound circuitry.
Together, our analysis suggests that walk, trot, and bound are generated by distinct ensemble of neurons or modules that are recruited in a speed-dependent way. Gallop is an intermediate gait needed to switch to bound expressed at the highest speed of locomotion in mice. Notably, speed can also be regulated within the different gaits. The gait-preserving increase in speed is primarily obtained by a change in locomotor frequency and/or stride length (Figure S1C).
The Need to Consider Gaits when Studying Locomotion
The mouse is presently the prevailing model for studying the neuronal control of locomotion in mammals [26, 31–34]. Only recently have speed-dependent changes in network configuration been considered when studying the locomotor network in terrestrial [4, 6, 8, 35, 36] and aquatic animals [2, 3]. The present study stresses this point and provides benchmarks for further studies of neuronal networks underlying mammalian locomotion, as well as for locomotor deficits seen after spinal cord injury, stroke, Parkinson’s disease, or ALS. Speed of locomotion also regulates the visual cortical state [37–39] and cognitive functions like navigation [40], suggesting the need for considering locomotor network selection in a broader context.
EXPERIMENTAL PROCEDURES
Mice
Data were collected from five wild-type female mice at 2 months of age and from E1Ngn2::Cre [39]: Dbx1lox-STOP-lox-DTA (Dbx1DTA) [41] and Vglut2::Cre [42]; Dbx1lox-STOP-lox-DTA (Dbx1DTA) mice (n = 3 for each strain) aged 1 month. All experimental procedures followed the guidelines of the Animal Welfare Agency and were approved by the local Animal Committee.
Locomotor Experiments
Mice locomotion was evaluated using the MotoRater apparatus (TSE-Systems). The acquisition rate of the camera varied from 100 to 300 frames/s.
So that locomotion at different speeds with different gaits could be obtained, each animal performed locomotion according to the procedure described in detail in the Supplemental Experimental Procedures. Multiple joints were marked with white dots to facilitate kinematic analysis using automatized TSE Motion High-Speed Video Analysis Software (Sophisticated Life Science Research Instrumentation).
Statistics
Mean values were calculated as weighted averages of the mean from each animal. Statistical comparisons between groups were done using a Student’s t test (for two groups) or a one-way ANOVA followed by Bonferroni’s multiple comparison post hoc test for linear data. Watson and Williams’s test (or Watson’s U2) were used for circular data. The level of significance was p < 0.05 for all datasets.
Supplementary Material
Highlights.
Mice exhibit four main gaits—walk, trot, gallop, and bound—at different speeds
Walk, trot, and bound are the outcomes of three distinct neuronal modules
Genetic ablation of V0 neuronal populations disrupts specific gait modules
Locomotion in mice is governed by neuronal circuits organized in a modular fashion
Acknowledgments
This work was supported by Swedish Medical Research Council, Torsten and Ragnar Söderberg Foundations, and the European Research Council advanced grant (no. 268628). We thank Natalie Sleiers for support with performing the over-ground locomotor experiments and Ann Charlotte-Westerdahl and Anna Kasagiannis for genotyping of mice. We thank the members of the O.K. lab for providing valuable inputs to this study.
Footnotes
SUPPLEMENTAL INFORMATION
Supplemental Information includes Supplemental Experimental Procedures, two figures, and seven movies and can be found with this article online at http://dx.doi.org/10.1016/j.cub.2015.04.005.
References
- 1.McLean DL, Fetcho JR. Spinal interneurons differentiate sequentially from those driving the fastest swimming movements in larval zebrafish to those driving the slowest ones. J Neurosci. 2009;29:13566–13577. doi: 10.1523/JNEUROSCI.3277-09.2009. [DOI] [PMC free article] [PubMed] [Google Scholar]
- 2.McLean DL, Masino MA, Koh IY, Lindquist WB, Fetcho JR. Continuous shifts in the active set of spinal interneurons during changes in locomotor speed. Nat Neurosci. 2008;11:1419–1429. doi: 10.1038/nn.2225. [DOI] [PMC free article] [PubMed] [Google Scholar]
- 3.Ampatzis K, Song J, Ausborn J, El Manira A. Separate microcircuit modules of distinct v2a interneurons and motoneurons control the speed of locomotion. Neuron. 2014;83:934–943. doi: 10.1016/j.neuron.2014.07.018. [DOI] [PubMed] [Google Scholar]
- 4.Talpalar AE, Bouvier J, Borgius L, Fortin G, Pierani A, Kiehn O. Dual-mode operation of neuronal networks involved in left-right alternation. Nature. 2013;500:85–88. doi: 10.1038/nature12286. [DOI] [PubMed] [Google Scholar]
- 5.Crone SA, Quinlan KA, Zagoraiou L, Droho S, Restrepo CE, Lundfald L, Endo T, Setlak J, Jessell TM, Kiehn O, Sharma K. Genetic ablation of V2a ipsilateral interneurons disrupts left-right locomotor coordination in mammalian spinal cord. Neuron. 2008;60:70–83. doi: 10.1016/j.neuron.2008.08.009. [DOI] [PubMed] [Google Scholar]
- 6.Crone SA, Zhong G, Harris-Warrick R, Sharma K. In mice lacking V2a interneurons, gait depends on speed of locomotion. J Neurosci. 2009;29:7098–7109. doi: 10.1523/JNEUROSCI.1206-09.2009. [DOI] [PMC free article] [PubMed] [Google Scholar]
- 7.Zhong G, Droho S, Crone SA, Dietz S, Kwan AC, Webb WW, Sharma K, Harris-Warrick RM. Electrophysiological characterization of V2a interneurons and their locomotor-related activity in the neonatal mouse spinal cord. J Neurosci. 2010;30:170–182. doi: 10.1523/JNEUROSCI.4849-09.2010. [DOI] [PMC free article] [PubMed] [Google Scholar]
- 8.Zhong G, Sharma K, Harris-Warrick RM. Frequency-dependent recruitment of V2a interneurons during fictive locomotion in the mouse spinal cord. Nat Commun. 2011;2:274. doi: 10.1038/ncomms1276. [DOI] [PMC free article] [PubMed] [Google Scholar]
- 9.Dougherty KJ, Kiehn O. Functional organization of V2a-related locomotor circuits in the rodent spinal cord. Ann N Y Acad Sci. 2010;1198:85–93. doi: 10.1111/j.1749-6632.2010.05502.x. [DOI] [PubMed] [Google Scholar]
- 10.Dougherty KJ, Zagoraiou L, Satoh D, Rozani I, Doobar S, Arber S, Jessell TM, Kiehn O. Locomotor rhythm generation linked to the output of spinal shox2 excitatory interneurons. Neuron. 2013;80:920–933. doi: 10.1016/j.neuron.2013.08.015. [DOI] [PubMed] [Google Scholar]
- 11.Hildebrand M. Symmetrical gaits of horses. Science. 1965;150:701–708. doi: 10.1126/science.150.3697.701. [DOI] [PubMed] [Google Scholar]
- 12.Leblond H, L’Esperance M, Orsal D, Rossignol S. Treadmill locomotion in the intact and spinal mouse. J Neurosci. 2003;23:11411–11419. doi: 10.1523/JNEUROSCI.23-36-11411.2003. [DOI] [PMC free article] [PubMed] [Google Scholar]
- 13.Herbin M, Gasc JP, Renous S. Symmetrical and asymmetrical gaits in the mouse: patterns to increase velocity. J Comp Physiol A Neuroethol Sens Neural Behav Physiol. 2004;190:895–906. doi: 10.1007/s00359-004-0545-0. [DOI] [PubMed] [Google Scholar]
- 14.Herbin M, Hackert R, Gasc JP, Renous S. Gait parameters of treadmill versus overground locomotion in mouse. Behav Brain Res. 2007;181:173–179. doi: 10.1016/j.bbr.2007.04.001. [DOI] [PubMed] [Google Scholar]
- 15.Clarke KA, Still J. Gait analysis in the mouse. Physiol Behav. 1999;66:723–729. doi: 10.1016/s0031-9384(98)00343-6. [DOI] [PubMed] [Google Scholar]
- 16.Serradj N, Jamon M. The adaptation of limb kinematics to increasing walking speeds in freely moving mice 129/Sv and C57BL/6. Behav Brain Res. 2009;201:59–65. doi: 10.1016/j.bbr.2009.01.030. [DOI] [PubMed] [Google Scholar]
- 17.Akay T, Acharya HJ, Fouad K, Pearson KG. Behavioral and electromyographic characterization of mice lacking EphA4 receptors. J Neurophysiol. 2006;96:642–651. doi: 10.1152/jn.00174.2006. [DOI] [PubMed] [Google Scholar]
- 18.Batka RJ, Brown TJ, Mcmillan KP, Meadows RM, Jones KJ, Haulcomb MM. The need for speed in rodent locomotion analyses. Anat Rec (Hoboken) 2014;297:1839–1864. doi: 10.1002/ar.22955. [DOI] [PMC free article] [PubMed] [Google Scholar]
- 19.Heglund NC, Taylor CR. Speed, stride frequency and energy cost per stride: how do they change with body size and gait? J Exp Biol. 1988;138:301–318. doi: 10.1242/jeb.138.1.301. [DOI] [PubMed] [Google Scholar]
- 20.Kullander K, Butt SJ, Lebret JM, Lundfald L, Restrepo CE, Rydström A, Klein R, Kiehn O. Role of EphA4 and EphrinB3 in local neuronal circuits that control walking. Science. 2003;299:1889–1892. doi: 10.1126/science.1079641. [DOI] [PubMed] [Google Scholar]
- 21.Quinlan KA, Kiehn O. Segmental, synaptic actions of commissural interneurons in the mouse spinal cord. J Neurosci. 2007;27:6521–6530. doi: 10.1523/JNEUROSCI.1618-07.2007. [DOI] [PMC free article] [PubMed] [Google Scholar]
- 22.Kjaerulff O, Kiehn O. Crossed rhythmic synaptic input to motoneurons during selective activation of the contralateral spinal locomotor network. J Neurosci. 1997;17:9433–9447. doi: 10.1523/JNEUROSCI.17-24-09433.1997. [DOI] [PMC free article] [PubMed] [Google Scholar]
- 23.Restrepo CE, Lundfald L, Szabó G, Erdélyi F, Zeilhofer HU, Glover JC, Kiehn O. Transmitter-phenotypes of commissural interneurons in the lumbar spinal cord of newborn mice. J Comp Neurol. 2009;517:177–192. doi: 10.1002/cne.22144. [DOI] [PubMed] [Google Scholar]
- 24.Restrepo CE, Margaryan G, Borgius L, Lundfald L, Sargsyan D, Kiehn O. Change in the balance of excitatory and inhibitory midline fiber crossing as an explanation for the hopping phenotype in EphA4 knockout mice. Eur J Neurosci. 2011;34:1102–1112. doi: 10.1111/j.1460-9568.2011.07838.x. [DOI] [PubMed] [Google Scholar]
- 25.Butt SJ, Lebret JM, Kiehn O. Organization of left-right coordination in the mammalian locomotor network. Brain Res Brain Res Rev. 2002;40:107–117. doi: 10.1016/s0165-0173(02)00194-7. [DOI] [PubMed] [Google Scholar]
- 26.Kiehn O. Development and functional organization of spinal locomotor circuits. Curr Opin Neurobiol. 2011;21:100–109. doi: 10.1016/j.conb.2010.09.004. [DOI] [PubMed] [Google Scholar]
- 27.Lanuza GM, Gosgnach S, Pierani A, Jessell TM, Goulding M. Genetic identification of spinal interneurons that coordinate left-right locomotor activity necessary for walking movements. Neuron. 2004;42:375–386. doi: 10.1016/s0896-6273(04)00249-1. [DOI] [PubMed] [Google Scholar]
- 28.Andersson LS, Larhammar M, Memic F, Wootz H, Schwochow D, Rubin CJ, Patra K, Arnason T, Wellbring L, Hjälm G, et al. Mutations in DMRT3 affect locomotion in horses and spinal circuit function in mice. Nature. 2012;488:642–646. doi: 10.1038/nature11399. [DOI] [PMC free article] [PubMed] [Google Scholar]
- 29.Zhang Y, Narayan S, Geiman E, Lanuza GM, Velasquez T, Shanks B, Akay T, Dyck J, Pearson K, Gosgnach S, et al. V3 spinal neurons establish a robust and balanced locomotor rhythm during walking. Neuron. 2008;60:84–96. doi: 10.1016/j.neuron.2008.09.027. [DOI] [PMC free article] [PubMed] [Google Scholar]
- 30.Pierani A, Moran-Rivard L, Sunshine MJ, Littman DR, Goulding M, Jessell TM. Control of interneuron fate in the developing spinal cord by the progenitor homeodomain protein Dbx1. Neuron. 2001;29:367–384. doi: 10.1016/s0896-6273(01)00212-4. [DOI] [PubMed] [Google Scholar]
- 31.Kiehn O. Locomotor circuits in the mammalian spinal cord. Annu Rev Neurosci. 2006;29:279–306. doi: 10.1146/annurev.neuro.29.051605.112910. [DOI] [PubMed] [Google Scholar]
- 32.Goulding M. Circuits controlling vertebrate locomotion: moving in a new direction. Nat Rev Neurosci. 2009;10:507–518. doi: 10.1038/nrn2608. [DOI] [PMC free article] [PubMed] [Google Scholar]
- 33.Whelan PJ. Shining light into the black box of spinal locomotor networks. Philos Trans R Soc Lond B Biol Sci. 2010;365:2383–2395. doi: 10.1098/rstb.2009.0322. [DOI] [PMC free article] [PubMed] [Google Scholar]
- 34.Grillner S, Jessell TM. Measured motion: searching for simplicity in spinal locomotor networks. Curr Opin Neurobiol. 2009;19:572–586. doi: 10.1016/j.conb.2009.10.011. [DOI] [PMC free article] [PubMed] [Google Scholar]
- 35.Talpalar AE, Kiehn O. Glutamatergic mechanisms for speed control and network operation in the rodent locomotor CpG. Front Neural Circuits. 2010;4:19. doi: 10.3389/fncir.2010.00019. [DOI] [PMC free article] [PubMed] [Google Scholar]
- 36.Borgius L, Nishimaru H, Caldeira V, Kunugise Y, Löw P, Reig R, Itohara S, Iwasato T, Kiehn O. Spinal glutamatergic neurons defined by EphA4 signaling are essential components of normal locomotor circuits. J Neurosci. 2014;34:3841–3853. doi: 10.1523/JNEUROSCI.4992-13.2014. [DOI] [PMC free article] [PubMed] [Google Scholar]
- 37.Andermann ML, Kerlin AM, Roumis DK, Glickfeld LL, Reid RC. Functional specialization of mouse higher visual cortical areas. Neuron. 2011;72:1025–1039. doi: 10.1016/j.neuron.2011.11.013. [DOI] [PMC free article] [PubMed] [Google Scholar]
- 38.Keller GB, Bonhoeffer T, Hübener M. Sensorimotor mismatch signals in primary visual cortex of the behaving mouse. Neuron. 2012;74:809–815. doi: 10.1016/j.neuron.2012.03.040. [DOI] [PubMed] [Google Scholar]
- 39.Berger J, Eckert S, Scardigli R, Guillemot F, Gruss P, Stoykova A. E1-Ngn2/Cre is a new line for regional activation of Cre recombinase in the developing CNS. Genesis. 2004;40:195–199. doi: 10.1002/gene.20081. [DOI] [PubMed] [Google Scholar]
- 40.Strange BA, Witter MP, Lein ES, Moser EI. Functional organization of the hippocampal longitudinal axis. Nat Rev Neurosci. 2014;15:655–669. doi: 10.1038/nrn3785. [DOI] [PubMed] [Google Scholar]
- 41.Bielle F, Griveau A, Narboux-Nême N, Vigneau S, Sigrist M, Arber S, Wassef M, Pierani A. Multiple origins of Cajal-Retzius cells at the borders of the developing pallium. Nat Neurosci. 2005;8:1002–1012. doi: 10.1038/nn1511. [DOI] [PubMed] [Google Scholar]
- 42.Borgius L, Restrepo CE, Leao RN, Saleh N, Kiehn O. A transgenic mouse line for molecular genetic analysis of excitatory glutamatergic neurons. Mol Cell Neurosci. 2010;45:245–257. doi: 10.1016/j.mcn.2010.06.016. [DOI] [PubMed] [Google Scholar]
Associated Data
This section collects any data citations, data availability statements, or supplementary materials included in this article.