

Abstract
The purpose of this study was to record and evaluate existing public hospital infrastructure of the National Health System (NHS), in terms of clinics and laboratories, as well as the healthcare workforce in each of these units and in every health region in Greece, in an attempt to optimize the allocation of these resources. An extensive analysis of raw data according to supply and performance indicators was performed to serve as a solid and objective scientific baseline for the proposed reengineering of the Greek public hospitals. Suggestions for “reshuffling” clinics and diagnostic laboratories, and their personnel, were made by using a best versus worst outcome indicator approach at a regional and national level. This study is expected to contribute to the academic debate about the gap between theory and evidence based decision-making in health policy.
Keywords: hospitals, reengineering, efficiency, Greece, mergers
1. Introduction
In the health sector, the task of reorganizing two or more hospitals in an effort to reduce the overall costs of their services has been described as “restructuring”, “reconfiguring”, “reengineering” or more commonly “merging” (Krishnan, 2001; Kjekshus & Hagen, 2007; Ahgren, 2008). Merging does not necessarily result in the closure of one hospital and the extension of another, nor does it imply that a new investment replaces two or more older hospitals. A “merger” may mean that hospital services are reduced in one hospital and concentrated in another so that the former hospital retains only a limited number of specialties or services. Whilst efficiency is obviously the predominant criterion in the merging process, the sensitive nature of health and healthcare requires that policy-makers equally value the usually contradicting (to efficiency) criterion of access equity.
Many motives for mergers have been reported in the literature. One aim is to achieve economic gains, firstly by taking advantage of economies of scale and scope, especially with regard to management costs (Ferguson & Goddard, 1997) and secondly, as a result of rationalizing the provision of services by reducing excess capacity to treat patients. It has also been assumed that clinical quality improves as usage of specialized units increases (Smith, 2001), that quality of medical training increases (Dowie & Gravelle, 1997) and staff recruitment and staff retention become more effective (Ferguson et al., 1997). On the other hand, it has been argued that the evidence for benefits of horizontal mergers is contradictory and often based on subjective beliefs and opinions. Unintended consequences and potential drawbacks of mergers receive less attention. These include disruption of services as a direct consequence of mergers, diseconomies of scale, and problems with staffing, service integration, systems integration, and working practices, as well as issues of equity and access to services (McClenahan, 1999).
The international literature on mergers suggests mixed (or contradictory) results. A series of recent merger retrospective studies which examined the effect of a particular merger have been inconclusive as to the impact on inpatient cost (Haas-Wilson & Garmon, 2011; Tenn, 2011; Thompson, 2011). Other studies having examined the impacts of large numbers of (mostly) private hospital mergers in the US found, in general, little benefit from merger and consolidation (Ho & Hamilton, 2000; Krishnan, 2001; Spang et al., 2001; Town et al., 2006; Dafny, 2009). Case studies of hospital mergers in the UK have highlighted the fact that the pre-merger forecasts of savings in management costs were eventually over-optimistic (Fulop et al., 2002; Hutchings et al., 2003). Finally, a recent UK study examined the impact of mergers on a large set of outcomes including financial performance, productivity, waiting times and clinical quality and found little evidence that mergers achieved gains other than a reduction in activity (Gaynor et al., 2012).
The Greek literature lacks studies on merger efforts in the health sector although many parametric or non-parametric efficiency measurement studies have demonstrated the potential for efficiency gains in Greek hospitals (Aletras, 1999; Athanassopoulos et al., 1999; Athanassopoulos & Gounaris, 2001; Giokas, 2001; Kontodimopoulos et al., 2006; Aletras et al., 2007; Flokou et al., 2011; Kounetas & Papathanassopoulos, 2013; Polyzos, 2013). Empirical evidence is an important factor to guide decision-making, however the existing political and economical situation in Greece, in conjunction to an intense social turmoil, implies that restructuring should rely less on technical and analytical tools, and more on various social, political, geographical and other peculiarities existing nationally and locally in Greece.
2. The Situation in Greece
2.1 The Economic Crisis
The long-term inefficiencies and shortcomings of the Greek NHS are well known (Tountas et al., 2002; Davaki & Mossialos, 2005; Mossialos & Allin, 2005; Mossialos et al., 2005; Nikolentzos & Mays, 2008; Tountas et al., 2011). Legislative initiatives to confront these inefficiencies have been mostly unsuccessful due to political particularism, fiscal constraints and administrative weaknesses (Tragakes & Polyzos, 1998). Since 2009 the Greek economy has been facing its most severe crisis in recent history and to avert a potential default, the European Commission, the International Monetary Fund and the European Central Bank (referred to as the “Troika”) agreed to a rescue package with immediate bailout loans, and more funds to follow. To secure continuity of the funding, Greece has been required to adopt harsh austerity measures to control its deficit, and their implementation has been constantly monitored and evaluated by the Troika. The Government has been addressing inefficiencies by reducing the size and costs of the public sector, resulting in tax increases and cuts in many areas, including health care. A series of measures have been adopted for the NHS Hospitals such as national tendering procedures for procurement of hospital medical products and pharmaceuticals (Kastanioti et al., 2013), implementation of a DRG-based payment system (Polyzos et al., 2013) and reforms in the pharmaceutical market (Kontodimopoulos et al., 2013; Vandoros & Stargardt, 2013). Hospital mergers captured the public eye and became the centerpiece of health policy reform.
2.2 Restructuring Greek Public Hospitals
The formal announcement by the MoH to embark on an effort to restructure NHS hospitals was made in early 2011 when a competent committee was set up (Liaropoulos et al., 2012) to formulate proposals from a managerial prospective in order to decrease administrative costs data. These and relative proposals made by the National School of Public Health were discussed in all Regional Healthcare Authorities (RHA) with their managers and other professional bodies, and the effort concluded in a final text (suggestions from RHA Managers which led to a proposal by the Secretary-General of the Ministry that was examined by the Deputy Ministers, and decisions by the Minister of Health) on 1 July 2011. The Central Council of Regional Healthcare Authorities (including all the above) approved these proposals by the end of October 2011 and after publication of the necessary institutional decisions, these proposals should be implemented by the end of 2011.
The reorganization of the NHS Health Units was undertaken to achieve key objectives relating to:
- development of a new sustainable architecture for optimal allocation of inputs,
- optimal utilization of the public health care system resources,
- efficient and effective operation of the NHS Health Units thus seeking both the unified planning of health services for effective and equitable coverage of citizens by integrated and quality health services, and the necessary economies of scale in rationalization of the health system.
The completion of the hospital’s network reform has led to 82 hospital units out of 131. The remaining 49 have been connected with 80 hospitals as NHS Trusts, whereas 2 not-for-profit public agencies remained autonomous. Additionally five IKA hospitals (white and blue collars’ social insurance fund) were transferred to five main hospitals. The total number of beds of the NHS’s hospitals decreased to 35.360 (+1.990 Psychosocial Rehabilitation Units), from 46.783, while the number of the medical Departments and Units has declined by 600 and the working positions were cut by 15.000 (-20% and -15% respectively). Additionally, changes have been made in the use of eight small hospitals which are turned into urban health centers, support and palliative care units and hospitals for short-term hospitalization and rehabilitation.
3. Present Study
3.1 Scope
The previously mentioned proposals and decisions were focused mainly on restructuring the management of NHS hospitals, merging some of them and changing the intended use of others. Apart from these important and necessary changes, there is a need for reallocation of medical and laboratory units in order to solve existing problems regarding shortages or oversupply of services in different parts of the country, which generate important inequalities in the distribution of services among the seven Health Regions. For this reason, the scope of the present study was to measure and evaluate the distribution of NHS clinical and laboratory services and workforce in relation to the population in each health region, and to formulate proposals for their proper reallocation.
4. Methods
4.1 Data Collection
Raw data were collected within a period of six months in 2012 from 129 Greek NHS hospitals (2 hospitals never completed and returned the forms and questionnaires), by the researchers via specially constructed data collection forms and questionnaires, and were subsequently examined and complemented with data from ESY.net, a web-based facility developed by the MoH to collect updated and reliable data from NHS hospitals on a monthly basis. Preliminary analyses were limited to a detailed description of the current situation of the Greek hospital sector. However, it should be taken into account that the study described in this article was carried out on a large scale, and constitutes the second, and most complete, effort to record imaging and diagnostic laboratories, and most importantly available human resources per hospital and per Health Region. This paper exploits the aforementioned data by comparing supply and performance indicators in each Region with the average national scores. Deviations or convergences are used to formulate specific proposals for the reengineering of the public hospital sector or the “reshuffling” of the health professionals and infrastructure at a HR level. The following section provides a detailed description of the supply and performance indicators used in this study.
-
A.
Supply Indicators
-
A. 1
Hospital beds/1000 population
-
A. 2
Doctors/1000 population
-
A. 3
Nurses/1000 population
-
A. 4
Total staff/1000 population
-
A. 5
Major Hospital Clinics/100.000 population
-
A. 6
Major Clinics Hospital beds/1000 population
-
A. 7
Diagnostic Laboratory Doctors/1000 population
-
A. 8
Diagnostic Laboratory Nurses/1000 population
-
A. 9
Diagnostic Laboratory Health workers/1000 population
-
A. 10
Total Diagnostic Laboratory staff/1000 population
-
A. 11
Major Hospital Diagnostic Laboratories/100.000 population
-
B.
Performance Indicators
-
B. 1
Hospital Doctors/Hospital Bed
-
B. 2
Nurses/Hospital Bed
-
B. 3
Total staff/Hospital Bed
-
B. 4
Major clinics’ staff (doctors, nurses and in total)/Hospital Bed
The data were organized according to the following thematic analytical categories:
-
A.
Hospital Clinics (National Health System or University)
-
1)
The type and kind of clinic (National Health System (Note 1) or University)
-
2)
The sector (internal medicine, surgery, psychiatry and intersectorial)
-
3)
Number of hospital beds/ESY clinic-university clinic
-
4)
Number of specialized doctors/ESY clinic-university clinic
-
5)
Number of university doctors/university clinic
-
6)
Number of resident doctors/ESY clinic-university clinic
-
7)
Number of associate – assistant doctors/ESY clinic- university clinic
-
8)
Number of nurse/ESY clinic- university clinic
-
9)
Total number of doctors and nurses/ESY clinic – university clinic
-
B.
Diagnostic Laboratories (ΕSΥ or University)
-
1)
The type and kind of laboratory (National Health System or University)
-
2)
The sector (internal medicine, surgery, psychiatry and intersectorial)
-
3)
Number of specialized doctors/ESY laboratories-university laboratories
-
4)
Number of university doctors/ESY laboratories-university laboratories
-
5)
Number of resident doctors/ESY laboratories-university laboratories
-
6)
Number of associate – assistant doctors/ESY laboratories-university laboratories
-
7)
Number of nurses/ESY laboratories-university laboratories
-
8)
Number of other laboratory health workers/ESY laboratories-university laboratories
-
9)
Total number of doctors, nurses and laboratory health workers/ESY laboratories-university laboratories.
4.2 Sample
All secondary and tertiary public hospitals (ESY or University public hospitals) were included in the study (N=129). The reference population for calculating the supply and performance indicators was defined according to information collected and analyzed from the Hellenic Statistical Authority and each of the seven HRs. The total population of Greece in 2011 was 10.785.860, distributed in seven HRs (Health Regions) as follows:
The 1st HR includes 4 geographic sub-regions with a population of 2.551.170.
The 2nd HR includes 8 geographic sub-regions with a population of 1.767.580.
The 3rd HR includes 2 geographic sub-regions with a population of 1.143.290.
The 4th HR includes 5 geographic sub-regions with a population of 1.619.590.
The 5th HR includes 2 geographic sub-regions with a population of 1.277.600.
The 6th HR includes 4 geographic sub-regions with a population of 1.805.290.
The total population of the 7th HR is 621.340. (Map 1)
Map 1.
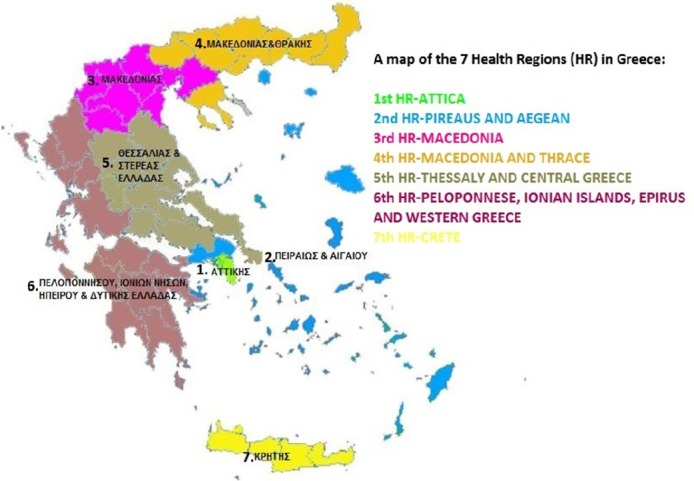
The 7 Health Regions of Greece
5. Results
A. Supply Indicators for Hospital Clinics and Diagnostic Laboratories
A.1 Hospital beds/1000 population
The national average of hospital beds/1000 population is 2.9. The lowest indicator was recorded in the 5th (2.04) and the 2nd (2.32) HRs, whereas the highest in the 1st (3.5), 7th (3.45) and 3rd (3.04) HRs (Table 1).
Table 1.
General supply and performance indicators
| Clinics (N) | Total | 1st HR | 2nd HR | 3rd HR | 4th HR | 5th HR | 6th HR | 7th HR | |||||||
|---|---|---|---|---|---|---|---|---|---|---|---|---|---|---|---|
| 1581 | 417 | 229 | 168 | 228 | 153 | 271 | 115 | ||||||||
| Mean | Mean | Dev. | Mean | Dev. | Mean | Dev. | Mean | Dev. | Mean | Dev. | Mean | Dev. | Mean | Dev. | |
| Hospital beds/1000 population | 2.90 | 3.50 | 0.60 | 2.32 | -0.58 | 3.04 | 0.14 | 3.03 | 0.13 | 2.04 | -0.86 | 2.83 | -0.07 | 3.45 | 0.55 |
| Hospital Doctors/1000 population | 1.42 | 1.99 | 0.57 | 1.09 | -0.33 | 1.36 | -0.06 | 1.41 | -0.01 | 0.92 | -0.50 | 1.26 | -0.16 | 1.60 | 0.18 |
| Hospital Nurses/1000 population | 1.79 | 2.21 | 0.42 | 1.35 | -0.44 | 1.75 | -0.04 | 1.91 | 0.12 | 1.46 | -0.33 | 1.71 | -0.08 | 2.02 | 0.23 |
| Total staff/1000 population | 3.21 | 4.2 | 0.99 | 2.44 | -0.77 | 3.11 | -0.10 | 3.32 | 0.11 | 2.38 | -0.83 | 2.97 | -0.24 | 3.62 | 0.41 |
| Hospital doctors/Hospital Bed | 0.49 | 0.57 | 0.08 | 0.47 | -0.02 | 0.45 | -0.04 | 0.46 | -0.03 | 0.45 | -0.04 | 0.45 | -0.04 | 0.46 | -0.03 |
| Hospital Nurses/Hospital Bed | 0.62 | 0.63 | 0.01 | 0.58 | -0.04 | 0.57 | -0.05 | 0.63 | 0.01 | 0.71 | 0.09 | 0.60 | -0.02 | 0.58 | -0.04 |
| Total staff/Hospital Bed | 1.10 | 1.20 | 0.10 | 1.05 | -0.05 | 1.02 | -0.08 | 1.09 | -0.01 | 1.16 | 0.06 | 1.05 | -0.05 | 1.04 | -0.06 |
Note. “Dev” refers to the deviance of the respective indicator from the overall average.
A.2 Hospital staff/1000 Population
As for doctors of hospital clinics/1000 population, the national average is 1.42. The highest indicator was recorded in the 1st (1.99), 7th (1.66) and 4th (1.41) HRs, whereas the lowest in the 5th and 2nd HRs, 0.92 and 1.09 respectively. In terms of nurses, the national average was 1.79, with the best outcomes observed in the 1st (2.21), 7th (2.02) and 4th (1.91) HRs, while the worst in the 5th (1.46), 2nd (1.35) and 3rd HRs (1.75) (Table 1). As far as total staff/1000 population is concerned, the best results came from the 1st (4.2), 7th (3.62) and 4th (3.32) HRs, while the worst came from the 5th (2.38) and 2nd (2.44) HRs.
A.3 Major Hospital Clinics per 100.000 Population
The national average for internal medicine clinics (internal medicine) is 1.65/100.000 population. The best results were observed in the 1st (2.04), 7th (1.61), and 6th (1.61), while the worst outcomes came from the 5th and 3rd HRs, 1.33 and 1.49 respectively.
The national average for (general) surgery hospital clinics is 1.48/100.000 population. The highest concentrations were observed in the 1st (1.76), 3rd (1.57) and 4th (1.54) HRs, while the lowest came from the 5th (1.09), 2nd (1.36) and 7th (1.29) HRs.
Cardiology hospital clinics present a 1.07 supply indicator as a national average, implying that the 6th (1.33), 3rd (1.22) and 7th (1.13) HRs were amongst the best in this respect (i.e. clinics per 100.000 population. On the contrary, the 4th (0.86), 2nd (0.96) and 5th (1.02) HRs were below the national average.
The national average for pediatrics clinics is 0.77, with the best outcomes observed in the 7th (1.13) and 6th (1.05) HRs, and the worst in the 1st (0.39) HR.
Obstetrics-Gynecology has a 0.90 national average, with the best results in the 6th (1.22), 7th (1.13) and 3rd (1.05) HRs. Again the worst result came from the 1st HR (0.59).
ICU have a 0.67 national average per 100.000 population, with the highest indicator recorded in the 7th (0.96) HR and the lowest in the 5th (0.39) HR.
The national average for orthopedic clinics is 1.05 per 100.000 population. The highest (1.29) and lowest (0.73) indicators came from the 1st and 2nd HRs respectively.
Pneumonology clinics present a national average of 0.48 clinics per 100.000 population. The best outcome was observed it the 7th (0.8) and 1st (0.78) HRs, whereas the worst in the 4th and 5th (0.31) HRs.
Psychiatric clinics in Greek public hospitals present a national average of 0.40. The highest indicators come from the 2nd (0.73), the 7th (0.48) and the 4th (0.43) HRs, and the lowest from the 5th (0.16) and 1st (0.31) HRs. The rather low scoring can be attributed to the fact that specialized psychiatric public hospitals are excluded from the research.
Ophthalmology clinics present a national average of 0.74 clinics per 100.000 population with highest results in the 7th (0.96), 3rd (0.87), and 6th (0.83) HRs. The lowest results appear in 2nd (0.62) and 4th (0.68) HRs.
The otolaryngology (ENT) clinics of public Greek hospitals have a national average of 0.76 clinics per 100.000 population. The best outcomes came from the 3rd (1.05), 7th (0.96) and 6th (0.83) HRs, while the worst from the 1st (0.59) and 4th (0.68) HRs.
A.4 Major Clinics’ Hospital Beds/1000 Population
The national average for internal medicine (internal medicine) hospital beds is 0.51 per 1000 population. The best results were observed in the 1st (1.76) HR, whereas the worst in the 5th (0.38) HR.
The national average for (general) surgery hospital beds is 0.3/1000 population. The highest concentration was observed in the 1st (0.45), 3rd (0.44) and 4th (0.43) HRs, while the worst results came from the 5th (0.38) and 3rd (0.28) HRs.
Cardiology hospital beds in Greece present a 0.24 per 1000 population supply indicator as a national average. The 1st (0.28) and 7th (0.28) HRs were the best in this respect whereas the 2nd (0.19) and 5th (0.18) were below the national average.
The national average for pediatric hospital beds is 0.18 per 1000 population, with the best outcome observed in the 6th (0.24), 7th (0.23), and 4th (0.22) HRs, and the worst in the 2nd and 5th (0.11) HRs.
Obstetrics-Gynecology clinics have a 0.20 national average, with the best results in the 7th (0.25), 6th (0.25), and 4th (0.23) HRs. Again the worst results came from the 2nd (0.16) and 5th (0.17) HRs.
ICU hospital beds have a 0.67 national average, with the best results observed in the 1st (0.08), 7th (0.07), and 3rd (0.07) HRs, while the worst came from the 5th (0.03), 4th (0.04) and the 2nd (0.04) HRs.
Hospital beds for orthopedic hospital clinics/1000 population have a national average of 0.24, with the highest observed in the 3rd (0.32) HR, and the lowest in the 2nd (0.15).
Pneumonology hospital beds present a national average of 0.11 per 1000 population. Best and worst outcomes were observed in the 1st (0.23) and 4th (0.05) HRs respectively.
Psychiatric beds in Greek public hospitals present a national average of 0.09. The highest scores belong to the 2nd (0.27), and 7th (0.11) HRs and the lowest to the 5th (0.01) HR.
Ophthalmology beds present a national average of 0.08 per 1000 population with the highest results in the 7th (0.1) and 4th (0.1) HRs. The lowest results appear in the 2nd HR.
The otolaryngology (ENT) beds score a national average of 0.08 per 1000 population. The best outcomes came from the 7th (0.12) HR and the worst came from the 5th (0.06).
A.5 Diagnostic Laboratory Staff/1000 population
As far as laboratory doctors/1000 population is concerned, the national average is 0.36 doctors/1000 population. The highest indicators belong to the 1st (0.55), 6th (0.31) and 7th (0.4) HRs, while the lowest to the 5th (0.2) and 2nd (0.27) HRs. Laboratory nurses have a national average of 0.12, with the highest results found in the 1st (0.14) and 7th (0.13) HRs, and the lowest in the 2nd (0.02) HR. Laboratory health workers scored a 0.46 national average, with the highest results found in the 1st (0.62), 7th (0.53) and 4th (0.47) HRs. The lowest results were located in the 5th (0.35), and 2nd (0.34) HRs. As far as the total lab staff is concerned, the best ratios for total staff/1000 population were observed in the 1st (1.31) and 7th (1.06) HRs, while the worst in the 2nd (0.71) and 5th (0.67) HRs.
A.6 Major Hospital Diagnostic Laboratories/100.000 population
The national average of laboratories/100.000 population is 6.14, with the highest in the 7th (8.05), and 1st (7.48) HRs. The lowest results were observed in the 5th (4.7) and 2nd (4.27) HRs. Results for each category of diagnostic laboratories per HR are presented in Table 2.
Table 2.
Supply indicators: Major hospital diagnostic laboratories per 100.000 population for each HR and in total
| Supply indicators (N) | Total | 1st HR | 2nd HR | 3rd HR | 4th HR | 5th HR | 6th HR | 7th HR | ||||||||
|---|---|---|---|---|---|---|---|---|---|---|---|---|---|---|---|---|
| 663 | 179 | 91 | 64 | 91 | 60 | 128 | 50 | |||||||||
| Mean | Mean | Dev. | Mean | Dev. | Mean | Dev. | Mean | Dev. | Mean | Dev. | Mean | Dev. | Mean | Dev. | ||
| Microbiology | 1.16 | 1.02 | -0.14 | 1.01 | -0.15 | 1.22 | 0.06 | 1.11 | -0.05 | 1.02 | -0.14 | 1.6 | 0.44 | 1.29 | 0.13 | |
| Biochemistry | 0.3 | 0.59 | 0.29 | 0.28 | -0.02 | 0.08 | -0.22 | 0.24 | -0.06 | 0.08 | -0.22 | 0.16 | -0.14 | 0.64 | 0.34 | |
| Medical imaging | 1.17 | 1.1 | -0.07 | 1.02 | -0.15 | 1.22 | 0.05 | 1.05 | -0.12 | 1.01 | -0.16 | 1.55 | 0.38 | 1.29 | 0.12 | |
| Hematology | 0.66 | 0.82 | 0.16 | 0.51 | -0.15 | 0.61 | -0.05 | 0.62 | -0.04 | 0.62 | -0.04 | 0.66 | 0 | 0.8 | 0.14 | |
| Blood donor | 0.79 | 0.74 | -0.05 | 0.45 | -0.34 | 1.05 | 0.26 | 0.74 | -0.05 | 0.7 | -0.09 | 1.63 | 0.84 | 0.8 | 0.01 | |
| Pathologoanatomy | 0.64 | 0.82 | 0.18 | 0.4 | -0.24 | 0.7 | 0.06 | 0.62 | -0.02 | 0.39 | -0.25 | 0.83 | 0.19 | 0.64 | 0 | |
| Cytology | 0.44 | 0.7 | 0.26 | 0.34 | -0.1 | 0.44 | 0 | 0.31 | -0.13 | 0.15 | -0.29 | 0.55 | 0.11 | 0.32 | -0.12 | |
Note. “Dev” refers to the deviance of the respective indicator from the overall average.
Microbiology laboratories have a national average of 1.16/100.000 population, with the highest indicators in the 6th (1.6), 7th (1.29) and 3rd (1.22) HRs, and the lowest in the 1st (1.02) and 2nd (1.01) HRs.
Biochemistry laboratories have a national average of 0.3, with the highest observed in the 7th (0.64) and 1st (0.59) HRs and the lowest in the 3rd (0.08) and 5th (0.08) HRs.
Medical Imaging laboratories have a national average of 1.17, with the best outcome observed in the 6th (1.55) and 7th (1.55) HR and the lowest in the 1st (1.1).
Hematology laboratories have a national average of 0.66, with the highest results in the 1st (0.82) and 7th (0.8) HRs, while the lowest at the 2nd (0.51) and the 3rd (0.61) HRs.
Blood donor labs have a national average of 0.79 with the highest results found in the 6th (1.63) and 3rd (1.05) HRs, and the lowest in the 2nd (0.45) HR.
Pathologoanatomy laboratories have a national average of 0.64 labs/100.000 population with the highest ratios found in the 6th (0.83) and 1st (0.82) HRs, and the worst in the 5th (0.39) and 2nd (0.40) HRs.
Finally, cytology laboratories present a national average of 0.44 laboratories per 100.000 population, with the highest results found in the 1st (0.70) and 6th (0.55) HRs, and the lowest in the 5th (0.15) HR.
B. Performance Indicators for Hospital Clinics and Diagnostic Laboratories
B.1 Hospital Staff/Hospital Bed
The national average of hospital doctors per hospital bed is 0.49. The worst outcomes were observed in the 3rd, 5th, and 6th HRs with 0.45 and in the 4th and 7th regions with 0.46 doctors per hospital bed. As a result only the 1st HR has a rather good outcome with 0.57 doctors per hospital bed. In terms of nurses, the national average is 0.62 nurses/hospital bed, with the best outcomes observed in the 5th (0.71) HR, while the worst outcomes come from the 3rd (0.57) and 7th (0.58). As far as total staff per hospital bed is concerned, best results came from the 1st (1.20), and 5th (1.16) HRs, while the worst from the 3rd (1.02) and 7th (1.04) (Table 1).
B.2 Major Clinics Staff/Hospital Bed (Tables 3-4)
Table 3.
Performance indicators-major clinics’ doctors per hospital bed for each health region and in total
| Performance Indicators | Total | 1st HR | 2nd HR | 3rd HR | 4th HR | 5th HR | 6th HR | 7th HR | |||||||
|---|---|---|---|---|---|---|---|---|---|---|---|---|---|---|---|
| Mean | Mean | Dev. | Mean | Dev. | Mean | Dev. | Mean | Dev. | Mean | Dev. | Mean | Dev. | Mean | Dev. | |
| Internists/Bed | 0.52 | 0.51 | -0.01 | 0.5 | -0.02 | 0.5 | -0.02 | 0.56 | 0.04 | 0.58 | 0.06 | 0.51 | -0.01 | 0.48 | -0.04 |
| Surgery doctors/Bed | 0.46 | 0.47 | 0.01 | 0.54 | 0.08 | 0.44 | -0.02 | 0.45 | -0.01 | 0.45 | -0.01 | 0.44 | -0.02 | 0.44 | -0.02 |
| Cardiology doctors/Bed | 0.49 | 0.62 | 0.13 | 0.52 | 0.03 | 0.37 | -0.12 | 0.4 | -0.09 | 0.43 | -0.06 | 0.47 | -0.02 | 0.43 | -0.06 |
| Pediatrics doctors/Bed | 0.56 | 0.67 | 0.11 | 0.61 | 0.05 | 0.47 | -0.09 | 0.53 | -0.03 | 0.55 | -0.01 | 0.48 | -0.08 | 0.65 | 0.09 |
| ObGyn doctors/Bed | 0.41 | 0.48 | 0.07 | 0.42 | 0.01 | 0.44 | 0.03 | 0.39 | -0.02 | 0.35 | -0.06 | 0.37 | -0.04 | 0.39 | -0.02 |
| ICU doctors/Bed | 1.08 | 1.12 | 0.04 | 1.22 | 0.14 | 0.85 | -0.23 | 1.15 | 0.07 | 1.13 | 0.05 | 0.97 | -0.11 | 1.15 | 0.07 |
| Orthopedics doctors/Bed | 0.43 | 0.58 | 0.15 | 0.46 | 0.03 | 0.47 | 0.04 | 0.33 | -0.1 | 0.38 | -0.05 | 0.38 | -0.05 | 0.35 | -0.08 |
| Pneumonology doctors/Bed | 0.45 | 0.45 | 0 | 0.37 | -0.08 | 0.44 | -0.01 | 0.54 | 0.09 | 0.49 | 0.04 | 0.42 | -0.03 | 0.47 | 0.02 |
| Psychiatrics doctors/Bed | 0.39 | 1.06 | 0.67 | 0.14 | -0.25 | 0.55 | 0.16 | 0.48 | 0.09 | 0.75 | 0.36 | 0.54 | 0.15 | 0.4 | 0.01 |
| Ophthalmology doctors/Bed | 0.7 | 0.86 | 0.16 | 1.04 | 0.34 | 0.63 | -0.07 | 0.6 | -0.1 | 0.49 | -0.21 | 0.64 | -0.06 | 0.54 | -0.16 |
| Otolaryngology doctors/Bed | 0.56 | 0.67 | 0.11 | 0.6 | 0.04 | 0.55 | -0.01 | 0.43 | -0.13 | 0.58 | 0.02 | 0.51 | -0.05 | 0.51 | -0.05 |
Note. “Dev” refers to the deviance of the respective indicator from the overall average.
Table 4.
Performance indicators: Major clinics’ nurses per hospital bed for each health region and in total
| Performance Indicators | Total | 1st HR | 2nd HR | 3rd HR | 4th HR | 5th HR | 6th HR | 7th HR | |||||||
|---|---|---|---|---|---|---|---|---|---|---|---|---|---|---|---|
| Mean | Mean | Dev. | Mean | Dev. | Mean | Dev. | Mean | Dev. | Mean | Dev. | Mean | Dev. | Mean | Dev. | |
| Internal Medicine nurses/Bed | 0.52 | 0.51 | -0.01 | 0.5 | -0.02 | 0.5 | -0.02 | 0.56 | 0.04 | 0.58 | 0.06 | 0.51 | -0.01 | 0.48 | -0.04 |
| Surgery nurses/Bed | 0.53 | 0.48 | -0.05 | 0.64 | 0.11 | 0.49 | -0.04 | 0.53 | 0 | 0.61 | 0.08 | 0.54 | 0.01 | 0.48 | -0.05 |
| Cardiology nurses/Bed | 0.73 | 0.81 | 0.08 | 0.69 | -0.04 | 0.67 | -0.06 | 0.75 | 0.02 | 0.77 | 0.04 | 0.7 | -0.03 | 0.56 | -0.17 |
| Pediatrics nurses/Bed | 0.46 | 0.54 | 0.08 | 0.45 | -0.01 | 0.5 | 0.04 | 0.41 | -0.05 | 0.59 | 0.13 | 0.43 | -0.03 | 0.44 | -0.02 |
| Ob-Gyn nurses/Bed | 0.69 | 0.63 | -0.06 | 0.6 | -0.09 | 0.72 | 0.03 | 0.8 | 0.11 | 0.76 | 0.07 | 0.67 | -0.02 | 0.69 | 0 |
| ICU nurses/Bed | 2.92 | 2.76 | -0.16 | 2.88 | -0.04 | 2.15 | -0.77 | 3.8 | 0.88 | 3.62 | 0.7 | 2.93 | 0.01 | 2.98 | 0.06 |
| Orthopedics nurses/Bed | 0.42 | 0.52 | 0.1 | 0.3 | -0.12 | 0.5 | 0.08 | 0.44 | 0.02 | 0.37 | -0.05 | 0.42 | 0 | 0.3 | -0.12 |
| Pneumonology nurses/Bed | 0.47 | 0.48 | 0.01 | 0.33 | -0.14 | 0.49 | 0.02 | 0.47 | 0 | 0.79 | 0.32 | 0.48 | 0.01 | 0.44 | -0.03 |
| Psychiatrics nurses/Bed | 0.76 | 1.22 | 0.46 | 0.65 | -0.11 | 0.61 | -0.15 | 0.69 | -0.07 | 1.45 | 0.69 | 0.74 | -0.02 | 0.83 | 0.07 |
| Opthalmology nurses/Bed | 0.41 | 0.53 | 0.12 | 0.48 | 0.07 | 0.31 | -0.1 | 0.33 | -0.08 | 0.37 | -0.04 | 0.4 | -0.01 | 0.28 | -0.13 |
| Otolaryncology nurses/Bed | 0.38 | 0.37 | -0.01 | 0.32 | -0.06 | 0.29 | -0.09 | 0.45 | 0.07 | 0.34 | -0.04 | 0.42 | 0.04 | 0.47 | 0.09 |
Note. “Dev” refers to the deviance of the respective indicator from the overall average.
-
Internal medicine clinics
As for internists/hospital bed, the national average is 0.5 with the highest outcomes observed in the 1st (0.54), 4th (0.52) and 7th (0.51) HRs. The lowest outcomes were observed in the 2nd (0.48), 3rd (0.47), 5th (0.47) 6th (0.45) HRs. Internal medicine nurses have a national average of 0.52, with best results in the 5th (0.58) and 4th (0.56) HRs, and worst in the 2nd (0.5), 3rd (0.5) and 7th (0.48) HRs. As for total staff, internal medicine clinics present best results in the 1st (1.05), 4th (1.08) and 5th (1.05) HRs, and worst in the 2nd (0.98), 3rd (0.97) and 6th (0.96) HRs.
-
(General) Surgery Clinics
The national average of surgeons is 0.46, with better results coming from the 2nd (0.54) HR, and worst from the 3rd (0.44), 6th (0.44), and 7th (0.44) HRs. Surgery nurses are at a national average of 0.53, with the best results in the 2nd (0.64) and 5th (0.61) HRs, and the worst in the 1st (0.48), 3rd (0.49) and 7th (0.48) HRs. As far as total staffing of surgery clinics is concerned, best results can be found in the 2nd (1.18) and 5th (1.06) HRs, and worst in the 1st (0.95), 3rd (0.93) and 7th (0.92) HRs.
-
Cardiology Clinics
The national average of cardiologists per bed is 0.49. The best results came from the 1st (0.62) and the 2nd (0.52) HRs, and the worst from the 3rd (0.37) HR. Cardiology clinic nurses are at a national average of 0.73. Best results were observed in the 1st (0.81) and 5th (0.77) HRs, and worst in the 3rd (0.67) and 7th (0.56) HRs. As far as the total staff of cardiology clinics/bed is concerned, the best indicator results comes from the 1st (1.43) and 2nd (1.21) HRs and the worst from the 3rd (1.04) and 7th (0.99) HRs.
-
Pediatrics
The national average of pediatricians is 0.56. The highest ratio is in the 1st (0.67), 2nd (0.61) and 7th (0.65) HRs, and the lowest in the 3rd (0.47) and 6th (0.48). Pediatric nurses per hospital bed are on average 0.46. The best results in this respect come from the 5th (0.59), 1st (0.54) and 3rd (0.5) HRs, while the worst from the 4th (0.41) and 6th (0.43) HRs. As for total staff/bed, the best indicator is evident in the 1st (1.21) and 5th (1.14), while the worst in the 3rd (0.97), 4th (0.94), and 6th (0.91) HRs.
-
Obstetrics – Gynecology clinics
Obstetrics/gynecology doctors per bed are at a national average of 0.41. The best ratios are observed in the1st (0.48) and 3rd (0.44) HRs, and the worst in the 5th (0.35) and 6th (0.37). The national average of nurses in obstetrics-gynecology is 0.69. Thus, HRs exceeding the national average are the 4th (0.8) and 5th (0.7), whereas those lagging are the 2nd (0.62) and 6th (0.6). As for overall staff, the best indicators are from the 4th (1.19) and 3rd (1.16) HRs, while the worst from the 2nd (1.02) and 6th (1.04) HRs.
-
Intensive Care Units
Intensive care doctors per hospital bed are 1.08. The best outcomes were observed in the 2nd (1.22) HR, and the lowest in the 3rd (0.85). The national average for nurses is 2.92, with the highest results found in the 4th (3.8) and 5th (3.62) HRs. The worst HR was the 3rd (2.15). As for total staff, the best results came from the 4th (4.95), 5th (4.75), and 7th (4.13) HRs, while the worst from the 3th (3.0) and 6th (3.9) HRs.
-
Orthopedics
The national average of orthopedics doctors per hospital bed is 0.43. The best results were found in the 1st (0.58) HR, and the worst in the 4th (0.33). Orthopedics nurses are 0.42 per hospital bed. The best outcomes can be found in the 1st (0.52), 3rd (0.5) and 4th (0.44) HRs, and the worst in the 2nd (0.3) and 7th (0.3). When adding the number of doctors and nurses, the best indicators is in the 1st (1.1), 3rd (0.97) and 6th (0.8) HRs, and the worst in the 5th (0.2), 2nd (0.76), and 7th (0.65) HRs.
-
Pneumonology clinics
The average number of pneumonologists per hospital bed is 0.45. The highest ratio is in the 4th (0.54) HR and the lowest in the 2nd (0.37). Nursing staff have a national average of 0.47, which is exceeded by the 5th (0.79), 3rd (0.49) and 1st (0.48) HRs. As far as total staff is concerned, the best results were observed in the 4th (1.01) and 5th (1.28) HRs, and the worst in the 2nd (0.70) and 6th (0.9) HRs.
-
Psychiatric clinics
The national average of psychiatrists per hospital bed is 0.39. HRs exceeding this average were the 1st (1.06), 5th (0.75) and 3rd (0.55). The worst HR in terms of deviation from the national average was the 2nd (0.14). The national average of nurses/psychiatric beds is 0.76, with best outcomes found in the 1st (1.22) and 5th (1.45) HRs, and the worst in the 2nd and 3rd, with 0.65 and 0.61 respectively. As for doctors and nurses combined, the best outcomes come from the 1st (2.28) HR, and the worst from the 2nd (0.79).
-
Ophthalmology clinics
Ophthalmologists are at a national average ratio of 0.7 and HRs exceeding this figure are the 1st (0.85) and 2nd (1.04). Those lagging are the 5th (0.49) and 7th (0.54) HRs. As for nurses, their national average is 0.41. Again the best results for this indicator were found in the 1st (0.53), and 2nd (0.48) HRs, while the worst in the 7th (0.28), 3rd (0.31) and 4th (0.33). As for doctors and nurses combined, best outcomes were observed in the 1st (1.39) and 2nd (1.52) HRs, while the worst in the 5th (0.86) and 7th (0.82) HRs.
-
Otolaryngology clinics
Otolaryngologists (ENTs) have a national average of 0.56. HRs exceeding this limit are the 1st (0.67) and 2nd (0.6), and regions falling back are the 4th (0.43), 6th (0.51) and 7th (0.51). As for nurses, their national average is 0.38. Again the best results for this indicator were found in the 7th (0.47), 4th (0.45) and 6th (0.42) HRs, while the worst in the 2nd (0.32), 3rd (0.29) and 5th (0.34). As for overall staff, best results were observed for the 1st (1.04) and 7th (0.98) HRs, and worst for the 3rd (0.84), 4th (0.88), and 2nd (0.92) HRs.
6. Discussion
Starting from hospital beds per 1.000 population, even though OECD and EU-15 countries seem to do better than Greece in this ratio (4.8 and 5.3 respectively), one has to take into account that their respective indicators have been calculated with the inclusion of private hospital beds (OECD, 2013; WHO Regional Office for Europe, 2011). If private hospital beds were included in the present study, the hospital beds/1000 population indicator for Greece would increase to approximately 5 hospital beds (70% public and 30% private) per 1000 population. As a result, the indicator is further adjusted to 3.5 public hospital beds per 1000 population, including psychiatric hospital beds. Thus, HRs that surpass 3 hospital beds per 1000 population, perform rather well when compared to international standards, while the rest are required to add more hospital beds. Alternatively, a transfer of hospital beds is suggested according to two criteria, geographical proximity and the surplus of hospital beds in some HRs. According to the analysis, most HRs are above the national benchmark of 3 hospital beds/1000 population, and those lagging are the 2nd, 5th and 6th (though the latter is borderline, i.e. 2.83). Thus it is proposed, based on this research, to reduce beds in the 1st (-12%), 3rd (-8%) and 7th (-9%) HRs and to increase through transfers those in the 2nd (especially in the Aegean Islands) and 5th HRs (Table 5).
Table 5.
Reengineering or reshuffling of staff or staff transfers according to hospital beds for each health region and in total
| (HB)/Staff | N | 1st HR | 2nd HR | 3rd HR | 4th HR | 5th HR | 6th HR | 7th HR | ||||||||||||||
|---|---|---|---|---|---|---|---|---|---|---|---|---|---|---|---|---|---|---|---|---|---|---|
| (S) | (E) | (A) | (S) | (E) | (A) | (S) | (E) | (A) | (S) | (E) | (A) | (S) | (E) | (A) | (S) | (E) | (A) | (S) | (E) | (A) | ||
| (HB) | 31297 | 7426 | 8952 | -1526 | 5149 | 4098 | 1051 | 3339 | 3473 | -134 | 4720 | 4909 | -189 | 3583 | 2613 | 970 | 5258 | 5108 | 150 | 1822 | 2144 | -322 |
| (HD) | 15313 | 3622 | 5077 | -1455 | 2509 | 1934 | 575 | 1622 | 1561 | 61 | 2300 | 2292 | 8 | 1814 | 1177 | 637 | 2564 | 2278 | 286 | 882 | 994 | -112 |
| (HN) | 19320 | 4569 | 5630 | -1061 | 3166 | 2394 | 772 | 2048 | 2000 | 48 | 2901 | 3089 | -188 | 2289 | 1863 | 426 | 3233 | 3091 | 142 | 1114 | 1253 | -139 |
| Total (HS) | 34633 | 15617 | 19659 | -4042 | 10824 | 8426 | 2398 | 7009 | 7034 | -25 | 9921 | 10290 | -369 | 7686 | 5653 | 2033 | 11055 | 10477 | 578 | 3818 | 4391 | -573 |
(S):Suggested, (E):Existing, (A):Added;
(HB): Hospital Beds, (HD):Hospital Doctors, (HN):Hospital Nurses, Total (HS):Total Hospital Staff.
Supplementary to the above, it is important to note that it is proposed that relative changes be planned within the hospitals concerning the clinics-departments. Indicatively, in the 1st HR pneumonology clinics should be merged from 20 to 12 (and the beds respectively), while gynecology and pediatric clinics should be developed at selected large hospitals (redistributing existing beds). In the 2nd HR, psychiatric clinics should be merged from 13 to 7 (and the beds respectively), while orthopedic, pneumonology and ophthalmology clinics should be developed at selected hospitals (and the beds respectively on the islands). In the 3rd HR, ENT clinics should be merged from 12 to 9, while orthopedic beds should be reduced and psychiatric beds should be increased. In the 4th HR pneumonology clinics should be increased from 5 to 10 (and the beds respectively), and cardiology – orthopedic clinics from 14 to 17 (redistributing existing beds). In the 5th HR psychiatric clinics should be increased from 2 to 5 and ICU from 5 to 8 (and the beds respectively). In the 6th HR gynecology and pediatric clinics should be merged from 22 to 16 and from 19 to 14 respectively, while pneumonology clinics should be increased from 6 to 9 (and the beds respectively). Finally, in the 7th HR the proposal concerns a reduction of pneumonology and pediatric beds.
Concerning human resources ratios, the HRs exceeding 1.3 NHS doctors per 1.000 population score rather well, while the rest need to hire more doctors or transfer doctors from a nearby HR, that exceed 1.3 doctors per 1000 population, such as the 1st, the 3rd, the 4th and the 6th HRs. On the same line of analysis, HRs that need urgent staff support are the 2nd, and mostly the 5th HRs (Table 5). The issue of 2nd RHA is complicated because of many islands and needs further consideration concerning HR transfers. 5th RHA must be supported mainly from 3rd and 4th. The HRs that exceed the ratio of 1.7 nursing staff per 1.000 population are performing rather well, while regions below this threshold need to be supported with additional nursing staff. Alternatively to hiring around 3000 nursing staff, it is suggested to reshuffle nurses between the regions that are close enough and exceed or lag from the national average. According to the analysis of the raw data collected from the public hospitals all over the country, the 1st, 4th, 7th, and marginally the 3rd (1.75) and the 6th (1.71) fulfill the threshold of 1.7 nurses per 1000 population. The ones that fail to reach the threshold, the 2nd and the 5th, need support from either the 1st or the 3rd and the 4th HR respectively. The situation in regard to other (non-medical and non-nursing hospital staff) is almost similar (Table 5).
Specific reference should be made for the reengineering of ESY hospital laboratories. Mergers are needed in the 1st, 6th and 7th HR, especially in biochemistry (1st and 7th) and microbiology, as well as in medical imaging labs (6th). The remaining HR need selected improvements, e.g. the 2nd HR (blood banks and pathologoanatomy labs), the 4th HR (cytology labs) and a few biochemistry labs in the 3rd and 5th HR (Table 6).
Table 6.
Reengineering of reshuffling of hospital laboratories per health region
| Laboratories/HR | Total (N=561) | 1st HR | 2nd HR | 3rd HR | 4th HR | 5th HR | 6th HR | 7th HR | ||||||||||||||
|---|---|---|---|---|---|---|---|---|---|---|---|---|---|---|---|---|---|---|---|---|---|---|
| (S) | (E) | (A) | (S) | (E) | (A) | (S) | (E) | (A) | (S) | (E) | (A) | (S) | (E) | (A) | (S) | (E) | (A) | (S) | (E) | (A) | ||
| Microbiology | 126 | 30 | 26 | 4 | 20 | 18 | 2 | 14 | 14 | 0 | 19 | 18 | 1 | 15 | 13 | 2 | 21 | 29 | -8 | 7 | 8 | -1 |
| Biochemistry | 33 | 9 | 15 | -6 | 5 | 5 | 0 | 3 | 1 | 2 | 5 | 4 | 1 | 4 | 1 | 3 | 5 | 3 | 2 | 2 | 4 | -2 |
| Medical imaging | 126 | 30 | 28 | 2 | 21 | 18 | 3 | 13 | 14 | -1 | 19 | 17 | 2 | 15 | 13 | 2 | 21 | 28 | -7 | 7 | 8 | -1 |
| Hematology | 72 | 18 | 21 | -3 | 12 | 9 | 3 | 7 | 7 | 0 | 11 | 10 | 1 | 8 | 8 | 0 | 12 | 12 | 0 | 4 | 5 | -1 |
| Blood donor | 86 | 21 | 19 | 2 | 14 | 8 | 6 | 9 | 12 | -3 | 13 | 12 | 1 | 10 | 9 | 1 | 14 | 21 | -7 | 5 | 5 | 0 |
| Pathologoanatomy | 70 | 17 | 21 | -4 | 12 | 7 | 5 | 8 | 8 | 0 | 10 | 10 | 0 | 8 | 5 | 3 | 11 | 15 | -4 | 4 | 4 | 0 |
| Cytology | 48 | 11 | 18 | -7 | 8 | 6 | 2 | 5 | 5 | 0 | 7 | 5 | 2 | 6 | 2 | 4 | 8 | 10 | -2 | 3 | 2 | 1 |
Finally tables 7 and 8 present the reengineering and reshuffling of hospital doctors and nurses of the hospital clinics-departments of the main specialties. Transfers of doctors are proposed from the 1st HR (Athens) to the 2nd HR (mainly islands), orthopedic doctors from the 3rd to the 4th HR and internal medicine doctors from the 4th to the 3rd HR (both mainly within Salonika), general surgery doctors from the 3rd and 4th to the 5th HR, which needs doctors in other specialties as well (transferred from other HRs). On the other hand, nurses’ shortage is obvious all over the country. Because of the current restrictions to hire new personnel, as a result of the economic crisis, our suggestion is a selected transfer of nurses between neighboring HRs like 1st to 2nd, 4th to 3rd and 6th to 5th.
Table 7.
Reengineering or reshuffling of hospital doctors of major hospital clinics per health region and in total
| Hospital doctors of major clinics (N) | Total (N) Doctors | 1st HR | 2nd HR | 3rd HR | 4th HR | 5th HR | 6th HR | 7th HR | |||||||||||||||
|---|---|---|---|---|---|---|---|---|---|---|---|---|---|---|---|---|---|---|---|---|---|---|---|
| (S) | (E) | (A) | (S) | (E) | (A) | (S) | (E) | (A) | (S) | (E) | (A) | (S) | (E) | (A) | (S) | (E) | (A) | (S) | (E) | (A) | |||
| Internal Medicine | 2726 | 647 | 814 | -167 | 446 | 396 | 50 | 288 | 258 | 30 | 409 | 428 | -19 | 322 | 233 | 89 | 457 | 452 | 5 | 157 | 145 | 12 | |
| Surgery | 1927 | 454 | 539 | -85 | 316 | 272 | 44 | 205 | 222 | -17 | 288 | 323 | -35 | 229 | 160 | 69 | 321 | 315 | 6 | 114 | 96 | 18 | |
| Cardiology | 1275 | 302 | 450 | -148 | 209 | 173 | 36 | 135 | 121 | 14 | 192 | 158 | 34 | 151 | 100 | 51 | 213 | 199 | 14 | 73 | 74 | -1 | |
| Pediatrics | 1085 | 256 | 278 | -22 | 178 | 122 | 56 | 116 | 108 | 8 | 164 | 191 | -27 | 129 | 82 | 47 | 181 | 211 | -30 | 61 | 93 | -32 | |
| Ob-Gyn | 895 | 211 | 224 | -13 | 147 | 123 | 24 | 96 | 101 | -5 | 134 | 143 | -9 | 106 | 77 | 29 | 149 | 166 | -17 | 52 | 61 | -9 | |
| ICU | 660 | 150 | 230 | -80 | 107 | 99 | 8 | 73 | 68 | 5 | 99 | 83 | 16 | 81 | 51 | 30 | 108 | 77 | 31 | 42 | 52 | -10 | |
| Orthopedics | 1096 | 260 | 380 | -120 | 179 | 122 | 57 | 114 | 136 | -22 | 164 | 127 | 37 | 129 | 106 | 23 | 186 | 161 | 25 | 64 | 64 | 0 | |
| Pneumonology | 545 | 126 | 267 | -141 | 88 | 38 | 50 | 58 | 59 | -1 | 83 | 45 | 38 | 69 | 31 | 38 | 90 | 61 | 29 | 31 | 44 | -13 | |
| Psychiatrics | 387 | 92 | 126 | -34 | 63 | 70 | -7 | 41 | 40 | 1 | 58 | 60 | -2 | 46 | 15 | 31 | 64 | 47 | 17 | 23 | 29 | -6 | |
| Ophthalmology | 620 | 147 | 210 | -63 | 102 | 77 | 25 | 66 | 68 | -2 | 93 | 97 | -4 | 73 | 51 | 22 | 103 | 83 | 20 | 36 | 34 | 2 | |
| Otolaryngology | 526 | 121 | 165 | -44 | 86 | 81 | 5 | 57 | 62 | -5 | 79 | 68 | 11 | 64 | 48 | 16 | 87 | 64 | 23 | 32 | 38 | -6 | |
(S): Suggested, (E): Existing, (A):Added.
Table 8.
Reengineering or reshuffling of hospital nurses of major hospital clinics per health region and in total
| Hospital nurses of major clinics (N) | Total (N) Nurses | 1st HR | 2nd HR | 3rd HR | 4th HR | 5th HR | 6th HR | 7th HR | ||||||||||||||
|---|---|---|---|---|---|---|---|---|---|---|---|---|---|---|---|---|---|---|---|---|---|---|
| (S) | (E) | (A) | (S) | (E) | (A) | (S) | (E) | (A) | (S) | (E) | (A) | (S) | (E) | (A) | (S) | (E) | (A) | (S) | (E) | (A) | ||
| Internal Medicine | 2854 | 676 | 760 | -84 | 467 | 419 | 48 | 303 | 279 | 24 | 429 | 456 | -27 | 338 | 287 | 51 | 478 | 515 | -37 | 163 | 138 | 25 |
| Surgery | 2218 | 521 | 558 | -37 | 363 | 320 | 43 | 237 | 245 | -8 | 333 | 370 | -37 | 264 | 217 | 47 | 371 | 402 | -31 | 129 | 106 | 23 |
| Cardiology | 1903 | 449 | 586 | -137 | 312 | 229 | 83 | 202 | 221 | -19 | 287 | 294 | -7 | 226 | 182 | 44 | 318 | 294 | 24 | 109 | 97 | 12 |
| Pediatrics | 896 | 211 | 224 | -13 | 147 | 90 | 57 | 95 | 96 | -1 | 135 | 148 | -13 | 106 | 88 | 18 | 150 | 187 | -37 | 52 | 63 | -11 |
| Ob-Gyn | 1504 | 354 | 294 | 60 | 246 | 173 | 73 | 160 | 172 | -12 | 226 | 294 | -68 | 179 | 163 | 16 | 251 | 301 | -50 | 88 | 107 | -19 |
| ICU | 1774 | 404 | 565 | -161 | 286 | 234 | 52 | 196 | 172 | 24 | 266 | 274 | -8 | 216 | 163 | 53 | 292 | 232 | 60 | 114 | 134 | -20 |
| Orthopedics | 1084 | 257 | 343 | -86 | 178 | 78 | 100 | 114 | 149 | -35 | 163 | 171 | -8 | 128 | 105 | 23 | 182 | 182 | 0 | 62 | 56 | 6 |
| Pneumonology | 576 | 134 | 281 | -147 | 94 | 34 | 60 | 63 | 62 | 1 | 87 | 38 | 49 | 72 | 50 | 22 | 94 | 70 | 24 | 32 | 41 | -9 |
| Psychiatrics | 749 | 177 | 144 | 33 | 123 | 322 | -199 | 81 | 44 | 37 | 113 | 85 | 28 | 89 | 29 | 60 | 123 | 65 | 58 | 43 | 60 | -17 |
| Ophthalmology | 362 | 86 | 130 | -44 | 59 | 36 | 23 | 39 | 33 | 6 | 54 | 54 | 0 | 43 | 38 | 5 | 60 | 53 | 7 | 21 | 18 | 3 |
| Otolaryngology | 353 | 83 | 90 | -7 | 57 | 43 | 14 | 38 | 33 | 5 | 53 | 71 | -18 | 42 | 28 | 14 | 58 | 53 | 5 | 22 | 35 | -13 |
(S): Suggested, (E): Existing, (A): Added.
This research has its own limitations. First of all it may need further examination of the statistics and secondly further evaluation of local needs. However, policy makers have a tool that combines elements of supply (ESY) and demand (population). This effort should be combined with past proposals in order to improve distribution of units, beds and staff, mainly within HRs and inside the hospitals. This rationality of resources will decrease operational costs and secure better access to the population. We also hope that our research enhances the scientific dialogue among the various experts and institutions of the country and abroad to the reengineering issue of merging through redistribution.
References
- Ahgren B. Is it better to be big? The reconfiguration of 21st century hospitals: responses to a hospital merger in Sweden. Health Policy. 2008;87(1):92–99. doi: 10.1016/j.healthpol.2008.02.001. http://dx.doi.org/10.1016/j.healthpol.2008.02.001 . [DOI] [PubMed] [Google Scholar]
- Aletras A, Kontodimopoulos N, Zagouldoudis A, Niakas D. The short-term effect on technical and scale efficiency of establishing regional health systems and general management in Greek NHS hospitals. Health Policy. 2007;83(2-3):236–245. doi: 10.1016/j.healthpol.2007.01.008. http://dx.doi.org/10.1016/j.healthpol.2007.01.008 . [DOI] [PubMed] [Google Scholar]
- Aletras V. A. Comparison of hospital scale effects in short-run and long-run cost functions. Health Economics. 1999;8(6):521–530. doi: 10.1002/(sici)1099-1050(199909)8:6<521::aid-hec462>3.0.co;2-g. http://dx.doi.org/10.1002/(SICI)1099-1050(199909)8:6<521::AID-HEC462>3.0.CO;2-G . [DOI] [PubMed] [Google Scholar]
- Athanassopoulos A, Gounaris C. Assessing the technical and allocative efficiency of hospital operations in Greece and its resource allocation implications. European Journal of Operations Research. 2001;133(2):416–431. http://dx.doi.org/10.1016/S0377-2217(00)00180-6 . [Google Scholar]
- Athanassopoulos A, Gounaris C, Sissouras A. A descriptive assessment of the production and cost efficiency of general hospitals in Greece. Health Care Management Science. 1999;2(2):97–106. doi: 10.1023/a:1019023408924. http://dx.doi.org/10.1023/A:1019023408924 . [DOI] [PubMed] [Google Scholar]
- Dafny L. Estimation and identification of merger effects: an application to hospital mergers. Journal of Law and Economics. 2009;52(3):523–550. http://dx.doi.org/10.1086/600079 . [Google Scholar]
- Davaki K, Mossialos E. Plus ça change: Health sector reforms in Greece. Journal of Health Politics, Policy and Law. 2005;30(1-2):143–167. doi: 10.1215/03616878-30-1-2-143. http://dx.doi.org/10.1215/03616878-30-1-2-143 . [DOI] [PubMed] [Google Scholar]
- Dowie R, Gravelle H. Changes in medical training and sub-specialization: implications for service delivery. In: Ferguson B, Sheldon T, Posnett J, editors. Concentration and choice in healthcare. London: Royal Society of Medicine; 1997. pp. 51–65. [Google Scholar]
- Ferguson B, Sheldon T, Posnett J. Concentration and choice in healthcare. London: Royal Society of Medicine; 1997. [Google Scholar]
- Ferguson B, Goddard M. The case for and against mergers. In: Ferguson B, Sheldon T, Posnett J, editors. Concentration and choice in healthcare. London: Royal Society of Medicine; 1997. pp. 67–82. [Google Scholar]
- Flokou A, Kontodimopoulos N, Niakas D. Employing post-DEA cross-evaluation and cluster analysis in a sample of Greek NHS hospitals. Journal of Medical Systems. 2011;35(5):1001–1014. doi: 10.1007/s10916-010-9533-9. http://dx.doi.org/10.1007/s10916-010-9533-9 . [DOI] [PubMed] [Google Scholar]
- Fulop N, Protopsaltis G, Hutchings A, King A, Allen P, Normand C, Walters R. The process and impact of NHS trust mergers: a multi-centre organizational study and management cost analysis. BMJ. 2002;325:246–249. doi: 10.1136/bmj.325.7358.246. http://dx.doi.org/10.1136/bmj.325.7358.246 . [DOI] [PMC free article] [PubMed] [Google Scholar]
- Gaynor M, Laudicella M, Propper C. Can governments do it better? Merger mania and hospital outcomes in the English NHS. Journal of Health Economics. 2012;31(3):528–543. doi: 10.1016/j.jhealeco.2012.03.006. http://dx.doi.org/10.1016/j.jhealeco.2012.03.006 . [DOI] [PubMed] [Google Scholar]
- Giokas D. I. Greek hospitals: how well their resources are used? Omega. 2001;29(1):73–83. http://dx.doi.org/10.1016/S0305-0483(00)00031-1 . [Google Scholar]
- Haas-Wilson D, Garmon C. Hospital mergers and competitive effects: two retrospective analyses. International Journal of the Economics of Business. 2011;18(1):17–32. http://dx.doi.org/10.1080/13571516.2011.542952 . [Google Scholar]
- Ho V, Hamilton B. Hospital mergers and acquisitions: does hospital consolidation harm patients? Journal of Health Economics. 2000;19(5):767–791. doi: 10.1016/s0167-6296(00)00052-7. http://dx.doi.org/10.1016/S0167-6296(00)00052-7 . [DOI] [PubMed] [Google Scholar]
- Hutchings A, Allen P, Fulop N, King A, Protopsaltis G, Normand C, Rhiannon W. The process and impact of trust mergers in the National Health Service: a financial perspective. Public Money and Management. 2003;23(2):103–112. http://dx.doi.org/10.1080/09540962.2003.10874831 . [Google Scholar]
- Kastanioti C, Kontodimopoulos N, Stasinopoulos D, Kapetaneas N, Polyzos N. Public procurement of health technologies in Greece in an era of economic crisis. Health Policy. 2013;109(1):7–13. doi: 10.1016/j.healthpol.2012.03.015. http://dx.doi.org/10.1016/j.healthpol.2012.03.015 . [DOI] [PubMed] [Google Scholar]
- Kjekshus L, Hagen T. Do hospital mergers increase hospital efficiency? Evidence from a National Health Service country. Journal of Health Services Research & Policy. 2007;12(4):230–235. doi: 10.1258/135581907782101561. http://dx.doi.org/10.1258/135581907782101561 . [DOI] [PubMed] [Google Scholar]
- Kontodimopoulos N, Kastanioti C, Thireos E, Karanikas H, Polyzos N. The contribution of generic substitution to rationalizing pharmaceutical expenditure in Greek public hospitals under recent economic crisis. Journal of Pharmaceutical Health Services Research. 2013;4(4):211–216. http://dx.doi.org/10.1111/jphs.12032 . [Google Scholar]
- Kontodimopoulos N, Nanos P, Niakas D. Balancing efficiency of health services and equity of access in remote areas in Greece. Health Policy. 2006;76(1):49–57. doi: 10.1016/j.healthpol.2005.04.006. http://dx.doi.org/10.1016/j.healthpol.2005.04.006 . [DOI] [PubMed] [Google Scholar]
- Kounetas K, Papathanassopoulos F. How efficient are Greek hospitals? A case study using a double bootstrap DEA approach. European Journal of Health Economics. 2013;14(6):979–94. doi: 10.1007/s10198-012-0446-z. http://dx.doi.org/10.1007/s10198-012-0446-z . [DOI] [PubMed] [Google Scholar]
- Krishnan R. Market restructuring and pricing in the hospital industry. Journal of Health Economics. 2001;20(2):213–37. doi: 10.1016/s0167-6296(00)00076-x. http://dx.doi.org/10.1016/S0167-6296(00)00076-X . [DOI] [PubMed] [Google Scholar]
- Liaropoulos L, Siskou O, Kontodimopoulos N, Kaitelidou D, Lazarou P, Spinthouri M, Tsavalias K. Restructuring the hospital sector in Greece in order to improve effectiveness and efficiency. Social Cohesion and Development. 2012;7:53–68. [Google Scholar]
- McClenahan J. Emerging problems with merger policy. In: Appleby J, Harrison A, editors. Health care UK 1999/2000: the King’s Fund review of health policy. London: King’s Fund; 1999. pp. 94–97. [Google Scholar]
- Mossialos E, Allin S, Davaki K. Analysing the Greek health system: A tale of fragmentation and inertia. Health Economics. 2005;14(S1):S151–S168. doi: 10.1002/hec.1033. http://dx.doi.org/10.1002/hec.1033 . [DOI] [PubMed] [Google Scholar]
- Mossialos E, Allin S. Interest groups and health system reform in Greece. West European Politics. 2005;28(2):420–444. http://dx.doi.org/10.1080/01402380500060460 . [Google Scholar]
- Nikolentzos A, Mays N. Can existing theories of health care reform explain the Greek case, 1983-2001? Journal of European Social Policy. 2008;18(2):163–176. http://dx.doi.org/10.1177/0958928707087592 . [Google Scholar]
- OECD. [accessed 24 September 2013];OECD Health Data: Health care utilisation, OECD Health Statistics [online database] [Google Scholar]
- Polyzos N. A three-year Performance Evaluation of the NHS Hospitals in Greece. Hippokratia. 2012;16:350–355. [PMC free article] [PubMed] [Google Scholar]
- Polyzos N, Karanikas H, Thireos E, Kastanioti C, Kontodimopoulos N. Reforming reimbursement of public hospitals in Greece during the economic crisis: Implementation of a DRG system. Health Policy. 2013;109(1):14–22. doi: 10.1016/j.healthpol.2012.09.011. http://dx.doi.org/10.1016/j.healthpol.2012.09.011 . [DOI] [PubMed] [Google Scholar]
- Smith R. How to best organise acute hospital services? BMJ. 2001;323:245–246. doi: 10.1136/bmj.323.7307.245. http://dx.doi.org/10.1136/bmj.323.7307.245 . [DOI] [PMC free article] [PubMed] [Google Scholar]
- Spang H, Bazzoli G, Arnould R. Hospital mergers and savings for consumers: exploring new evidence. Health Affairs. 2001;20(4):150–158. doi: 10.1377/hlthaff.20.4.150. http://dx.doi.org/10.1377/hlthaff.20.4.150 . [DOI] [PubMed] [Google Scholar]
- Tenn S. The price effects of hospital mergers: A case study of the Sutter–Summit transaction. International Journal of the Economics of Business. 2011;18(1):65–82. http://dx.doi.org/10.1080/13571516.2011.542956 . [Google Scholar]
- Thompson E. The effect of hospital mergers on inpatient prices: A case study of the new Hanover-cape fear transaction. International Journal of the Economics of Business. 2011;18(1):91–101. http://dx.doi.org/10.1080/13571516.2011.542958 . [Google Scholar]
- Tountas Y, Karnaki P, Pavi E. Reforming the Reform-The Greek National Health System in Transition. Health Policy. 2002;62(1):15–29. doi: 10.1016/s0168-8510(01)00217-2. http://dx.doi.org/10.1016/S0168-8510(01)00217-2 . [DOI] [PubMed] [Google Scholar]
- Tountas Y, Oikonomou N, Palikarona G, Dimitrakaki C, Tzavara C, Souliotis K, Niakas D. Sociodemographic and socioeconomic determinants of health services utilization in Greece: The Hellas Health I study. Health Services Management Research. 2011;24(1):8–18. doi: 10.1258/hsmr.2010.010009. http://dx.doi.org/10.1258/hsmr.2010.010009 . [DOI] [PubMed] [Google Scholar]
- Town R, Wholey D, Feldman R, Burns L. The welfare consequences of hospital mergers. NBER Working Paper; No. 12244. 2006 [Google Scholar]
- Tragakes E, Polyzos N. The evolution of health care reforms in Greece: Charting a course of change. International Journal of Health Planning and Management. 1998;13(2):107–130. doi: 10.1002/(SICI)1099-1751(199804/06)13:2<107::AID-HPM508>3.0.CO;2-O. http://dx.doi.org/10.1002/(SICI)1099-1751(199804/06)13:2<107::AID-HPM508>3.0.CO;2-O . [DOI] [PubMed] [Google Scholar]
- Vandoros S, Stargardt T. Reforms in the Greek pharmaceutical market during the financial crisis. Health Policy. 2013;109(1):1–6. doi: 10.1016/j.healthpol.2012.08.016. http://dx.doi.org/10.1016/j.healthpol.2012.08.016 . [DOI] [PubMed] [Google Scholar]
- WHO Regional Office for Europe. European health for all [online database] Copenhagen: WHO Regional Office for Europe; 2013. [Retrieved September 24, 2013]. from http://www.euro.who.int/hfadb . [Google Scholar]