Abstract
Background:
Mobile networks and smartphones are growing in developing countries. Expert telemedicine consultation will become more convenient and feasible. We wanted to report on our experience in using a smartphone and a 3-D printed adapter for capturing microscopic images.
Methods:
Images and videos from a gastrointestinal biopsy teaching set of referred cases from the AFIP were captured with an iPhone 5 smartphone fitted with a 3-D printed adapter. Nine pathologists worldwide evaluated the images for quality, adequacy for telepathology consultation, and confidence rendering a diagnosis based on the images viewed on the web.
Results:
Average Likert scales (ordinal data) for image quality (1=poor, 5=diagnostic) and adequacy for diagnosis (1=No, 5=Yes) had modes of 3 and 4, respectively. Adding a video overview of the specimen improved diagnostic confidence. The mode of confidence in diagnosis based on the images reviewed was four. In 31 instances, reviewers’ diagnoses completely agreed with AFIP diagnosis, with partial agreement in 9 and major disagreement in 5. There was strong correlation between image quality and confidence (r = 0.78), image quality and adequacy of image (r = 0.73) and whether images were found adequate when reviewers were confident (r = 0.72). Intraclass Correlation for measuring reliability among the four reviewers who finished a majority of cases was high (quality=0.83, adequacy= 0.76 and confidence=0.92).
Conclusions:
Smartphones allow pathologists and other image dependent disciplines in low resource areas to transmit consultations to experts anywhere in the world. Improvements in camera resolution and training may mitigate some limitations found in this study.
Keywords: Digital pathology, image quality, telepathology, telemedicine, 3-D printer
INTRODUCTION
In 2011, developing countries surpassed developed countries in smartphone connections and will likely account for a majority of connections in the future.[1] Emerging areas of the world will propel the continued expansion in global connectivity as prices of mobile devices continue to fall and more people discover mobile wireless networks to be affordable and convenient routes to the Internet. The implications for clinicians practicing in low resource areas are enormous. As mobile networks and smartphones become more reasonably priced and pervasive, real-time or near real-time expert consultation will become more possible.
There are many examples of innovative use of mobile phones for telemedicine reported in the literature, including: Offsite readings of computed tomography images for appendicitis,[2] stroke diagnosis,[3] directly observed therapy for sickle cell patients[4] and in ophthalmology.[5,6] In addition, hundreds of apps, both free and paid, are available in the iTunes and Google Play stores for both health professionals and consumers.
Specialists and primary care providers are often concentrated in major cities in the US and globally so the need for experts in remote locations is high.[7] Delays in diagnosis and treatment could lead to increased morbidity. Telemedicine and telepathology may alleviate the commonly recognized shortage of pathologists in the United States and elsewhere worldwide.[8,9]
Smartphone adapters optimize the acquisition of microscopic images although capturing good images is possible with a steady hand.[10] In this paper, we report on our experience in setting up a microscope fitted with a smartphone adapter and simulating the process for submitting images for consultation and the results of pathologists’ evaluation of images digitized with an iPhone fitted with a 3-D printed microscope adapter. The emphasis in this study was the evaluation of the quality of videos and images presented to the reviewer, not necessarily the accuracy of diagnosis. The study attempted to answer the question, “Are images taken using a mobile phone adequate for diagnosis?”
METHODS
The images and video overviews were taken by one of the authors (PF), a pathologist experienced in telelpathology, with an iPhone 5 smartphone (8-megapixel back-illuminated sensor, autofocus) attached to an Olympus BX 41 microscope using a Universal Camera Phone/Microscope Adapter (http://www.thingiverse.com/thing: 78071) printed on a ZPrinter 650 3-D printer [Figure 1]. The source of the 10 slides was a well-characterized teaching set of gastrointestinal biopsies referred to the Division of Gastrointestinal Pathology at the Armed Forces Institute of Pathology (AFIP). The digitized images and videos were either sent by E-mail or save on universal serial bus disks then uploaded to a website developed to allow pathologist colleagues experienced in telepathology (as consultants and/or had referred consultations) contacted by E-mail to review cases online. Image files were archived in uncompressed joint photograph expert group while video files were in uncompressed metal-oxide varistor format, which required QuickTime plugin. After reviewing the images, they completed a web form with questions [Table 1] on image quality, adequacy for diagnosis, usefulness of video overviews and confidence in diagnosis in a 5-point Likert scale, their previous telepathology experience and diagnostic opinions. Reviewers’ responses were stored in a database for analysis.
Figure 1.
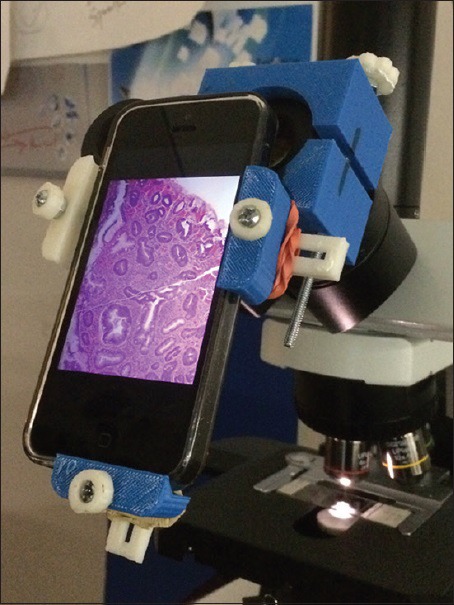
IPhone 5 smartphone attached to a microscope through a 3D printed adapter. Rubber bands were needed to stabilize the adapter
Table 1.
The evaluation questionnaire
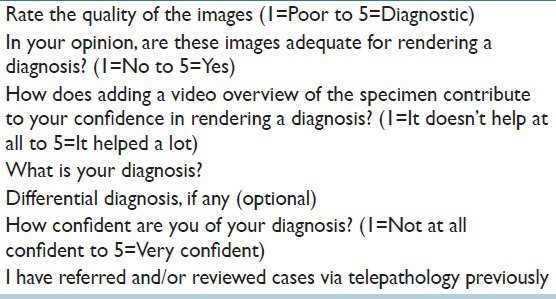
The questionnaire responses were analyzed both as ordinal and interval data using parametric and nonparametric methods. Likert scales (ordinal data) were measured by determining the mode and percentages of score frequencies. However, in order to calculate correlation coefficients of research questions using Pearson correlation, we also assumed that the intervals between Likert scales were symmetrical and means and standard deviations were calculated.[11,12]
Pearson product-moment correlation coefficients were calculated for values measured. A value from 0.5 to 1 was defined as strong positive correlation; a value from 0.25 to 0.49 as moderate correlation; a value from 0.1 to 0.24 as positive weak correlation. A value from − 0.1 to 0.1 was defined as no correlation; any value below − 0.1 was considered as negative correlation. Data on prior telepathology experience in reviewing (expert pathologist or center providing primary or second opinion diagnosis) or referring (pathologist in a remote location referring cases to an expert pathologist or center) cases were specified as Boolean values (true or false, i.e. 1 or 0).
The reviewers’ diagnosis was compared with the AFIP diagnosis (reference diagnosis) by one of the authors (PF) as previously described.[13] A score of “3” signified complete agreement with reference diagnosis; in minor disagreement (score = 2) if only minimal variance in terminology was found, which would imply no alteration in management, or in major disagreement (score = 1) if the discrepancy was significant and would likely require a change in management, such as a diagnosis of benign to malignant or vice versa. The diagnostic accuracy for each case was also derived to assess the level of difficulty for each case. A link to the diagnosis of each case was provided after submission of the evaluation of the last case (case 10) in the study set.
To analyze the reliability of the reviewers’ diagnosis, we analyzed the intraclass correlation (ICC) among the four reviewers who finished a majority of cases using Real Statistics data analysis tool, a data reliability analysis software package supplied in the Real Statistics resource pack based on Excel's ANOVA two factor without Replication data analysis.[14] The alpha value was set to 0.05.
The National Institutes of Health (NIH) Office of Human Subjects Research had designated this research as exempt from Institutional Review Board review.
RESULTS
All responses were submitted and stored anonymously. We have no data on the total number of pathologists who received requests for participation, but nine pathologists from several geographic locations worldwide participated in this study for a total of 45 reviews (three completed 10 cases; one, 9 cases and the rest between 1 and 2 cases). Videos were reviewed in only 30 of 45 instances. The most common comment for failing to view videos was that the “video did not open.” Some of those who reviewed the videos commented that the video, “gives good overview of entire tissue section” and that it allowed them to “assess better” because it permitted them to view the entire lesion.
Likert scale scores of 45 reviews were calculated using nonparametric methods as stated above. Likert frequency scores were generally expressed from 1 = worst to 5 = best [Table 2]. When Likert scores of 3 and above were combined, the percentages totaled 75.6% for image quality, 80.0% for adequacy, and 77.8% for confidence and 73.3% video overviews.
Table 2.
Likert scale score of 45 reviews
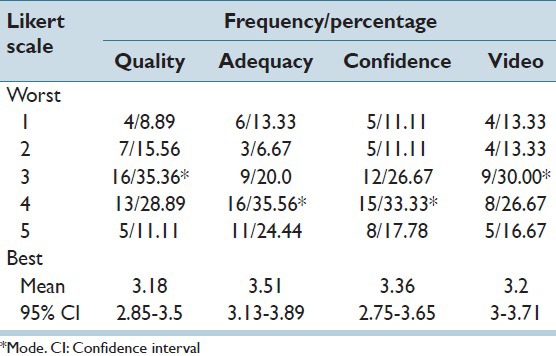
Attributes of digitized images, considered for this purpose as symmetrical data, was analyzed by determining the means and confidence interval of evaluators’ opinions on the quality of images, adequacy for rendering a diagnosis, confidence in their diagnosis and contribution of video overviews to the diagnostic process. The average Likert scale ratings for image quality (1 = poor to 5 = diagnostic) and adequacy for diagnosis (1 = no to 5 = yes) had means of 3.18 and 3.51, with 95% confidence intervals (CIs) (2.85, 3.5) and (3.13, 3.89) respectively. Adding a video overview of the specimen improved diagnostic confidence mean = 3.2, 95% CI (3, 3.71). Confidence on diagnosis based on the images reviewed averaged 3.36, 95% CI (2.75, 3.65).
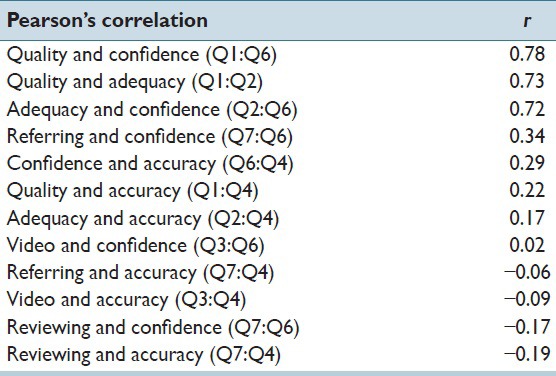
Pearson's correlation using Microsoft Excel 2007 was calculated to determine correlations between the characteristics measured is shown in Table 3. It indicated strong correlation between image quality and confidence in diagnosis (r = 0.78), image quality and adequacy of images (r = 0.73), and adequacy of images and confidence (r = 0.72). Confidence was moderately correlated to both referring cases (r = 0.34) and accuracy of diagnosis (r = 0.29). Accuracy was weakly correlated to both quality (r = 0.22) and adequacy of images (r = 0.17). Reviewing cases had a weak negative correlation with confidence (r = −0.17) and diagnostic accuracy (r = −0.19). No correlations were found between video and confidence, referring and accuracy, and video and accuracy. Seven of nine pathologists indicated that they had prior experience in reviewing telepathology consultations while two had previously sent telepathology consults. The diagnostic opinions of 31 reviews (69%) agreed with AFIP diagnosis whereas nine (20%) had minor disagreements. In five reviews (11%), there were major disagreements.
Table 3.
Pearson’s correlation of image features measured
Reviewers also provided comments on some questions. For quality, most of the comments pertained to color (“poor color, too red,” “pale color,” “poor color”) and focus, “too blurry,” “not in focus in all areas”). “Poor contrast” was mentioned as well. Viewing video overviews was the most challenging for evaluators where in only 30/45 instances were reviewers able to evaluate them. In 11 instances, the comment was, “video did not open.” However, those who reviewed videos found the overviews useful. Comments included, “shows the entire lesion”, “gives a relation for the findings within the static images,” “gives good overview of entire tissue section” and “it provides a panoramic scan at low power.” Some even stated that, the “video is slightly better than the static images.”
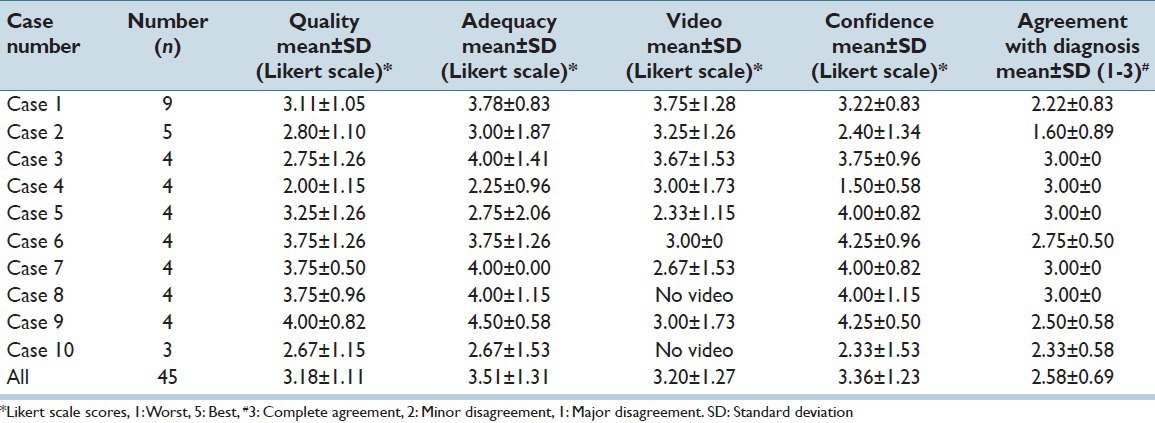
Table 4 shows data calculated from individual cases and overall. In 50% of cases, reviewers’ diagnostic opinions agreed completely with the reference diagnosis.
Table 4.
Comparison of criteria evaluated for individual cases and overall
DISCUSSION
The aim of this study is to simulate the process of capturing images from glass slides with a smartphone, uploading them to a server or sending images as E-mail attachments. The adapter specifications were detailed, easy to follow and printing of the adapter on a 3-D printer was done without much difficulty. A challenge in developing countries where telepathology and telemedicine are needed most will be the procurement of smartphone adapters. Perhaps, partnerships can be developed between academic institutions and organizations in developed countries and low-resource locations so smartphone adapters might be made available for little or no cost.
Our experience and comments from the reviewers showed that video quality was more consistent than static image quality. With video, once the initial focus was set it was a matter of moving the stage to capture the entire specimen. However, the initial setting of getting the microscopic image on the iPhone screen optimally (middle of screen) may be difficult sometimes. Rubber bands [Figure 1] were needed to stabilize the adapter. Image quality was also dependent on several other factors: the illumination of the iPhone, when and how to tap the screen to save images, where to touch the screen for focusing and also focusing the microscope itself. All these factors needed some practice to master. Perhaps, providing video instructions for set-up and image capture may help users.
Although video overviews were found to be generally useful, in 11 instances (36.7%), reviewers were unable to view the video for technical reasons. This problem could have been quickly resolved by downloading the required browser plugin, however, only network administrators are allowed to download and install software in some settings. This could perhaps explain why some were unable to review the videos. This technical difficulty is unique only to the study and will likely not create any problems in real word practice. An iPhone was used to capture images and videos for this study, however, worldwide, 76.6% of smartphones use the Android operating system.[15] Videos taken with Android phones are saved as mp4 files, which can be viewed in almost all web browsers. Moreover, telepathology consultations will most likely be sent to large pathology departments or centers in universities or large pathology group practices that have existing telepathology services. These centers have or will have the technical expertise in installing video plugins required to view any format sent from developing countries or remote locations within the USA.
Likert scale scores for image quality, adequacy of images for diagnosis, confidence in diagnosis and usefulness of video overviews had modes of 3, 4, 4 and 3, respectively. All four are at midpoint or above the midpoint of the scale, but when Likert scores of three and above (i.e. 3–5) were combined, the percentages totaled 75.6% for image quality, 80.0% for adequacy, and 77.8% for confidence and 73.3% for video overviews.
Overall, there was complete agreement in 31 (69%) reviews, only minor disagreement in 9 (20%) and 5 (11%) major disagreements. All of these cases were challenging to the original pathologists, hence, the referral to the AFIP. As such, it is not unusual that there are varying opinions. Although the primary aim of this study was to evaluate the features of images, not the accuracy of diagnosis based on the images, these results perhaps indicate the diagnostic quality of these images that made accurate diagnosis possible. Only two cases account for the five major disagreements. The first, an intradermal nevus, was particularly challenging with three major disagreements. It was an “incidentaloma” removed during a hemorrhoidectomy. Its unusual location most likely led to the difficulty in arriving at a correct diagnosis. If it was a skin tag in any other location on the body, it might not have been as challenging. Like the actual continuing medical education course, a history of HIV was not provided in the other case. Clinical information would have heightened diagnostic suspicion of Kaposi sarcoma and may have led to the correct diagnosis. These cases illustrate the need for a complete clinical history in consultations, especially in telepathology. Under in-hospital circumstances, these two cases would have required further workup (immunochemistry, specials stains) and consultation with colleagues.
The strong correlation between image quality and confidence in diagnosis (r = 0.78), image quality and adequacy of images (r = 0.73) and adequacy of images and confidence (r = 0.72) demonstrates the increased confidence in rendering a diagnosis with good quality images. What is somewhat difficult to explain is why confidence was moderately correlated to both referring cases (r = 0.34) and accuracy of diagnosis (r = 0.29), but not reviewing cases. One would also expect that experience in reviewing telepathology referrals cases would provide confidence and lead to accuracy in diagnosis, but in this study, reviewing cases negatively correlated with confidence (r = −0.17) and diagnostic accuracy (r = −0.19). Another perplexing correlation was the only weak correlation between accuracy and quality (r = 0.22) and adequacy of images (r = 0.17) both. Perhaps, there are factors not identified in this study that affect the weak or negative correlations found.
The high reliability of the ICC among the four reviewers who finished 9–10 cases is shown in Table 5.
Table 5.
The ICC of 4 reviewers

Limitations
Other than self-reported prior experience in telepathology, we have no data on the reviewers: Age, gender, years in practice, specialization. We have no data on the computer equipment (type of computer, display resolution, monitor calibration, room lighting, etc., used to review the images. The limited number of cases and the use of a selected set of gastrointestinal biopsies may have a confounding effect on the reviewer's evaluation. The specimen source was a convenience sample and also because it was a well-studied set of specimens. Since the main objective in this study was to evaluate the quality of images, not the diagnosis itself, we felt that the use of these specimens was reasonable. In our request for participation, it was emphasized that the accuracy of their diagnosis was not important but rather their evaluation of the quality of images.
Although newer, higher resolution cameras are now commercially available, the iPhone 5 was chosen simply because it was convenient. In the real world, pathologists and clinicians might use whatever is available in their setting. The 3-D printed adapter was made available to us at no cost for this study. In developing countries, these printers are now commercially available but partnerships could be developed with colleagues in developed countries who might be able to print these devices at no cost.
The generalizability in real world situations is uncertain but we hope to raise awareness with pathologists and clinicians in developing and developed countries that these tools and methods are available. The quality of slide preparation will also vary worldwide which will be an unknown factor although two of the authors (PF and YY) have experience with colleagues in developing countries and have found them adequate for telepathology diagnosis. Perhaps, a collaborative study might clarify some of the issues raised here.
CONCLUSIONS
Our experience demonstrates the ease in setting up a microscope for capturing images with a smartphone. With smartphones becoming more affordable and mobile network penetration increasing worldwide, expert opinion is now available through telemedicine and telepathology for almost anyone. Partnerships between clinicians and institutions in low-resource developing countries and in developed countries through academic institutions and organizations need to develop to create networks of referral centers and to provide smartphone adapters. With 3-D printers now commonly available, these devices can be easily fabricated and distributed to those in need.
ACKNOWLEDGMENTS
The authors would like to thank the pathologists who provided their time and expertise in evaluating the images and providing useful comments. This research was supported by the Intramural Research Program of the NIH, National Library of Medicine and Lister Hill National Center for Biomedical Communications.
Footnotes
Available FREE in open access from: http://www.jpathinformatics.org/text.asp?2015/6/1/35/158912
REFERENCES
- 1.Smartphone Forecasts and Assumptions; 2007-2020. [Last accessed on 2015 May 14]. Available from: https://www.gsmaintelligence.com/analysis/2014/9/smartphone-forecasts-and-assumptions-20072020/443/
- 2.Seong NJ, Kim B, Lee S, Park HS, Kim HJ, Woo H, et al. Off-site smartphone reading of CT images for patients with inconclusive diagnoses of appendicitis from on-call radiologists. AJR Am J Roentgenol. 2014;203:3–9. doi: 10.2214/AJR.13.11787. [DOI] [PubMed] [Google Scholar]
- 3.Demaerschalk BM, Vargas JE, Channer DD, Noble BN, Kiernan TE, Gleason EA, et al. Smartphone teleradiology application is successfully incorporated into a telestroke network environment. Stroke. 2012;43:3098–101. doi: 10.1161/STROKEAHA.112.669325. [DOI] [PubMed] [Google Scholar]
- 4.Creary SE, Gladwin MT, Byrne M, Hildesheim M, Krishnamurti L. A pilot study of electronic directly observed therapy to improve hydroxyurea adherence in pediatric patients with sickle-cell disease. Pediatr Blood Cancer. 2014;61:1068–73. doi: 10.1002/pbc.24931. [DOI] [PubMed] [Google Scholar]
- 5.Barsam A, Bhogal M, Morris S, Little B. Anterior segment slitlamp photography using the iPhone. J Cataract Refract Surg. 2010;36:1240–1. doi: 10.1016/j.jcrs.2010.04.001. [DOI] [PubMed] [Google Scholar]
- 6.Teichman JC, Sher JH, Ahmed II. From iPhone to eyePhone: A technique for photodocumentation. Can J Ophthalmol. 2011;46:284–6. doi: 10.1016/j.jcjo.2011.05.016. [DOI] [PubMed] [Google Scholar]
- 7.Robboy SJ, Weintraub S, Horvath AE, Jensen BW, Alexander CB, Fody EP, et al. Pathologist workforce in the United States: I.Development of a predictive model to examine factors influencing supply. Arch Pathol Lab Med. 2013;137:1723–32. doi: 10.5858/arpa.2013-0200-OA. [DOI] [PubMed] [Google Scholar]
- 8.Leong AS, Leong FJ. Strategies for laboratory cost containment and for pathologist shortage: Centralised pathology laboratories with microwave-stimulated histoprocessing and telepathology. Pathology. 2005;37:5–9. doi: 10.1080/00313020400023586. [DOI] [PubMed] [Google Scholar]
- 9.Trudel MC, Paré G, Têtu B, Sicotte C. The effects of a regional telepathology project: A study protocol. BMC Health Serv Res. 2012;12:64. doi: 10.1186/1472-6963-12-64. [DOI] [PMC free article] [PubMed] [Google Scholar]
- 10.Morrison AS, Gardner JM. Smart phone microscopic photography: A novel tool for physicians and trainees. Arch Pathol Lab Med. 2014;138:1002. doi: 10.5858/arpa.2013-0425-ED. [DOI] [PubMed] [Google Scholar]
- 11.Jamieson S. Likert scales: How to (ab) use them. Med Educ. 2004;38:1217–8. doi: 10.1111/j.1365-2929.2004.02012.x. [DOI] [PubMed] [Google Scholar]
- 12.Norman G. Likert scales, levels of measurement and the “laws” of statistics. Adv Health Sci Educ Theory Pract. 2010;15:625–32. doi: 10.1007/s10459-010-9222-y. [DOI] [PubMed] [Google Scholar]
- 13.Marcelo A, Fontelo P, Farolan M, Cualing H. Effect of image compression on telepathology. A randomized clinical trial. Arch Pathol Lab Med. 2000;124:1653–6. doi: 10.5858/2000-124-1653-EOICOT. [DOI] [PubMed] [Google Scholar]
- 14.Zaiontz C. [Last accessed on 2015 May 14]. Available from: http://www.real-statistics.com/reliability/intraclass-correlation/
- 15.Market Share Operating Systems in Smartphones Worldwide. International Data Corporation Worldwide Quarterly Mobile Phone Tracker. [Last accessed on 2015 May 14]. Available from: http://www.idc.com/prodserv/smartphone-os-market-share.jsp .


