

Abstract
Although the intensive use of angiotensin II blockade (ACEI or ARB), progression of diabetic nephropathy is common. A feedback increase in renin production often accompanies angiotensin II blockade. We therefore examined whether aliskiren, a direct renin inhibitor, confers better renoprotection than angiotensin II blockade and whether the addition of aliskiren to an ACEI or ARB would enhance the efficacy in slowing the progression of glomerulosclerosis in diabetes. Untreated db/db mice developed progressive mesangial matrix expansion and albuminuria between weeks 18 and 22, associated with reduction of WT-1 immunopositive podocytes and nephrin and podocin production and induction of desmin and B7-1 generation and renal expression of TGFß1, PAI-1, fibronectin and type IV collagen. Treatment with aliskiren at 30 mg/kg/d inhibited the increases in albuminuria and markers of renal fibrosis and the changes that are indicative of podocyte injury seen in the db/db mice. Notably, the therapeutic effect of aliskiren was similar to that of either enalapril or valsartan given alone at maximally effective doses. Combined therapy caused the loss of 10% ~ 16.6% of db/db mice, yielded no further reduction in renal fibrosis and podocyte injury but further reduced albuminuria and renal production of TNFα, Nox2 and p47phox and urine MCP-1 and malondialdehyde levels, the markers of renal inflammation and oxidative stress. These results suggest that aliskiren, enalapril and valsartan are equally effective in slowing the progression of diabetic nephropathy. The use of combination therapy with aliskiren and ACEI/ARB may not be strongly supported.
Keywords: Direct renin inhibitor (DRI), angiotensin converting enzyme inhibitor (ACEI), angiotensin II receptor blocker (ARB), albuminuria, podocyte, renal fibrosis
Introduction
Renin-angiotensin system (RAS) activity is elevated both in the circulation and in the renal tissue of patients with diabetic nephropathy. Increased RAS activity plays an important role in the hemodynamic and nonhemodynamic pathogenetic mechanisms involved in kidney injury. Pharmacological blockade of angiotensin (Ang) II’s generation and action with angiotensin converting enzyme inhibition (ACEI) or Ang II receptor blockers (ARB) therefore has become a standard and essential therapy in the management of diabetic nephropathy [1]. However, most studies to date show kidney disease progression in many patients despite treatment with ACEI or ARB [2-4]. A potential explanation for this limitation in success is the increase in renin secretion and synthesis [5,6], as a result of negative feedback from the suppression of Ang II synthesis or activity by these agents.
Renin is the initial and rate-limiting substance in the RAS. The direct renin inhibitor (DRI) may locally have some advantages in terms of specificity by blocking Ang I generation. Therefore, there is currently renewed interest in DRIs. Aliskiren, the first renin inhibitor to reach the market, lowers elevated blood pressure efficiently by decreasing plasma and/or local renin activity [7]. Very recently, increasing evidence shows that aliskiren has an antiproteinuric effect in patients with diabetes and also exerts renoprotective, cardioprotective, and anti-atherosclerotic effects in animal models independent of its blood pressure lowering activity [8-10]. However the data on the effect of aliskiren on the progression of structural renal damage and renal impairment, particularly in diabetic nephropathy are lacking, leaving open the questions of whether aliskiren confers better renoprotection than Ang II blockade and whether dual therapy to block the RAS with aliskiren and ACEI or ARB would provide sustained or further renoprotection vs. monotherapy. To answer these questions will be of enormous importance to be considered for treatments targeting RAS in the progression of renal fibrosis. We thus proposed to use a well-established experimental diabetes model to investigate the efficacy of aliskiren on the progression of diabetic nephropathy as monotherapy compared to ACEI and ARB and the additive effects in combination with ACEI or ARB. We also explored the underlying mechanism of this protection.
Materials and methods
Reagents
Aliskiren and valsartan were provided by Novartis Pharmaceuticals Corporation (Basel, Switzerland). Unless specified, all other re-agents were purchased from Sigma Chemical Co. (St. Louis, MO, USA).
Animals
Diabetic male db/db mice (BKS.Cg-Dock7m +/+ Leprdb/J homozygotes) and their littermate male db/m mice were obtained from the Jackson Laboratory (Bar Harbor, ME, USA) and housed in accordance with the National Institutes of Health Guide for the Care and Use of Laboratory Animals. The experimental protocols were approved by the Animal Care Committee at the University of Utah. The db/db mice were determined to be diabetic by the vendor on the basis of obesity at approximately 5 weeks of age and were further demonstrated to be hyperglycemic in our laboratory at week 7. Mice were subjected to right uninephrectomy under anesthesia at week 8 to hasten the development of diabetic nephropathy as described previously [11]. The db/m mice received uninephrectomy served as the operation control. All experimental procedures were conducted as humane as possible.
Experimental design
Groups of uninephrectomized mice were assigned and treated at 18 weeks of age as follows: (i) untreated non-diabetic db/m mice (n=8) as healthy controls; (ii) untreated diabetic db/db mice (n=13) as a disease control at 18 weeks of age; (iii) untreated diabetic db/db mice (n=13) as another disease control at 22 weeks of age, the difference in disease severity between 18 and 22 weeks serves as “disease progression” control; (iv) diabetic db/db mice treated with enalapril (n=13), 200 mg/L enalapril in drinking water or (v) valsartan (n=10), 500 mg/L valsartan in drinking water for 4 weeks from week 18 to week 22; (vi) diabetic db/db mice treated with aliskiren (n=12) at 30 mg/kg body weight/day by continuous subcutaneous infusion via osmotic pumps (model 2004, Alzet, Cupertino, CA) for 4 weeks; and (vii) diabetic db/db mice treated with aliskiren plus enalapril (n=12) or (viii) aliskiren plus valsartan (n=10) at the same dose as each drug given alone. The maximally renoprotective doses of enalapril and valsartan were determined previously [12-14]. The water consumption was monitored daily. The dose of aliskiren was determined in pilot experiment (data not shown).
Systolic blood pressure was measured every 2 weeks from week 12 to week 18 in conscious and trained mice at room temperature by the tail-cuff method (MC4000 multi channel blood pressure analysis system, Hatteras Instrument, Inc., Cary, NC, USA). The blood glucose level and glycosylated hemoglobin (HbA1c) level were monitored in tail blood samples using a blood glucose meter (Glucometer Elite XL, Bayer Healthcare, Elkhart, IN, USA) and the DC 2000+ HbA1c kit (Bayer Healthcare) respectively before treatment and at the time of sacrifice. Twenty-four-hour urine was obtained from each mouse after placement in the metabolic cage before treatment and at the time of sacrifice. Urine albumin was measured using the DC2000+ microalbumin reagent kit (Bayer Healthcare). Urine aldosterone, tumor necrosis factor alpha (TNFα) and monocyte chemoattractant protein-1 (MCP-1) levels were measured using the commercial available ELISA kits (Alpha Diagnostic Intl. Inc., San Antonio, TX and R&D Systems Inc., Minneapolis, MN, USA). Urine malondialdehyde (MDA) levels were measured using a colorimetric assay (Cayman Chemical Company, Ann Arbor MI, USA). The levels of excretion were expressed as the total amount excreted in 24 hours.
Mice were sacrificed under isoflurane anesthesia. Blood samples were obtained by cardiac puncture for the measurements of plasma K+ (the MEDICA Easylyte Plus Na/K/Cl analyzer, Medica Corporation, Bedford, MA, USA) and creatinine levels (QuantiChromTM creatinine assay kits, BioAssay Systems, Hayward, CA, USA) and plasma renin concentration (PRC). Mouse PRC was determined by the radioimmunoassay of Ang I generated from excess rat angiotensinogen (ANG) in the presence of high-affinity antibodies Ang I (Phoenix Pharma-ceuticals, Burlingame, CA). Kidneys were perfused through the heart with cold PBS and then excised. Renal cortex was harvested by dissection. Two pieces of cortex were either snap-frozen in 2-methylbutane at -80°C or fixed in 10% neutralized formalin for immunohistochemical staining. Other pieces of cortex were stored in liquid nitrogen for western blot or treated with Tri Reagent for isolation of RNA or treated with 100 mM NaCl and 20 mM HEPES to be sonicated for 30 seconds, 3 times on ice and centrifuged at a 12,000 rpm for 15 min at 4°C. The supernatant was then collected and stored at -80°C for transforming growth factor beta 1 (TGFß1) ELISA (R&D Systems) and protein measurement by a bicinchoninic acid (BCA) protein assay kit (PIERCE, Rockford IL, USA).
Histological analysis
Formalin-fixed renal cortex tissues were subsequently embedded in paraffin. Three-micro-meter sections were cut from the tissue blocks and stained with periodic acid-Schiff (PAS). The PAS-positive glomerular extracellular matrix was quantitated in a blinded fashion by a computer-assisted method as previously described [11]. Immunofluorescent staining and quantified for fibronectin (FN), type IV collagen (Col IV), podocin, nephrin and Wilms tumor protein 1 (WT-1) was performed on frozen sections as described previously [11,14,15].
Western blot analysis
Equal amounts of renal cortex tissue (15 mg) from each mouse of each group were homogenized in the lysis buffer (Cell Signaling Technology, Inc., Beverly, MA, USA) with 1% NP40, 1 mM PMSF and 1 tablet/5 ml protease inhibitor mix (Complete, Mini; Roche Diagnostics Corporation, Indianapolis, IN). Protein sample from all mice of each group was pooled for further examination. For western blot analysis, protein samples (20 µg each) were subjected to SDS-PAGE in 4-12% gradient gel (Invitrogen) and immunblotting on immobilon-P transfer membranes (Millipore Corporation, Bedford, MA, USA). Proteins of plasminogen activator inhibitor-1 (PAI-1), FN, desmin, B7-1, TNFα, NAPDH oxidase-2 (Nox2) and p47phox were assessed on the Western blots and the immunostaining band was visualized and quantified as described previously [13-15].
RNA preparation and real-time RT-PCR
Total RNA was extracted from renal cortex tissue using Tri Reagent according to the manufacturer’s instructions. Two micrograms of total RNA were reverse-transcribed using the superscript III first-strand synthesis system for RT-PCR kit (Invitrogen). Real-time RT-PCR was performed using the SYBR green dye I (Applied Biosystems, Foster City, CA, USA) and the ABI 7900 Sequence Detection System (Applied Biosystems) as described previously [11]. Samples were run as triplicates in separate tubes to permit quantification of the target gene normalized to ß-actin. Sequences of primers used for fibrotic markers and sequences of new primers used for podocyte markers were described previously [11,14]. The specificity of the PCR products was confirmed on a 1.5% agarose gel by showing a specific single band with the expected size.
Statistical analysis
Data are expressed as mean ± S.D. with n representing the number of animals. Groups were analyzed by one-way ANOVA and subsequent Dunnett testing for multiple comparisons. P<0.05 was considered statistically significant.
Results
Systemic parameters
The baseline and final characteristics of the eight groups of mice are presented in Table 1. During the treatment, the groups with combination therapy lost one to three db/db mice, although the cause of death is not clear. All mice in other 6 groups survived until the time of sacrifice. At baseline, 18-week body weights of db/db mice were greater than those of db/m controls. The non-diabetic db/m mice gained approximately 1 g in body weight in 4 weeks. In contrast, the diabetic db/db mice lost ~ 5.8 g in body weight during the experimental period. Diabetic mice remained hyperglycemic as indicated by blood glucose and glycosylated hemoglobin levels. Aliskiren, enalapril or valsartan given alone had no effect on body weights in the db/db mice, when compared with the untreated db/db mice. However, the combination of aliskiren with valsartan resulted in significantly body weight loose in the db/db mice (P<0.05). None of the treatments affected blood glucose levels to any significant extent in the db/db mice, when compared with the untreated db/db mice. The blood pressure was still normal, not increased in db/db mice at the age of 18 weeks (systolic blood pressure (SBP), db/db vs. db/m, 115.5 ± 7.9 vs. 115.6 ± 7.4, mmHg, P>0.05). In order to avoid increases in the risk of skin lesion from manipulation of animals with mini-pumps, we did not measure BP after treatment started in the present study. Plasma K+ levels in db/db mice at the age of 18 weeks were similar to those in non-diabetic db/m mice but were increased at the age of 22 weeks (P<0.05). All treatments did not cause any further increases in plasma K+ levels, when compared with the untreated db/db mice at 22 week of age (P>0.05).
Table 1.
Systemic parameters of the experimental groups of mice
| db/m -22wk (n=8) | db/db -18wk (n=13) | db/db -22wk (n=13) | db/db+Ena -22wk (n=13) | db/db+Val -22wk (n=10) | db/db+Ali -22wk (n=12) | db/db A+E -22wk (n=12) | db/db A+V -22wk (n=10) | |
|---|---|---|---|---|---|---|---|---|
| BW, g | ||||||||
| Baseline | 25.0 ± 0.77 | 45.1 ± .99* | 45.5 ± 6.34* | 47.0 ± 5.72* | 49.9 ± 5.14* | 48.2 ± 6.21* | 49.7 ± 6.10* | 46.3 ± 5.54* |
| End | 26.0 ± 1.28 | 39.6 ± 7.11* | 39.9 ± 6.43* | 39.6 ± 4.67* | 35.7 ± 6.83* | 36.7 ± 9.18* | 29.5 ± 6.08*,# | |
| BG, mg/dl | ||||||||
| Baseline | 127.8±11.4 | 581.4 ± 47.4* | 600.0 ± 0* | 588.6 ± 17.7* | 600.0 ± 0.0* | 595.0 ± 10.7* | 573.1 ± 46.0* | 557.4 ± 76.2* |
| End | 118.8±31.9 | 600.0 ± 0.0* | 600.0 ± 0.0* | 598.3 ± 4.5* | 590.7 ± 16.5* | 590.6 ± 32.6* | 587.2 ± 27.9* | |
| HbA1c, % | ||||||||
| Baseline | 3.91 ± 0.11 | 11.38 ± 2.21* | 12.3 ± 1.94* | 11.39 ± 2.23* | 12.78 ± 1.99* | 11.25 ± 1.42* | 10.55 ± 1.82* | 11.67 ± 2.09* |
| End | 3.88 ± 0.14 | 13.49 ± 0.95* | 13.62 ± 1.01* | 13.63 ± 0.98* | 12.87 ± 1.45* | 12.76 ± 1.70* | 12.76 ± 2.39* | |
| Plasma K+, mEq/L | 3.69 ± 0.64 | 3.56 ± 0.95 | 4.94 ± 0.81 | 4.92 ± 1.10 | 4.93 ± 0.59 | 5.30 ± 0.43 | 5.40 ± 0.39 | 5.42 ± 0.97 |
| Plasma Cr, mg/dl | 0.66 ± 0.24 | 1.19 ± 0.45* | 1.53 ± 0.83* | 1.50 ± 0.28* | 1.52 ± 0.55* | 1.81 ± 0.57* | 1.58 ± 0.58* | 1.46 ± 0.50* |
| UAE, µg/24 h | ||||||||
| Baseline | 10.0 ± 0.33 | 258.1 ± 37.3* | 274.9 ± 47.7* | 260.3 ± 36.8* | 264.9 ± 43.8* | 258.0 ± 38.3* | 269.7 ± 40.2* | 250.6 ± 1.4* |
| End | 6.1 ± 0.04 | 398.2 ± 77.6*,# | 142.1 ± 14.4*,#,§ | 137.7 ± 9.2*,#,§ | 113.9 ± 10.4*,#,§ | 81.78 ± 5.5*,#,§ | 37.5 ± 10.3*,#,§ | |
| Mortality rate (%) | 0 | 0 | 0 | 0 | 0 | 0 | 16.6 | 10 |
Diabetic db/db mice were treated with enalapril (Ena), valsartan (Val), aliskiren (Ali), combination of aliskiren and enalapril (A+E) or aliskiren and valsartan (A+V) for 4 weeks between 18 and 22 weeks of age. Unless specified, parameters were recorded at the end of the experimental period (22 weeks of age). BW, body weight. BG: blood glucose levels. Cr: creatinine.
P<0.05 vs. db/m;
P<0.05 vs. db/db at 18 wk.
P<0.05 vs. db/db at 22 wk.
Renal function measured as plasma creatinine concentration was impaired in this batch of db/db mice at the age of 18 weeks to 22 weeks when compared to those of the non-diabetic db/m mice (P<0.05). All treatment had no effect on plasma creatinine levels (Table 1).
Renal hormonal results are summarized in Table 2. PRC still remained normal but renal renin mRNA levels were significantly above normal in the untreated diabetic db/db mice as compared with the non-diabetic db/m control mice (P>0.05), indicating renal local RAS activation. As evidence of RAS activation, urinary aldosterone excretion was markedly increased in the diabetic db/db mice (P<0.05). As expected, enalapril and valsartan treatment increased renal mRNA expression of renin and PRC through interaction with the Ang II negative feedback loop on renin synthesis and secretion. Although aliskiren treatment decreases plasma renin activity, PRC and renal renin mRNA expression were also comparably increased in aliskiren treated diabetic mice. Of note, their values were further increased in the dual RAS blockade treated db/db mice compared with the single RAS blockade treated mice. Urinary aldosterone excretion was decreased in the single RAS inhibitor treated db/db mice, which was significantly lower when dual RAS blockade was given to the db/db mice.
Table 2.
Renal renin levels and urinary aldosterone levels
| db/m -22wk (n=8) | db/db -18wk (n=13) | db/db -22wk (n=13) | db/db+Ena -22wk (n=13) | db/db+Val -22wk (n=10) | db/db+Ali -22wk (n=12) | db/db A+E -22wk (n=12) | db/db A+V -22wk (n=10) | |
|---|---|---|---|---|---|---|---|---|
| PRC (ng Ang I /ml/min) | 26.8 ± 0.32 | 25.64 ± 0.15 | 26.82 ± 0.27 | 81.2 ± 2.85*,§ | 74.38 ± 3.09*,§ | 92.01 ± 2.18*,§ | 244.1 ± 8.12*,§ | 249.4 ± 7.22*,§ |
| Renal renin mRNA levels | 1.00 ± 0.12 | 2.01 ± 0.28* | 2.44 ± 0.18* | 8.71 ± 2.47*,§ | 7.22 ± 0.25*,§ | 5.74 ± 0.66*,§ | 20.43 ± 2.18*,§ | 22.48 ± 4.27*,§ |
| Urine aldosterone (ng/24 h) | 2.18 ± 0.19 | 31.75 ± 15.83* | 32.04 ± 12.24* | 28.07 ± 11.33* | 25.59 ± 10.41* | 28.21 ± 7.55* | 22.26 ± 7.21*,§ | 18.86 ± 15.31*,§ |
Diabetic db/db mice were treated with enalapril (Ena), valsartan (Val), aliskiren (Ali), combination of aliskiren and enalapril (A+E) or aliskiren and valsartan (A+V) for 4 weeks between 18 and 22 weeks of age. Unless specified, parameters were recorded at the end of the experimental period (22 weeks of age). PRC, plasma renin content. Renal renin mRNA levels were corrected by ß-actin mRNA levels as described in methods.
P<0.05 vs. db/m;
#P<0.05 vs. db/db at 18 wk.
P<0.05 vs. db/db at 22 wk.
Albuminuria
At the beginning of intervention (18 weeks of age), urinary albumin excretion (UAE) values in the db/db mice were similar among the various groups and were significantly higher compared with the db/m mice (Table 1). Albumin excretion increased 148% between weeks 18 and 22 in the untreated db/db mice. All treatments prevented this increase and, in fact, lowed the UAE than those seen in the db/db mice at the beginning of intervention (P<0.05). Treatment with enalapril or valsartan alone lowed UAE to values lower than diabetic mice before treatment by 45.5% and 48.3% respectively. Aliskiren was effective as enalapril or valsartan and lowed UAE by 56.5%. When aliskiren was combined with enalapril or valsartan, an enhanced and significant anti-proteinuric effect was achieved, leading to a total reduction of 70.8% (P<0.05) and 86.9% (P<0.05), respectively.
Renal histology
At the end of the study (22 weeks), the glomeruli of db/db mice demonstrated increased accumulation of PAS-positive extracellular matrix (ECM) proteins and FN and Col IV in the mesangium compared with glomeruli of db/m mice (Figure 1). The single agents of enalapril, valsartan and aliskiren or dual therapy with aliskiren and enalapril/ valsartan prevented increases in glomerular matrix protein deposition from diabetic db/db mice between 18 and 22 weeks at almost the same extent.
Figure 1.

Effect of aliskiren, enalapril, valsartan and dual therapy on glomerular matrix protein accumulation in diabetic db/db mice from weeks 18 to 22. The histological sections stained with PAS (A) and glomerular immunofluorescent staining for fibronectin (FN) (B) and type IV collagen (Col IV) (C) are presented at 400 x magnification. Representative photomicrographs of glomeruli from normal control mice (db/m), diabetic db/db mice without treatment at week 18 (DC18) or at week 22 (DC22) and diabetic db/db mice treated with enalapril (Ena), valsartan (Val), aliskiren (Ali), combination of aliskiren and enalapril (A+E) or aliskiren and valsartan (A+V). Graphic representations of glomerular matrix score (D), FN staining score (E) and Col IV staining score (F) are shown below. *P<0.05, vs. db/m. #P<0.05, vs. DC18. §P<0.05, vs. DC22.
TGFß1, PAI-1 and FN levels in renal cortex
The levels of profibrotic molecules TGFß1, PAI-1 and matrix protein FN in renal cortex were significantly increased in the db/db mice at week 18 and were further increased at week 22 (Figure 2). Compared to the untreated db/db control at week 22, the increased renal TGFß1 levels were equally reduced in the groups treated with either a single RAS blocker or dual RAS blocker (Figure 2A). The renal production of PAI-1 and FN showed a similar picture (Figure 2B-D). Treatment of diabetic mice with enalapril, valsartan or aliskiren alone or the combination of aliskiren plus enalapril or valsartan decreased the increased renal synthesis of PAI-1 from week 18 to week 22 by 78.5%, 109%, 140%, 94.2% and 95.5%, respectively. The renal FN levels were decreased by 73.5%, 74.5%, 76%, 69% and 78.7%, respectively. Aliskiren had better effect in reducing renal PAI-1 production and normalized its overexpression in renal cortex tissue. This effect was not observed when aliskiren was in combination with either enalapril or valsartan (Figure 2B, 2C). There was no further reduction in renal TGFß1, PAI-1 and FN levels in the combination treated groups when compared with animals treated with the single drug alone (P>0.05).
Figure 2.
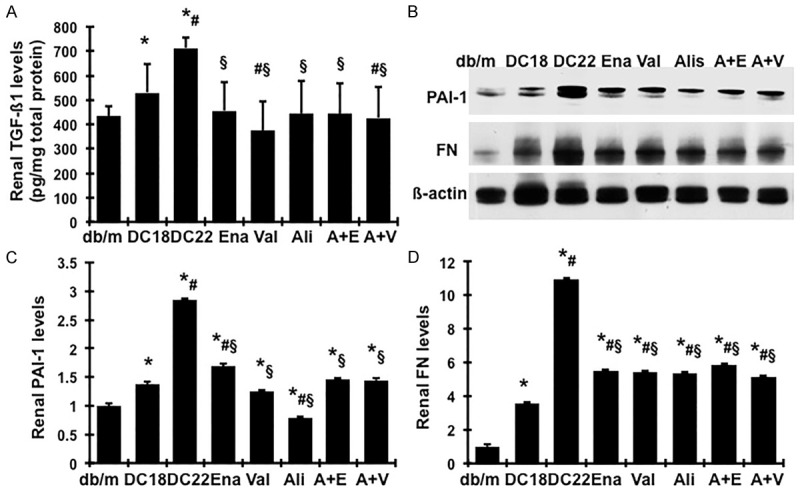
Effect of aliskiren, enalapril, valsartan and dual therapy on renal production of fibrotic markers in diabetic db/db mice from weeks 18 to 22. (A) Total TGFß1 protein levels in renal cortical tissues were measured by ELISA. (B) Representative western blots illustrating PAI-1, FN and ß-actin protein expression in renal cortical tissue tissues. The graphs summarize the results of band density measurements for PAI-1 (C) and FN (D). *P<0.05, vs. db/m. #P<0.05, vs. db/db-18wk (DC18). §P<0.05, vs. db/db-22wk (DC22).
mRNA expression of TGF-ß1, PAI-1 and matrix proteins in renal cortex
Renal TGFß1, PAI-1, FN and α1(IV) collagen mRNA levels were significantly increased in the db/db mice at week 22 (Figure 3A-D). All treatments including the single and combination treatments significantly retarded the increased TGFß1, PAI-1, FN and α1(IV) collagen mRNA expression seen in from 18 to 22 weeks and the combination treatments did not show any further reduction on these items (Figure 3A-D). Reduction of PAI-1 mRNA was not as great as the decrease in its protein production. Remarkably, all treatments similarly limited α1(IV) collagen mRNA overexpression to levels comparable to non-diabetic db/m controls (Figure 3D).
Figure 3.

Effect of aliskiren, enalapril, valsartan and dual therapy on renal mRNA expression of fibrotic markers in diabetic db/db mice from weeks 18 to 22. Expression of mRNA was determined by real-time RT/PCR. Changes in mRNA levels were determined by first correcting the amplification of ß-actin for each sample. For comparison, this ratio was set at unity for normal control (db/m) samples and other groups were expressed as fold-increase over this value. A. Expression of TGF-ß1mRNA. B. Expression of PAI-1 mRNA. C. Expression of FN mRNA. D. Expression of type α1(IV) collagen mRNA. *P<0.05, vs. db/m. #P<0.05, vs. db/db-18wk (DC18). §P<0.05, vs. db/db-22wk (DC22).
Expression of podocyte slit diaphragm-associated proteins, WT-1 positive podocytes and podocyte injury markers in db/db mice
From data presented above, it is clear that enalapril, valsartan or aliskiren given alone or in combination with aliskiren at an optimal dose retards almost equally the progression of markers of renal fibrosis in the db/db mice from weeks 18 to 22. However, a greater reduction in albuminuria was seen with dual than with single therapy in the db/db mice. It has been shown that proteinuria is often the result of podocyte injury in human diseases and animal models, especially in diabetes [16-18]. The protective effect of these treatments on podocyte in the db/db mice was therefore evaluated, in order to determine if the combination of two RAS blockades further reduced podocyte injury as seen in reduction of albuminuria.
As shown in Figure 4A and 4B, by immunofluorescent staining, non-diabetic db/m mice showed intense and linear staining for both podocin and nephrin along the capillary in glomeruli. In contrast, diabetes resulted in an attenuation of staining by 20.7% for podocin and 28% for nephrin in the glomeruli of db/db mice at 18 weeks of age. Glomerular staining of podocin and nephrin was further decreased by 41.8% and 47.6% respectively in the db/db mice at 22 weeks of age. The loss of podocyte specific podocin and nephrin seen in diabetes between weeks 18 and 22 was largely and similarly restored by enalapril, valsartan or aliskiren alone or the combined treatment with aliskiren and enalapril or valsartan (P<0.05). Combining aliskiren to enalapril or valsartan did not further restore glomerular levels of podocin and nephrin than any single treatments (P>0.05) (Figure 4D and 4E).
Figure 4.
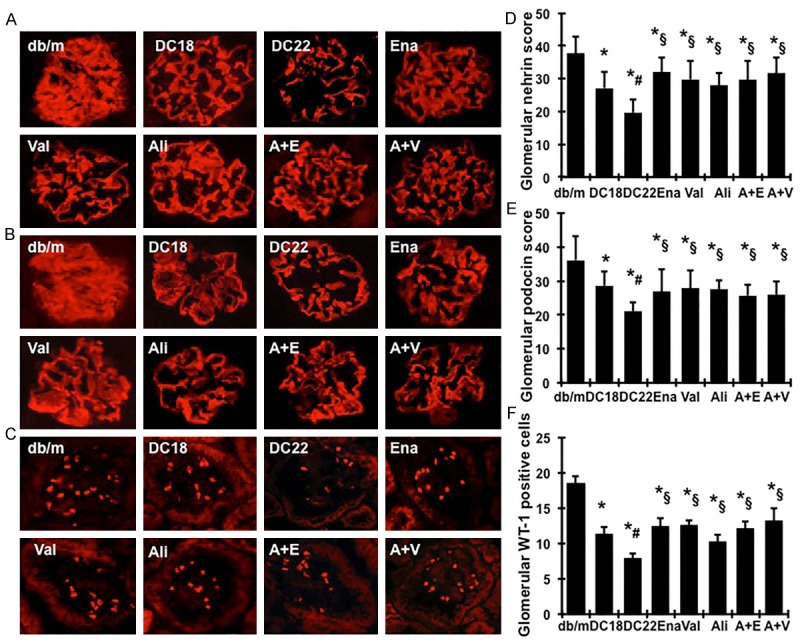
Effect of aliskiren, enalapril, valsartan and dual therapy on glomerular immunofluorescent staining for nephrin (A), podocin (B) and WT-1 (C) in diabetic db/db mice from weeks 18 to 22. Representative photomicrographs (at original magnification × 400) of glomeruli from normal control mice (db/m), diabetic db/db mice without treatment at week 18 (DC18) or at week 22 (DC22) and diabetic db/db mice treated with enalapril (Ena), valsartan (Val), aliskiren (Ali), combination of aliskiren and enalapril (A+E) or aliskiren and valsartan (A+V). Graphic representation of glomerular nephrin (D), podocin (E) staining scores or glomerular number of WT-1 positive podocytes (F) was shown below. *P<0.05, vs. db/m. #P<0.05, vs. DC18. §P<0.05, vs. DC22.
WT-1 is a nuclear protein specific for podocyte and parietal glomerular epithelial cell in the adult kidney [19,20]. WT-1-positive cells within the glomerular tuft excluding the parietal epithelium were counted in diabetic mice. Diabetic glomeruli from disease-control db/db mice at 18 weeks of age contained fewer podocytes than did glomeruli from normal-control mice (11 ± 0.96 vs. 18 ± 1.02; P<0.05), as illustrated in Figure 4C and 4F. The average number of podocytes per glomerular cross section was further decreased by 57% in the db/db mice at 22 weeks of age. Treatment of db/db mice with enalapril, valsartan or aliskiren alone or in combination with aliskiren reversed the decreases in glomerular WT-1 positive podocytes between weeks 18 and 22 significantly (P<0.05). Aliskiren increased the number of glomerular podocyte slightly less than enalapril or valsartan alone. However, combination of aliskiren with enalapril or valsartan increased podocytes to numbers comparable to those found with enalapril or valsartan alone (P>0.05) (Figure 4C and 4F).
In agree with protein levels, the gene expression of podocin, nephrin and WT-1 was down-regulated substantially in diabetic db/db mice at week 18, compared to those of db/m controls. A further significant reduction of the gene expression of those podocyte proteins was seen at week 22 (Figure 5A-C), indicating a progressive podocyte injury occurred in diabetic nephropathy from weeks 18 to 22. However, diabetes induced-decreases in mRNA expression of these podocyte structure markers were significantly ameliorated by treatment with enalapril, valsartan or aliskiren alone. Among the three single treatments, enalapril treatment had a better effect in increases of nephrin mRNA expression, while valsartan treatment had a better effect in podocin mRNA expression. The combined therapies increased nephrin and WT-1 mRNA expression at almost the same extent as either enalapril or valsartan given alone (P>0.05), while the degree of podocin mRNA expression was instead reduced by the combined therapies as compared with the single treatment, to a significant extent, which may suggest the existence of a positive feedback system for stimulation of podocin.
Figure 5.

Effect of aliskiren, enalapril, valsartan and dual therapy on mRNA expression of podocyte protein markers in diabetic db/db mice from weeks 18 to 22. Expression of mRNA was determined by real-time RT/PCR. Changes in mRNA levels were determined by first correcting the amplification of ß-actin for each sample. For comparison, this ratio was set at unity for normal control samples and other groups were expressed as fold-increase over this value. A. Expression of nephrin mRNA. B. Expression of podocin mRNA. C. Expression of WT-1 mRNA. *P<0.05, vs. db/m. #P<0.05, vs. db/db-18wk (DC18). §P<0.05, vs. db/db-22wk (DC22).
By western blot, we observed that the protein levels of desmin in renal cortex tissues, a conventional marker for podocyte injury, were up regulated by 190% in diabetic db/db mice from week 18 to week 22 (P<0.05), as shown in Figure 6A and 6B. All treatments reversed the disease-induced increase of desmin protein. Both valsartan and aliskiren limited renal desmin production to levels further lower than non-diabetic db/m controls and had better effect than enalapril. Combining aliskiren to enalapril or valsartan still maintained the desmin production at lower levels than non-diabetic db/m controls. In addition, it has been shown that B7-1 is synthesized in podocytes in response to split-diaphragm protein rearrangement and foot process effacement, served as another injury marker [21]. As shown in Figure 6A and 6C, B7-1 protein levels were markedly increased in diabetic renal tissue in db/db mice. Although we could not confirm whether the elevated productions of desmin and B7-1 were from podocytes, the changes of both desmin and B7-1 were consistent with the changes of the two slit-diaphragm-associated proteins nephrin and podocin shown in Figure 4, which may indicate that increased renal desminin and B7-1 productions somehow could be related to podocyte injury in diabetic db/db mice. Consistent with the results on nephrin and podocin, all treatments also successfully reduced the elevated B7-1 protein expression in db/db mice (P<0.05). The combination treatments did not show any further reduction on renal B7-1 production.
Figure 6.

Effect of aliskiren, enalapril, valsartan and dual therapy on desmin and B7-1 production in renal cortical tissue. (A) Representative western blots showing desmin and B7-1 protein expression. ß-actin was included in the blot for normalization. Graphic representation of the mean band intensity of desmin (B) and B7-1 (C) normalized against the band intensity of ß-actin. *P<0.05, vs. db/m. #P<0.05, vs. db/db-18wk (DC18). §P<0.05, vs. db/db-22wk (DC22). Diabetic db/db mice were treated with enalapril (Ena), valsartan (Val), aliskiren (Ali), combination of aliskiren and enalapril (A+E) or aliskiren and valsartan (A+V) from weeks 18 to 22.
Collectively, these data suggest that the use of enalapril, valsartan or aliskiren either alone or in combination at a maximally effective dose almost equally arrests the progression of markers of glomerular podocyte injury in the db/db mice from weeks 18 to 22. The therapeutic effect of aliskiren was comparable to that of either enalapril or valsartan given alone at the recommended doses. Aliskiren in combination with enalapril or valsartan was not superior to one form of RAS blockade alone in reducing podocyte injury. These results are consistent with their effects on the remission of renal fibrosis in diabetes, despite the dual therapy is more anti-albuminuric.
Changes of renal inflammation and oxidative stress markers in db/db mice
As renal inflammation and oxidative stress contribute to the development of diabetic nephropathy [22-24], we further investigated whether there is any additive therapeutic effect of dual RAS blockade on renal inflammation and oxidative stress. As shown in Figure 7A, renal TNFα levels were marked increased in untreated db/db mice, compared with db/m mice, which were further increased or remained elevated during disease progression. Consistently, urinary MCP-1 excretions were significantly increased in untreated db/db mice, compared with db/m mice (Figure 7B). These inflammation markers were further increased during disease progression. Treatment either with enalapril, valsartan or aliskiren alone or in combination with aliskiren significantly lowered renal production of TNFα and urinary MCP-1 excretion. Protein productions of renal Nox2 and its regulatory subunit, p47phox, the family members of NAPDH oxidase, were much greater in untreated db/db mice, compared with control counterparts (Figure 8, P<0.05), indicating significant renal activation of Nox2 in db/db mice, particularly at 22 weeks of age. All treatments successfully inhibited the generation of Nox2 in db/db mice (P<0.05). Particularly, protein productions of Nox2 and p47phox were reduced to levels much lower than normal with aliskiren treatment alone or in combination with enalapril or valsartan (Figure 8A and 8B), indicating that aliskiren had a better inhibitory effect in the activation of NAPDH oxidase. The MDA levels in urine were measured as indicator of lipid peroxidation. As seen in Figure 8C, the total urinary output of MDA was consistently and dramatically increased in diabetic db/db mice at 18 weeks of age compared to non-diabetic db/m mice, which was further increased at 22 weeks of age. Treatment with enalapril or valsartan or aliskiren significantly lowered the elevated urinary MDA excretion. The combination therapy induced further lightly reduction in urinary MDA excretion.
Figure 7.
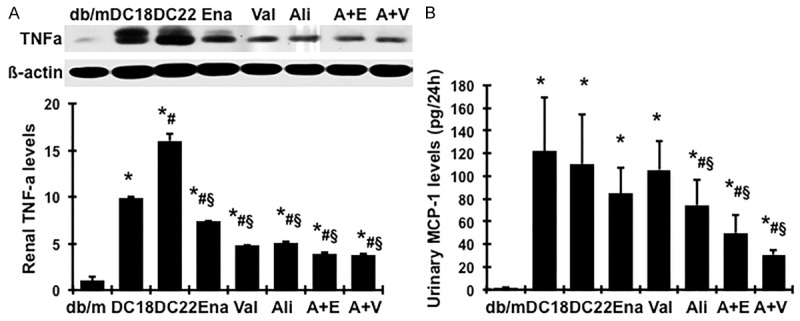
Effect of aliskiren, enalapril, valsartan and dual therapy on protein production of renal TNFα in renal cortical tissue and urine MCP-1 levels. A. Representative western blots illustrating TNFα and ß-actin protein expression. The lower respective graph summarizes the results of band density measurements. B. Urinary MCP-1 levels were measured by ELISA. *P<0.05, vs. db/m. #P<0.05, vs. db/db-18wk (DC18). §P<0.05, vs. db/db-22wk (DC22). Diabetic db/db mice were treated with enalapril (Ena), valsartan (Val), aliskiren (Ali), combination of aliskiren and enalapril (A+E) and aliskiren and valsartan (A+V) from weeks 18 to 22.
Figure 8.

Effect of aliskiren, enalapril, valsartan and dual therapy on protein production of renal NAPDH oxidases and the MDA levels in urine. Representative western blots illustrating Nox2, p47phox and ß-actin protein expression (A). Graphic representation of the mean band intensity of Nox2 (B) and p47phox (C) normalized against the band intensity of ß-actin. (D) Urinary MDA levels were detected by a colorimetric assay. *P<0.05, vs. db/m. #P<0.05, vs. db/db-18wk (DC18). §P<0.05, vs. db/db-22wk (DC22). Diabetic db/db mice were treated with enalapril (Ena), valsartan (Val), aliskiren (Ali), combination of aliskiren and enalapril (A+E) or aliskiren and valsartan (A+V) from weeks 18 to 22.
These data suggest that enalapril, valsartan or aliskiren given alone suppresses renal inflammation and NAPDH oxidase-mediated oxidative stress occurred in diabetic db/db mice. Combination of aliskiren with enalapril or valsartan confers further reduction in these markers in diabetes.
Discussion
In the present studies, our data clearly indicate that administration of aliskiren to diabetic mice from week 18 to week 22 at a maximally effective dose significantly prevented diabetes-related progression of albuminuria, podocyte injury, expression of markers of kidney fibrosis and glomerular fibrotic morphology. These results showed a striking renoprotective effect of treatment with aliskiren on the progression of diabetic nephropathy in the db/db mouse model. This effect may be beyond its blood pressure lowering activity since diabetic uninephrectomized db/db mice at 22 weeks of age are still normotensive [14]. Excellent renoprotection by aliskiren has been observed in several animal models of kidney disease [9,25-30]. The present study expands this observation to the model of progressive diabetic nephropathy. The significantly anti-NAPDH oxidase-mediated oxidative stress and inflammation properties of aliskiren may contribute to its therapeutic effect in slowing the progression of diabetic nephropathy.
Of note is that the therapeutic effect of aliskiren given at its optimally effective doses is similar to, but not superior to, that of either enalapril or valsartan given alone in diabetic db/db mice, as assessed for albuminuria, podocyte injury, renal gene expression and protein production of TGFß, PAI-1, FN and Col IV and glomerular sclerosis. Administration of aliskiren on top of enalapril or valsartan further reduced albuminuria but yielded no further reduction in renal outcomes when compared with monotherapy. It remains most likely that ACEI, ARB or DRI still acts primarily to reduce the action of Ang II that occurs through the type 1 receptor. The limitation of the present study is that we did not measure the creatinine clearance rate (Ccr) or GFR in db/db mice. Although we observed that treatment with enalapril or valsartan alone in other studies in the same model did not resulted in any reduction in Ccr levels, it is unknown if the combination therapy used in the present study causes any reduction in Ccr levels or if the further reduction in albuminuria may be related to any reduction in GFR.
Nonetheless, our results are consistent with the studies by Dr. Wenzel U’s group that six-week treatment with either aliskiren or losartan at near-maximal doses significantly decreased albuminuria, glomerular damage and transcription rates of renal injury markers to a similar extent in FVB/N mice with renal ablation, a model of CKD [28]. Importantly, no superior renoprotection was found by combining losartan and aliskiren in this CKD mouse model. True additivity, or synergism, can only be shown when maximally effective doses of at least 1 of 2 drugs are given. A number of studies including clinical trails [31-33] and pre-clinical tests in models of diabetic nephropathy [34,35], unilateral ureter obstruction [36], and hypertensive renal injury in mice [37] have shown additivity of suboptimal doses of various treatments with aliskiren and ACEI or aliskiren and ARB. Dr. Wenzel’s results and ours suggest that this may be true if both drugs are at submaximal doses, but not if given at maximal antifibrotic doses. In addition to kidney diseases, when the high effective dose of aliskiren, enalapril or losartan was adjusted equipotent and given to the LDL receptor -/- mice fed with a saturated fat-enriched diet, a model of atherosclerosis, for 12 weeks, atherosclerotic lesion was markedly ameliorated similarly, with no significant difference between the different drugs [38]. Together, these investigations suggest that RAS blocker, irrespective of their mode of inhibition in terms of Ang II’s generation and action, profoundly affect tissue fibrosis development and progression in a similar manner. Inhibiting the increase in renin activity by aliskiren in response to ACEI or ARB does not result in additional anti-tissue fibrotic protection in diabetic and non-diabetic CKD as it has been expected. A potential reason for this therapeutic limitation is the increase in prorenin and renin production. It has been shown recently that renin and prorenin may have Ang II-independent effect by binding to the (pro)renin receptor [39-41]. However, further investigations are needed to determine whether the receptor-mediated prorenin/renin binding and activation occurs and plays a role in vivo, especially in diabetes. In addition, renal aldosterone levels in the RAS blockade (including dual blockade) treated groups are still higher than normal. The diabetes-induced elevated aldosterone may also contribute to the progression of renal fibrosis.
The experimental and clinic studies have suggested an important role of Ang II-induced renal inflammation and oxidative stress in the development and progression of diabetic nephropathy [24]. Consistent with those previous studies, biomarkers of inflammation (TNFα and MCP-1) and oxidative stress (MDA), especially renal derived (urine), were markedly elevated in db/db mice. Inhibition of Ang II’ generation or action with enalapril or valsartan or aliskiren alone inhibited the elevated renal markers of inflammation and oxidative stress, suggesting that the anti-inflammatory and oxidative stress properties of RAS blockade may protect the kidney against injury in diabetes. Interestingly here, treatment with dual RAS blockade suppressed renal inflammation and oxidative stress more than a single RAS blockade given alone did. The mechanisms remain unclear. However, these benefits were not automatically translated into clinical outcome benefits in 4 weeks. Whether longer-term combination of dual RAS blockade may enhance the ability to reduce nephropathy progression through further reduction of renal inflammation and oxidative stress needs to be further evaluated.
It has been observed clinically that hyperkalemia, kidney impairment and hypotension are common adverse effects of RAS inhibitor, particularly when they are used in combination. Recently, the ALTITUDE study was halted on the basis of futility and safety after an interim analysis determined that patients receiving aliskiren together with an ACEI or ARB were at increased risk of side effects like hyperkalemia [42]. A similar observation was made in the ACEI-ARB combination treated group in the ONTARGET study [43]. Although the common adverse effects of dual RAS blockade were not able to be strictly monitored and identified in mice as in humans, increased incidence of hyperkalemia (serum K+ ≥6.0 mEq/L) was found in the combination treated groups (aliskiren plus valsartan (30%) and aliskiren plus enalapril (8.3%), not in the single RAS blocker treated groups or the disease control group without treatment. Similarly, combined therapy caused the loss of 10% ~ 16.6% of db/db mice. It appears that drug safety is another issue when dual RAS blocker treatment is employed in diabetes.
In conclusion, the present study demonstrated that DRI, ACEI and ARB identically decreased the progression of diabetic nephropathy at maximal doses in type 2 diabetic db/db mice. Combined use of DRI and ACEI or ARB for 4 weeks reduced proteinuria and renal inflammation and oxidative stress but did not appear to confer extra renoprotective outcome over the use of either agent alone. In contrast, combined use of these agents may increase the adverse effects and mortality. Together with available clinical evidence, dual RAS blockade may not be generally recommended for the treatment of diabetic nephropathy. Perhaps most importantly, in our efforts to prevent renal fibrosis in humans, is this study’s strong suggestion that RAS inhibitors first should be given in maximal dosages as tolerated. Then, alternative combination strategies that include RAS inhibitors and other agents, which act through different mechanisms, are needed to ultimately stop chronic renal disease.
Acknowledgments
We thank Beux Dmitrich for his excellent assistant with animal studies. We thank Zhanjun Jia for his excellent assistant in the measurement of blood pressure. This work was supported by a grant from Novartis Pharmaceuticals Corporation (Y.H.) and National Institutes of Health grants K01DK077955 (Y.H.) and R21DK081815 (Y.H.). Dr. Guangyu Zhou is the recipient of postdoctoral fellowship grant from Shengjing Hospital Foundation affiliated to China Medical University. Dr. Xia Liu is the recipient of postdoctoral fellowship grant from Jiangsu Provincial Department of Education, Jiangsu, China.
Disclosure of conflict of interest
None.
References
- 1.Lewis EJ, Hunsicker LG, Bain RP, Rohde RD. The effect of angiotensin-converting-enzyme inhibition on diabetic nephropathy. The Collaborative Study Group. N Engl J Med. 1993;329:1456–1462. doi: 10.1056/NEJM199311113292004. [DOI] [PubMed] [Google Scholar]
- 2.Morgan T, Anderson A, Bertram D, MacInnis RJ. Effect of candesartan and lisinopril alone and in combination on blood pressure and microalbuminuria. J Renin Angiotensin Aldosterone Syst. 2004;5:64–71. doi: 10.3317/jraas.2004.012. [DOI] [PubMed] [Google Scholar]
- 3.Forclaz A, Maillard M, Nussberger J, Brunner HR, Burnier M. Angiotensin II receptor blockade: is there truly a benefit of adding an ACE inhibitor? Hypertension. 2003;41:31–36. doi: 10.1161/01.hyp.0000047512.58862.a9. [DOI] [PubMed] [Google Scholar]
- 4.Doulton TW. ACE inhibitor-angiotensin receptor blocker combinations: a clinician’s perspective. Mini Rev Med Chem. 2006;6:491–497. doi: 10.2174/138955706776876168. [DOI] [PubMed] [Google Scholar]
- 5.Azizi M, Bissery A, Lamarre-Cliche M, Menard J. Integrating drug pharmacokinetics for phenotyping individual renin response to angiotensin II blockade in humans. Hypertension. 2004;43:785–790. doi: 10.1161/01.HYP.0000125698.00128.64. [DOI] [PubMed] [Google Scholar]
- 6.Kramer BK, Ritthaler T, Schweda F, Ittner KP, Scholz H, Riegger GA, Kurtz A. Effects of the angiotensin II type-1 receptor antagonist ZD7155 on angiotensin II-mediated regulation of renin secretion and renal renin gene expression, renal vasoconstriction, and blood pressure in rats. J Cardiovasc Pharmacol. 1998;31:700–705. doi: 10.1097/00005344-199805000-00008. [DOI] [PubMed] [Google Scholar]
- 7.Jensen C, Herold P, Brunner HR. Aliskiren: the first renin inhibitor for clinical treatment. Nat Rev Drug Discov. 2008;7:399–410. doi: 10.1038/nrd2550. [DOI] [PubMed] [Google Scholar]
- 8.Komers R. Renin inhibition in the treatment of diabetic kidney disease. Clin Sci (Lond) 2013;124:553–566. doi: 10.1042/CS20120468. [DOI] [PubMed] [Google Scholar]
- 9.Pilz B, Shagdarsuren E, Wellner M, Fiebeler A, Dechend R, Gratze P, Meiners S, Feldman DL, Webb RL, Garrelds IM, Jan Danser AH, Luft FC, Muller DN. Aliskiren, a human renin inhibitor, ameliorates cardiac and renal damage in double-transgenic rats. Hypertension. 2005;46:569–576. doi: 10.1161/01.HYP.0000179573.91016.3f. [DOI] [PubMed] [Google Scholar]
- 10.Lu H, Rateri DL, Feldman DL, Jr RJ, Fukamizu A, Ishida J, Oesterling EG, Cassis LA, Daugherty A. Renin inhibition reduces hypercholesterolemia-induced atherosclerosis in mice. J Clin Invest. 2008;118:984–993. doi: 10.1172/JCI32970. [DOI] [PMC free article] [PubMed] [Google Scholar]
- 11.Huang Y, Border WA, Yu L, Zhang J, Lawrence DA, Noble NA. A PAI-1 Mutant, PAI-1R, Slows Progression of Diabetic Nephropathy. J Am Soc Nephrol. 2008;19:329–338. doi: 10.1681/ASN.2007040510. [DOI] [PMC free article] [PubMed] [Google Scholar]
- 12.Peters H, Border WA, Noble NA. Targeting TGF-beta overexpression in renal disease: maximizing the antifibrotic action of angiotensin II blockade. Kidney Int. 1998;54:1570–1580. doi: 10.1046/j.1523-1755.1998.00164.x. [DOI] [PubMed] [Google Scholar]
- 13.Gu C, Zhou G, Noble NA, Border WA, Cheung AK, Huang Y. Targeting reduction of proteinuria in glomerulonephritis: Maximizing the antifibrotic effect of valsartan by protecting podocytes. J Renin Angiotensin Aldosterone Syst. 2012;15:177–189. doi: 10.1177/1470320312466127. [DOI] [PubMed] [Google Scholar]
- 14.Zhou G, Cheung AK, Liu X, Huang Y. Valsartan slows the progression of diabetic nephropathy in db/db mice via a reduction in podocyte injury and renal oxidative stress and inflammation. Clin Sci (Lond) 2014;126:707–720. doi: 10.1042/CS20130223. [DOI] [PubMed] [Google Scholar]
- 15.Zhang J, Gu C, Lawrence DA, Cheung AK, Huang Y. A PAI-1 mutant retards diabetic nephropathy in db/db mice through protecting podocytes. Exp Physiol. 2014;99:802–815. doi: 10.1113/expphysiol.2013.077610. [DOI] [PMC free article] [PubMed] [Google Scholar]
- 16.Shankland SJ. The podocyte’s response to injury: role in proteinuria and glomerulosclerosis. Kidney Int. 2006;69:2131–2147. doi: 10.1038/sj.ki.5000410. [DOI] [PubMed] [Google Scholar]
- 17.Ziyadeh FN, Wolf G. Pathogenesis of the podocytopathy and proteinuria in diabetic glomerulopathy. Curr Diabetes Rev. 2008;4:39–45. doi: 10.2174/157339908783502370. [DOI] [PubMed] [Google Scholar]
- 18.Yu D, Petermann A, Kunter U, Rong S, Shankland SJ, Floege J. Urinary podocyte loss is a more specific marker of ongoing glomerular damage than proteinuria. J Am Soc Nephrol. 2005;16:1733–1741. doi: 10.1681/ASN.2005020159. [DOI] [PubMed] [Google Scholar]
- 19.Sanden SK, Wiggins JE, Goyal M, Riggs LK, Wiggins RC. Evaluation of a thick and thin section method for estimation of podocyte number, glomerular volume, and glomerular volume per podocyte in rat kidney with Wilms’ tumor-1 protein used as a podocyte nuclear marker. J Am Soc Nephrol. 2003;14:2484–2493. doi: 10.1097/01.asn.0000089829.45296.7c. [DOI] [PubMed] [Google Scholar]
- 20.Guo JK, Menke AL, Gubler MC, Clarke AR, Harrison D, Hammes A, Hastie ND, Schedl A. WT1 is a key regulator of podocyte function: reduced expression levels cause crescentic glomerulonephritis and mesangial sclerosis. Hum Mol Genet. 2002;11:651–659. doi: 10.1093/hmg/11.6.651. [DOI] [PubMed] [Google Scholar]
- 21.Reiser J, von Gersdorff G, Loos M, Oh J, Asanuma K, Giardino L, Rastaldi MP, Calcaresi N, Watanabe H, Schwarz K, Faul C, Kretzler M, Davidson A, Sugimoto H, Kalluri R, Sharpe AH, Kreidberg JA, Mundel P. Induction of B7-1 in podocytes is associated with nephrotic syndrome. J Clin Invest. 2004;113:1390–1397. doi: 10.1172/JCI20402. [DOI] [PMC free article] [PubMed] [Google Scholar]
- 22.Wada J, Makino H. Inflammation and the pathogenesis of diabetic nephropathy. Clin Sci (Lond) 2013;124:139–152. doi: 10.1042/CS20120198. [DOI] [PubMed] [Google Scholar]
- 23.Tojo A, Asaba K, Onozato ML. Suppressing renal NADPH oxidase to treat diabetic nephropathy. Expert Opin Ther Targets. 2007;11:1011–1018. doi: 10.1517/14728222.11.8.1011. [DOI] [PubMed] [Google Scholar]
- 24.Xu M, Dai DZ, Dai Y. Normalizing NADPH oxidase contributes to attenuating diabetic nephropathy by the dual endothelin receptor antagonist CPU0213 in rats. Am J Nephrol. 2009;29:252–256. doi: 10.1159/000157628. [DOI] [PubMed] [Google Scholar]
- 25.Kang YS, Lee MH, Song HK, Hyun YY, Cha JJ, Ko GJ, Kim SH, Lee JE, Han JY, Cha DR. Aliskiren improves insulin resistance and ameliorates diabetic vascular complications in db/db mice. Nephrol Dial Transplant. 2011;26:1194–1204. doi: 10.1093/ndt/gfq579. [DOI] [PubMed] [Google Scholar]
- 26.Feldman DL, Jin L, Xuan H, Contrepas A, Zhou Y, Webb RL, Mueller DN, Feldt S, Cumin F, Maniara W, Persohn E, Schuetz H, Jan Danser AH, Nguyen G. Effects of aliskiren on blood pressure, albuminuria, and (pro)renin receptor expression in diabetic TG(mRen-2)27 rats. Hypertension. 2008;52:130–136. doi: 10.1161/HYPERTENSIONAHA.107.108845. [DOI] [PubMed] [Google Scholar]
- 27.Kelly DJ, Zhang Y, Moe G, Naik G, Gilbert RE. Aliskiren, a novel renin inhibitor, is renoprotective in a model of advanced diabetic nephropathy in rats. Diabetologia. 2007;50:2398–2404. doi: 10.1007/s00125-007-0795-9. [DOI] [PubMed] [Google Scholar]
- 28.Fraune C, Lange S, Krebs C, Holzel A, Baucke J, Divac N, Schwedhelm E, Streichert T, Velden J, Garrelds IM, Danser AH, Frenay AR, van Goor H, Jankowski V, Stahl R, Nguyen G, Wenzel UO. AT1 antagonism and renin inhibition in mice: pivotal role of targeting angiotensin II in chronic kidney disease. Am J Physiol Renal Physiol. 2012;303:F1037–1048. doi: 10.1152/ajprenal.00672.2011. [DOI] [PubMed] [Google Scholar]
- 29.Gross O, Girgert R, Rubel D, Temme J, Theissen S, Muller GA. Renal protective effects of aliskiren beyond its antihypertensive property in a mouse model of progressive fibrosis. Am J Hypertens. 2011;24:355–361. doi: 10.1038/ajh.2010.231. [DOI] [PubMed] [Google Scholar]
- 30.Sakuraya K, Endo A, Someya T, Hirano D, Murano Y, Fujinaga S, Ohtomo Y, Shimizu T. The synergistic effect of mizoribine and a direct Renin inhibitor, aliskiren, on unilateral ureteral obstruction induced renal fibrosis in rats. J Urol. 2014;191:1139–1146. doi: 10.1016/j.juro.2013.10.053. [DOI] [PubMed] [Google Scholar]
- 31.Parving HH, Persson F, Lewis JB, Lewis EJ, Hollenberg NK. Aliskiren combined with losartan in type 2 diabetes and nephropathy. N Engl J Med. 2008;358:2433–2446. doi: 10.1056/NEJMoa0708379. [DOI] [PubMed] [Google Scholar]
- 32.Persson F, Lewis JB, Lewis EJ, Rossing P, Hollenberg NK, Parving HH. Impact of baseline renal function on the efficacy and safety of aliskiren added to losartan in patients with type 2 diabetes and nephropathy. Diabetes Care. 2010;33:2304–2309. doi: 10.2337/dc10-0833. [DOI] [PMC free article] [PubMed] [Google Scholar]
- 33.Li SY, Chen YT, Yang WC, Tarng DC, Lin CC, Yang CY, Liu WS. Effect of add-on direct renin inhibitor aliskiren in patients with non-diabetes related chronic kidney disease. BMC Nephrol. 2012;13:89. doi: 10.1186/1471-2369-13-89. [DOI] [PMC free article] [PubMed] [Google Scholar]
- 34.Dong YF, Liu L, Lai ZF, Yamamoto E, Kataoka K, Nakamura T, Fukuda M, Tokutomi Y, Nako H, Ogawa H, Kim-Mitsuyama S. Aliskiren enhances protective effects of valsartan against type 2 diabetic nephropathy in mice. J Hypertens. 2010;28:1554–1565. doi: 10.1097/HJH.0b013e328338bb11. [DOI] [PubMed] [Google Scholar]
- 35.Gandhi S, Srinivasan BP, Akarte AS. Effective blockade of RAAS by combination of aliskiren and olmesartan improves glucose homeostasis, glomerular filtration rate along with renal variables in streptozotocin induced diabetic rats. Eur J Pharm Sci. 2012;46:32–42. doi: 10.1016/j.ejps.2012.02.002. [DOI] [PubMed] [Google Scholar]
- 36.Wu WP, Chang CH, Chiu YT, Ku CL, Wen MC, Shu KH, Wu MJ. A reduction of unilateral ureteral obstruction-induced renal fibrosis by a therapy combining valsartan with aliskiren. Am J Physiol Renal Physiol. 2010;299:F929–941. doi: 10.1152/ajprenal.00192.2010. [DOI] [PubMed] [Google Scholar]
- 37.Yamamoto E, Kataoka K, Dong YF, Nakamura T, Fukuda M, Tokutomi Y, Matsuba S, Nako H, Nakagata N, Kaneko T, Ogawa H, Kim-Mitsuyama S. Aliskiren enhances the protective effects of valsartan against cardiovascular and renal injury in endothelial nitric oxide synthase-deficient mice. Hypertension. 2009;54:633–638. doi: 10.1161/HYPERTENSIONAHA.109.133884. [DOI] [PubMed] [Google Scholar]
- 38.Lu H, Balakrishnan A, Howatt DA, Wu C, Charnigo R, Liau G, Cassis LA, Daugherty A. Comparative effects of different modes of renin angiotensin system inhibition on hypercholesterolaemia-induced atherosclerosis. Br J Pharmacol. 2012;165:2000–2008. doi: 10.1111/j.1476-5381.2011.01712.x. [DOI] [PMC free article] [PubMed] [Google Scholar]
- 39.Huang Y, Border WA, Noble NA. Functional renin receptors in renal mesangial cells. Curr Hypertens Rep. 2007;9:133–139. doi: 10.1007/s11906-007-0024-4. [DOI] [PubMed] [Google Scholar]
- 40.Nguyen G, Danser AH. Prorenin and (pro)renin receptor: a review of available data from in vitro studies and experimental models in rodents. Exp Physiol. 2008;93:557–563. doi: 10.1113/expphysiol.2007.040030. [DOI] [PubMed] [Google Scholar]
- 41.Batenburg WW, Danser AH. (Pro)renin and its receptors: pathophysiological implications. Clin Sci (Lond) 2012;123:121–133. doi: 10.1042/CS20120042. [DOI] [PubMed] [Google Scholar]
- 42.Harel Z, Gilbert C, Wald R, Bell C, Perl J, Juurlink D, Beyene J, Shah PS. The effect of combination treatment with aliskiren and blockers of the renin-angiotensin system on hyperkalaemia and acute kidney injury: systematic review and meta-analysis. BMJ. 2012;344:e42. doi: 10.1136/bmj.e42. [DOI] [PMC free article] [PubMed] [Google Scholar]
- 43.Mann JF, Schmieder RE, McQueen M, Dyal L, Schumacher H, Pogue J, Wang X, Maggioni A, Budaj A, Chaithiraphan S, Dickstein K, Keltai M, Metsarinne K, Oto A, Parkhomenko A, Piegas LS, Svendsen TL, Teo KK, Yusuf S. Renal outcomes with telmisartan, ramipril, or both, in people at high vascular risk (the ONTARGET study): a multicentre, randomised, double-blind, controlled trial. Lancet. 2008;372:547–553. doi: 10.1016/S0140-6736(08)61236-2. [DOI] [PubMed] [Google Scholar]