

Abstract
This cross‐sectional study from January 2012 to December 2012 aimed to examine the sex‐specific association between serum uric acid (SUA) levels/hyperuricemia and hypertension among Japanese patients. SUA level, medical histories, and lifestyle‐related items were collected from 85,286 of 136,770 participants. Among those with hyperuricemia, the median age was 46 years and 97% were men, which was significantly different than those without hyperurecemia (44 years and 56%, respectively; P<.01). Hyperuricemia was 1.79 times more likely in hypertensive men than normotensive men and almost six times more likely in hypertensive women (odds ratio=5.92 and adjusted odds ratio=1.33 for men and adjusted odds ratio=1.81 for women) after multivariate analysis. SUA quartiles positively correlated with systolic and diastolic blood pressures in both sexes. Hyperuricemia and SUA levels were significantly associated with hypertension in both sexes. These findings underscore the importance of maintaining normal SUA levels to manage and prevent hypertension. Better management of SUA as well as blood pressure may have potential in preventing future cardiovascular disorders.
The overall global prevalence of high blood pressure (BP) in adults 25 years and older was around 40% in 2008.1 In Japan, 60% and 45% of Japanese men and women 30 years and older (roughly 43 million individuals), respectively, were estimated to have hypertension as of 2010.2 Hypertension is a major risk factor for cardiovascular disease and a major cause of premature death and disability.3
Hyperuricemia is also an important risk factor for cardiovascular disease, renal dysfunction, gout, and metabolic syndrome.4, 5, 6, 7 In recent years, the association between elevated serum uric acid (SUA) and hypertension has received widespread attention.7, 8, 9, 10, 11 In addition to these diseases, hyperuricemia is also suggested to play a role in the development of hypertension, and a causal relationship between the two has been suggested.9, 10, 11 Previous studies have also reported an association between elevated SUA levels and cardiovascular events in patients with hypertension.12 In fact, several intervention studies have demonstrated that SUA‐lowering agents reduce BP.13 Potential mechanisms by which uric acid might elevate BP include a reduction in nitric oxide, activation of the renin‐angiotensin system, vascular smooth muscle proliferation, oxidative stress, and endothelial inflammation.14, 15 However, limited evidence is available regarding the association between SUA and BP among the Japanese population. We examined sex‐specific associations between SUA levels/hyperuricemia and hypertension among Japanese adult workers aged 44 years on average.
Patients and Methods
Our cross‐sectional study screened 136,770 Japanese adults who participated in a workplace health checkup conducted by the Tokyo Health Service Association from January 2012 to December 2012 in Tokyo, Japan. Of these, 85,286 patients whose information on BP measurements, lipid profiles, and glycosylated hemoglobin (HbA1c) and SUA levels were available to use and included in our study.
Variables
Height, weight, body mass index (BMI), and waist circumference (WC) were measured with the patient in the standing position. BMI was calculated by dividing body weight (kg) by height squared (m2). Mean systolic BP (SBP) and diastolic BP (DBP) were calculated from the mean of two upper arm BP measurements taken from participants who had been seated for at least five minutes. Serum levels of total cholesterol (mg/dL; TC), high‐density lipoprotein cholesterol (mg/dL; HDL‐C), low‐density lipoprotein cholesterol (mg/dL; LDL‐C), and triglycerides (mg/dL; TGs) were also measured. LDL‐C was estimated using the Friedewald equation [(TC) – (HDL‐C) – (TG/5)].16 HbA1c levels were determined by high‐performance liquid chromatography using an automated analyzer. Values of HbA1c (%) according to the Japanese Diabetes Society (JDS) were converted to a National Glycohemoglobin Standardization Program (NGSP) equivalent value using the following formula: HbA1c (NGSP) (%)=1.02×HbA1c (JDS) (%)+0.25%.17 SUA was measured with the uricase‐peroxidase method. Estimated glomerular filtration rate (eGFR) was calculated using the Japanese GFR equation: eGFR (mL/min/1.73 m2)=194×Cr −1.094×age− 0.287 (×0.739 if female).
Hypertension was defined as SBP ≥140 mm Hg and/or DBP ≥90 mm Hg or use of antihypertensive medication.2 Dyslipidemia was defined as LDL‐C ≥140 mg/dL, TG ≥150 mg/dL, or HDL‐C <40 mg/dL, or use of antidyslipidemic medication.18 Diabetes mellitus was defined as HbA1c ≥6.5 % or use of antidiabetic medication.17 Hyperuricemia was defined as SUA >7.0 mg/dL (416 μmol/L) or use of antihyperuricemic medication.19
Participants were asked to complete a self‐administered questionnaire, which addressed healthy lifestyle characteristics based on Breslow's seven health practices.20 These characteristics can be used to assess healthy lifestyle, and strong associations have been found between healthy lifestyle items and successful BP control among patients with hypertension.21 Healthy lifestyle items in the questionnaire included no alcohol consumption per day, nonsmoker, exercise frequency of two or more times per week, BMI of 18.5–24.9 kg/m2, adequate sleep duration, daily breakfast consumption, and no snacking between meals.20, 21
From the self‐administered questionnaire, we also collected information on present medical history of comorbidities, such as diabetes mellitus, cerebrovascular diseases, and coronary artery diseases.
Statistical Analysis
Results are presented as mean±standard deviation (SD) for continuous variables or prevalence (%) for categorical variables. SUA levels (mg/dL) were defined based on quartiles by sex (men: Q1<5.3, 5.3≤Q2<6.0, 6.0≤Q3<6.8, 6.8≤Q4 mg/dL [Q1<315, 315≤Q2<357, 357≤Q3<404, 404≤Q4 μmol/L]; women: Q1<3.7, 3.7≤Q2<4.3, 4.3≤Q3<4.9, 4.9≤Q4 mg/dL [Q1<220, 220≤Q2<256, 256≤Q3<291, 291≤Q4 μmol/L]). Sex‐specific associations between hypertension and hyperuricemia or SUA quartiles were estimated using odds ratios (ORs) and 95% confidence intervals (CIs) for each item with univariate logistic regression analysis and two multivariate models providing adjusted ORs (AORs) and 95% CIs. Model 1 was adjusted for SUA quartiles, age (years), BMI, dyslipidemia (yes), diabetes mellitus (yes), alcohol consumption (nondaily drinker), smoking (nonsmoker), and eGFR (mL/min/1.73 m2). Model 2 was adjusted for hyperuricemia (yes), age (years), BMI, dyslipidemia (yes), diabetes mellitus (yes), alcohol consumption (nondaily drinker), smoking (nonsmoker), and eGFR (mL/min/1.73 m2).
BP levels were compared between Q1 and other quartiles with Dunnett's method. Trends in P values were estimated using the Jonckheere‐Terpstra test for continuous variables. For the two‐tailed Student t test, P<.05 was considered statistically significant, and P<.01 or P<.05 was presented. All statistical analyses were performed using the Statistical Package for Social Sciences, version 22 (SPSS Inc, Chicago, IL).
The research protocol was reviewed and approved by the ethics committee of the Tokyo Health Service Association, and written informed consent was obtained from all participants.
Results
Mean participant age (SD) was 44.0 (11.9) years and 56.6% were men among those without hyperuricemia, and 45.8 (10.8) years and 97.0% were men with hyperuricemia, respectively (Table 1). Among participants with hyperurecemia, the mean BMI and prevalence of dyslipidemia and diabetes mellitus were significantly higher, and proportions of alcohol consumption (nondaily drinker) and smoking behavior (nonsmoker) were significantly lower than in those without hyperuricemia.
Table 1.
Participant Characteristics (N=85,286)
| Mean (SD) or No. (%) | P Value | ||
|---|---|---|---|
| Hyperuricemia | |||
| No (n=74,451) | Yes (n=10,835) | ||
| Age, y | 44.0 (11.9) | 45.8 (10.8) | a |
| Sex, male | 42,130 (56.6) | 10,507 (97.0) | a |
| Anthropometric measurements | |||
| Body mass index, kg/m2 | 22.5 (3.4) | 25.1 (3.7) | a |
| Healthy lifestyle characteristics | |||
| Alcohol consumption, nondaily drinker | 57,971 (77.9) | 6893 (63.6) | a |
| Smoking behavior, nonsmoker | 53,727 (78.8) | 6923 (71.6) | a |
| Exercise frequency, 2 or more times per week | 33,636 (49.4) | 4766 (49.3) | |
| Body mass index (18.5–24.9) | 52,916 (71.5) | 5756 (53.1) | a |
| Adequate sleep duration, yes | 40,199 (59.1) | 5957 (61.7) | a |
| Breakfast (every morning) | 53,380 (78.4) | 7073 (73.2) | a |
| Snack between meals, no | 57,804 (84.8) | 8476 (97.7) | a |
| Hypertension, yes | 13,998 (18.8) | 3963 (36.6) | a |
| Systolic blood pressure, mm Hg | 118.2 (17.7) | 127.2 (17.9) | |
| Diastolic blood pressure, mm Hg | 71.9 (11.8) | 79.0 (12.1) | a |
| Diabetes mellitus, yes | 2560 (3.4) | 414 (3.8) | b |
| Glycated hemoglobin, % | 5.1 (0.6) | 5.2 (0.5) | a |
| Dyslipidemia | 25,037 (33.6) | 6520 (60.2) | a |
| Total cholesterol, mg/dL | 195.1 (33.4) | 206.7 (35.1) | a |
| High‐density cholesterol, mg/dL | 62.0 (14.8) | 54.4 (13.5) | a |
| Low‐density cholesterol, mg/dL | 113.3 (30.1) | 123.6 (32.1) | a |
| Triglyceride, mg/dL | 101.6 (79.1) | 159.4 (130.6) | a |
| Uric acid, mg/dL | 5.1 (1.1) | 7.8 (0.7) | a |
| Organ damage/cardiovascular disease | |||
| Heart | 797 (1.1) | 209 (1.9) | a |
| Brain | 351 (0.5) | 51 (0.5) | |
| Kidney | 162 (0.2) | 63 (0.6) | a |
| eGFR, mL/min/1.73 m2 | 85.4 (15.9) | 76.8 (14.9) | ** |
Abbreviations: eGFR, estimated glomerular filtration rate; SD, standard deviation. a P<.01. b P<.05.
Hyperuricemia was 1.79 times more likely in hypertensive men than normotensive men and almost six times more likely in hypertensive women (OR=5.92) in univariate logistic analysis (Table 2). Multivariate logistic regression analysis revealed an association between SUA quartiles/hyperuricemia and hypertension (Table 2). Among men, Q2, Q3, and Q4 were significantly associated with hypertension compared with Q1 (Q2, AOR=1.10, 95% CI=1.01–1.19; Q3, AOR=1.19, 95% CI=1.10–1.29; Q4, AOR=1.15, 95% CI=1.33–1.57). The prevalence of hypertension was significantly higher in men with hyperuricemia than in those without hyperuricemia (AOR=1.33, 95% CI=1.25–1.42) (Table 2a). Among women, Q3 and Q4 were significantly associated with hypertension compared with Q1 (Q3, AOR=1.22, 95% CI=1.03–1.45; Q4, AOR=1.51, 95% CI=1.27–1.78). The prevalence of hypertension was significantly higher in women with hyperuricemia than in those without hyperuricemia (AOR=1.81, 95% CI=1.27–2.60) (Table 2b).
Table 2.
Hypertension Among (a) Men (n=52,637) and (b) Women (n=32,649) (Logistic Regression Analysis)
| Mean (SD) or No. (%) | Univariate | Multivariate | ||||||||
|---|---|---|---|---|---|---|---|---|---|---|
| OR | 95% CI | P Value | Model 1 | Model 2 | ||||||
| AOR | 95% CI | P Value | AOR | 95% CI | P Value | |||||
| (a) | ||||||||||
| Hyperuricemia, yes | 10,507 (20.0) | 1.79 | 1.71–1.87 | a | – | 1.33 | 1.25–1.42 | a | ||
| Uric acid, mg/dL | ||||||||||
| Q1<5.3 | 12,622 (24.0) | – | – | – | ||||||
| 5.3≤Q2<6.0 | 12,141 (23.1) | 1.04 | 0.98–1.11 | 1.10 | 1.01–1.19 | b | – | |||
| 6.0≤Q3<6.8 | 13,706 (26.0) | 1.29 | 1.22–1.36 | a | 1.19 | 1.10–1.29 | a | – | ||
| 6.8≤Q4 | 14,168 (26.0) | 1.89 | 1.79–2.00 | a | 1.15 | 1.33–1.57 | a | – | ||
| Age, y | 45.1 (11.5) | 1.08 | 1.07–1.08 | a | 1.08 | 1.07–1.08 | a | 1.07 | 1.07–1.08 | a |
| Body mass index, kg/m2 | 23.6 (3.3) | 1.22 | 1.21–1.23 | a | 1.21 | 1.20–1.22 | a | 1.21 | 1.20–1.22 | a |
| Dyslipidemia, yes | 23,858 (45.3) | 2.22 | 2.13–2.31 | a | 1.22 | 1.16–1.30 | a | 1.23 | 1.17–1.31 | a |
| Diabetes mellitus, yes | 2516 (4.8) | 4.44 | 4.09–4.82 | a | 1.93 | 1.72–2.17 | a | 1.89 | 1.68–2.12 | a |
| Alcohol consumption (nondaily drinker) | 36,413 (69.2) | 0.55 | 0.53–0.57 | a | 0.67 | 0.63–0.70 | a | 0.66 | 0.62–0.70 | a |
| Smoking behavior (nonsmoker) | 32,782 (62.3) | 1.13 | 1.08–1.18 | a | 1.13 | 1.07–1.20 | a | 1.13 | 1.07–1.20 | a |
| eGFR, mL/min/1.73 m2 | 81.9 (14.7) | 0.97 | 0.97–0.98 | a | 1.00 | 0.99–1.01 | 1.00 | 0.99–1.01 | ||
| (b) | ||||||||||
| Hyperuricemia, yes | 328 (1.0) | 5.92 | 4.75–7.38 | a | – | 1.81 | 1.27–2.60 | a | ||
| Uric acid, mg/dL | ||||||||||
| Q1<3.7 | 7395 (22.7) | – | – | |||||||
| 3.7≤Q2<4.3 | 8306 (25.4) | 1.36 | 1.20–1.63 | a | 1.15 | 0.96–1.37 | – | a | ||
| 4.3≤Q3<4.9 | 8087 (24.8) | 1.88 | 1.67–2.141 | a | 1.22 | 1.03–1.45 | b | – | a | |
| 4.9≤Q4 | 8861 (27.1) | 4.20 | 3.78–4.68 | a | 1.51 | 1.27–1.78 | a | – | a | |
| Age, y | 42.9 (12.1) | 1.11 | 1.10–1.11 | a | 1.11 | 1.10–1.11 | a | 1.11 | 1.10–1.11 | a |
| Body mass index, kg/m2 | 21.4 (3.4) | 1.24 | 1.23–1.26 | a | 1.22 | 1.20–1.24 | a | 1.23 | 1.21–1.25 | a |
| Dyslipidemia, yes | 7699 (23.6) | 4.06 | 3.79–4.35 | a | 1.17 | 1.05–1.31 | a | 1.20 | 1.07–1.34 | a |
| Diabetes mellitus, yes | 458 (1.4) | 9.16 | 7.60–11.05 | a | 2.03 | 1.50–2.76 | a | 1.96 | 1.44–2.67 | a |
| Alcohol consumption (nondaily drinker) | 28,451 (87.1) | 0.71 | 0.65–0.78 | a | 0.65 | 0.57–0.74 | a | 0.62 | 0.54–0.71 | a |
| Smoking behavior (nonsmoker) | 27,868 (85.4) | 1.01 | 0.89–1.13 | 0.96 | 0.81–1.13 | 0.94 | 0.80–1.12 | |||
| eGFR, mL/min/1.73 m2 | 88.2 (17.2) | 0.97 | 0.96–0.97 | a | 1.01 | 1.00–1.01 | a | 1.00 | 1.00–1.01 | |
Abbreviations: AOR, adjusted odds ratio; CI, confidence interval; OR, odds ratio; SD, standard deviation. a P<.01. a P<.05. Model 1 was adjusted for serum uric acid quartiles (Q), age (years), body mass index, dyslipidemia (yes), diabetes mellitus (yes), alcohol consumption (nondaily drinker), smoking (nonsmoker), and estimated glomerular filtration rate (eGFR; mL/min/1.73 m2). Model 2 was adjusted for hyperuricemia (yes), age (years), body mass index, dyslipidemia (yes), diabetes mellitus (yes), alcohol consumption (nondaily drinker), smoking (nonsmoker), and eGFR (mL/min/1.73 m2).
Figures 1 and 2 show the direct relationships between SBP/DBP and SUA quartiles in men and women. For both sexes, with each increase in SUA (by quartile) was directly associated with increases in SBP and DBP (P<.01).
Figure 1.
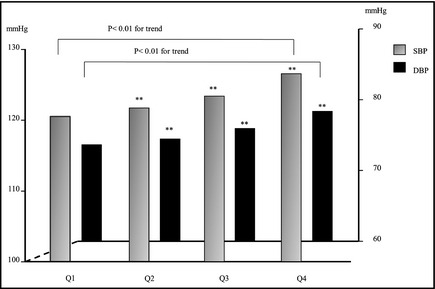
Relationship between serum uric acid quartiles (Q) and blood pressure among male participants. Blood pressure between Q1 and other quartiles were compared with Dunnett's method. Trends in P values were estimated using the Jonckheere‐Terpstra test for continuous variables. **P<.01. SBP indicates systolic blood pressure; DBP, diastolic blood pressure.
Figure 2.

Relationship between serum uric acid quartiles (Q) and blood pressure among female participants. Blood pressure between Q1 and other quartiles were compared with Dunnett's method. Trends in P values were estimated using the Jonckheere‐Terpstra test for continuous variables. **P<.01. SBP indicates systolic blood pressure; DBP, diastolic blood pressure.
Discussion
Our large‐scale cross‐sectional study revealed a significant association between hyperuricemia and hypertension in both sexes. Moreover, SUA ≥5.3 mg/dL (315 μmol/L) in men and ≥4.3 mg/dL (256 μmol/L) in women were also associated with hypertension after adjusting for age (years), BMI, dyslipidemia (yes), diabetes mellitus (yes), alcohol consumption (nondaily drinker), smoking (nonsmoker), and eGFR (mL/min/1.73 m2). SUA quartiles were also found to be significantly associated with SBP and DBP. To our knowledge, only a few studies have investigated the association between SUA levels and/or hyperuricemia and the prevalence of hypertension among the Japanese population, and our results are consistent with these reports.8
We found that hyperuricemia was an important factor associated with hypertension, as well as other lifestyle‐related disorders such as dyslipidemia and diabetes mellitus, in men and women. Several studies have reported an association between hyperuricemia and hypertension.8, 9, 10, 11 For instance, a Japanese epidemiological study reported that the OR of hypertension was 1.20 for each 1 mg/dL (59.48 μmol/L) increase in SUA levels after multiple adjustment, and ORs in the highest quartile were 1.58 (1.44–1.75) in men and 1.60 (1.39–1.84) in women, compared with the lowest SUA quartile.8 A cross‐sectional study conducted in the United States involving 4817 National Health and Nutrition Examination Survey 1999–2002 participants revealed that higher SUA levels were positively associated with prehypertension, and the multivariate OR comparing Q4 of uric acid (>356.9 μmol/L) with Q1 (<237.9 μmol/L) was 1.96 (1.38–2.79).9 In addition to these studies, others have reported an association between hyperuricemia and the risk of incident hypertension. A population‐based cohort study, which observed 2520 hypertension‐free individuals in the United States over the course of 10 years, found that the multivariate relative risk comparing the highest quartile of SUA (≥390 μmol/L) with the lowest quartile (≤260 μmol/L) was 1.65 (1.41–1.93).10 Another study, which examined 3329 Framingham Study participants for 4 years, reported that a one SD higher SUA was associated with an OR of 1.17 (1.02–1.33) for developing hypertension, and an OR of 1.11 (1.01–1.23) for BP progression.11
There are several potential explanations for the association between SUA and elevated BP. One such explanation involves insulin resistance. SUA levels are likely to be affected by insulin resistance.22, 23, 24 For instance, the Group of Italian Scientists of Insulin Resistance (GISIR) reported that TG and SUA were positively correlated with fasting plasma insulin and negatively correlated with glucose metabolized during hyperinsulinemic euglycemic clamp.23 In a prospective cohort study that examined 2071 Japanese men without hyperuricemia and diabetes mellitus, it was found that increased homeostasis model assessment of insulin resistance (HOMA‐IR) independently predicted the subsequent development of hyperuricemia, and the hazard ratio associated with an increase of one SD in HOMA‐IR (1.85 as one geometric SD of HOMA‐IR) was 1.14 (1.03–1.28).24
Insulin resistance plays an important role in the pathophysiology of the metabolic syndrome.25 The impact of the metabolic syndrome on the development of cardiovascular disease and mortality from the disease has been emphasized worldwide.26, 27 Elevated insulin levels are likely to reduce excretion of uric acid in urine.28 Although hyperinsulinemia may contribute to the development of hypertension as well as other components of the metabolic syndrome, our results suggest an independent association between SUA and hypertension, even after adjusting for these components. In fact, several studies have reported findings similar to ours, in which participants with hyperuricemia were likely to be obese and have diabetes mellitus and dyslipidemia, all of which are closely associated with insulin resistance. Although we did not assess insulin resistance in the present study, we found a positive association between SUA levels/hyperuricemia and hypertension after adjusting for multiple factors. Thus, it is possible that hyperuricemia may contribute to an elevation in BP via insulin resistance.
A second possibility is renal dysfunction modified by elevated SUA levels. In our results, eGFR with hyperuricemia was lower compared with that without one. Several studies have reported that a decrease in renal perfusion is associated with elevated SUA.29, 30, 31 For instance, a population‐based cohort study reported that participants with progressively elevated and persistently high SUA levels had a significantly higher risk of developing CKD (eGFR <60 mL/min/1.73 m2) compared with those with persistently low SUA levels (adjusted hazard ratio [95% CI] 2.05 [1.24–3.38] vs 1.90 [1.34–2.71]).30 Elevated BP is closely associated with CKD and SUA via activation of the renin‐angiotensin system, and better management of SUA, while also taking into account renal function, may be necessary for the primary and secondary prevention of cardiovascular disease.31
Finally, pathophysiological mechanisms involving endothelial dysfunction and oxidative stress related to elevated SUA may contribute to elevated BP,5, 32 eg, by reducing arterial stiffness. In one study, which included 4140 participants from the Generation 3 Framingham cohort, a significant association was found between SUA levels and carotid‐femoral pulse wave velocity and carotid‐radial pulse wave velocity in a younger Caucasian population.33
Study Limitations
Our study has several limitations worth noting. First, selection bias may have been present, as participants comprised only those who underwent workplace medical checkups in Tokyo, Japan. As such, these participants may be inherently more aware of health behaviors relative to residents in rural areas. Further analyses including data from a more diverse cohort are necessary. Second, some key data were not collected, such as concentrations and other detailed information of medications used. Moreover, insulin resistance, endothelial dysfunction, oxidative stress, and inflammation status were not assessed in the study. Third, this study had a cross‐sectional design, and thus causal relationships between elevated SUA and BP could not be evaluated. Further analyses of follow‐up survey data will be needed to address this issue.
Conclusions
Our large‐scale cross‐sectional study revealed that hyperuricemia was significantly associated with hypertension in both sexes, and SUA ≥5.3 mg/dL (315 μmol/L) in men and ≥4.3 mg/dL (256 μmol/L) in women were associated with the prevalence of hypertension after adjusting for age (years), BMI, dyslipidemia (yes), diabetes mellitus (yes), alcohol consumption (nondaily drinker), smoking (nonsmoker), and eGFR (mL/min/1.73 m2). SUA quartiles were also significantly related to SBP and DBP. Our findings suggest a possible association between hyperuricemia and hypertension, and underscore the importance of maintaining normal SUA levels to manage or prevent hypertension. Better management of SUA as well as BP levels may have potential in preventing future cardiovascular disorders.
Conflicts of interest
The authors have no conflicts of interest to declare.
Funding
None.
Acknowledgments
The authors thank the participants who underwent the voluntary workplace medical checkup, and the data collection staff at the Tokyo Health Service Association.
J Clin Hypertens (Greenwich). 2016;18:53–59. DOI 10.1111/jch.12627. © 2015 Wiley Periodicals, Inc.
References
- 1. World Health Organization . Global Health Observatory: Raised blood pressure. http://www.who.int/gho/ncd/risk_factors/blood_pressure_prevalence_text/en/. Accessed March 5, 2015.
- 2. Shimamoto K, Ando K, Fujita T, et al. Japanese Society of Hypertension Committee for Guidelines for the Management of Hypertension . The Japanese Society of Hypertension Guidelines for the Management of Hypertension (JSH 2014). Hypertens Res. 2014;37:253–390. [DOI] [PubMed] [Google Scholar]
- 3. Lawes CM, Vander Hoorn S, Rodgers A. International Society of Hypertension. Global burden of blood‐pressure‐related disease, 2001. Lancet. 2008;371:1513–1518. [DOI] [PubMed] [Google Scholar]
- 4. Frohlich ED. Uric acid. A risk factor for coronary heart disease. JAMA. 1993;270:378–379. [DOI] [PubMed] [Google Scholar]
- 5. Feig DI, Kang DH, Johnson RJ. Uric acid and cardiovascular risk. N Engl J Med. 2008;359:1811–1821. [DOI] [PMC free article] [PubMed] [Google Scholar]
- 6. Wang S, Shu Z, Tao Q, et al. Uric acid and incident chronic kidney disease in a large health check‐up population in Taiwan. Nephrology. 2011;16:767–776. [DOI] [PubMed] [Google Scholar]
- 7. Nagahama K, Inoue T, Kohagura K, et al. Hyperuricemia predicts future metabolic syndrome: a 4‐year follow‐up study of a large screened cohort in Okinawa, Japan. Hypertens Res. 2014;37:232–238. [DOI] [PubMed] [Google Scholar]
- 8. Kuwabara M, Niwa K, Nishi Y, et al. Relationship between serum uric acid levels and hypertension among Japanese individuals not treated for hyperuricemia and hypertension. Hypertens Res. 2014;37:785–789. [DOI] [PubMed] [Google Scholar]
- 9. Syamala S, Li J, Shankar A. Association between serum uric acid and prehypertension among US adults. J Hypertens. 2007;25:1583–1589. [DOI] [PubMed] [Google Scholar]
- 10. Shankar A, Klein R, Klein BE, Nieto FJ. The association between serum uric acid level and long‐term incidence of hypertension: population‐based cohort study. J Hum Hypertens. 2006;20:937–945. [DOI] [PubMed] [Google Scholar]
- 11. Sundström J, Sullivan L, D'Agostino RB, et al. Relations of serum uric acid to longitudinal blood pressure tracking and hypertension incidence. Hypertension. 2005;45:28–33. [DOI] [PubMed] [Google Scholar]
- 12. Verdecchia P, Schillaci G, Reboldi G, et al. Relation between serum uric acid and risk of cardiovascular disease in essential hypertension. The PIUMA study. Hypertension. 2000;36:1072–1078. [DOI] [PubMed] [Google Scholar]
- 13. Feig DI, Soletsky B, Johnson RJ. Effect of allopurinol on blood pressure of adolescents with newly diagnosed essential hypertension: a randomized trial. JAMA. 2008;300:924–932. [DOI] [PMC free article] [PubMed] [Google Scholar]
- 14. Kang DH, Han L, Ouyang X, et al. Uric acid causes vascular smooth muscle cell proliferation by entering cells via a functional urate transporter. Am J Nephrol. 2005;25:425–433. [DOI] [PubMed] [Google Scholar]
- 15. Corry DB, Eslami P, Yamamoto K, et al. Uric acid stimulates vascular smooth muscle cell proliferation and oxidative stress via the vascular renin‐angiotensin system. J Hypertens. 2008;26:269–275. [DOI] [PubMed] [Google Scholar]
- 16. Warnick GR, Knopp RH, Fitzpatrick V, Branson L. Estimating low‐density lipoprotein cholesterol by the Friedewald equation is adequate for classifying patients on the basis of nationally recommended cut points. Clin Chem. 1990;36:15–19. [PubMed] [Google Scholar]
- 17. Kashiwagi A, Kasuga M, Araki E, et al. Committee on the Standardization of Diabetes Mellitus‐Related Laboratory Testing of Japan Diabetes Society. International clinical harmonization of glycated hemoglobin in Japan: from Japan Diabetes Society to National Glycohemoglobin Standardization Program values. J Diabetes Investig. 2012;3:39–40. [DOI] [PMC free article] [PubMed] [Google Scholar]
- 18. Japan Atherosclerosis Society . Guidelines for Prevention of Atherosclerotic Cardiovascular Diseases 2012. Tokyo, Japan: Kyorinsha Co., Ltd; 2012. [Google Scholar]
- 19. Guideline Revising Committee of Japanese Society of Gout and Nucleic Acid Metabolism . Revised Guideline for the Management of Hyperuricemia and Goat. Osaka: Medical Review Co., Ltd, 2012. (In Japanese) [Google Scholar]
- 20. Belloc NB, Breslow L. Relationship of physical health status and health practices. Prev Med. 1972;1:409–421. [DOI] [PubMed] [Google Scholar]
- 21. Yokokawa H, Goto A, Sanada H, et al. Achievement status toward goal blood pressure levels and healthy lifestyles among Japanese hypertensive patients; Cross sectional survey results from Fukushima Research of Hypertension (FRESH). Intern Med. 2011;50:1149–1156. [DOI] [PubMed] [Google Scholar]
- 22. Vuorinen‐Markkola H, Yki‐Järvinen H. Hyperuricemia and insulin resistance. J Clin Endocrinol Metab. 1994;78:25–29. [DOI] [PubMed] [Google Scholar]
- 23. Bonora E, Capaldo B, Perin PC, et al. Group of Italian Scientists of Insulin Resistance (GISIR) . Hyperinsulinemia and insulin resistance are independently associated with plasma lipids, uric acid and blood pressure in non‐diabetic subjects. The GISIR database. Nutr Metab Cardiovasc Dis. 2008;18:624–631. [DOI] [PubMed] [Google Scholar]
- 24. Nakamura K, Sakurai M, Miura K. HOMA‐IR and the risk of hyperuricemia: a prospective study in non‐diabetic Japanese men. Diabetes Res Clin Pract. 2014;106:154–160. [DOI] [PubMed] [Google Scholar]
- 25. Giles TD, Sander GE. Pathophysiologic, diagnostic, and therapeutic aspects of the metabolic syndrome. J Clin Hypertens (Greenwich). 2005;7:669–678. [DOI] [PMC free article] [PubMed] [Google Scholar]
- 26. Ninomiya T, Kubo M, Doi Y, et al. Impact of metabolic syndrome on the development of cardiovascular disease in a general Japanese population: the Hisayama study. Stroke. 2007;38:2063–2069. [DOI] [PubMed] [Google Scholar]
- 27. Malik S, Wong ND, Franklin SS, et al. Impact of the metabolic syndrome on mortality from coronary heart disease, cardiovascular disease, and all causes in United States adults. Circulation. 2004;110:1245–1250. [DOI] [PubMed] [Google Scholar]
- 28. Muscelli E, Natali A, Bianchi S, et al. Effect of insulin on renal sodium and uric acid handling in essential hypertension. Am J Hypertens. 1996;9:746–752. [DOI] [PubMed] [Google Scholar]
- 29. Feig DI. Hyperuricemia and hypertension. Adv Chronic Kidney Dis. 2012;19:377–385. [DOI] [PubMed] [Google Scholar]
- 30. Chou YC, Kuan JC, Yang T, et al. Elevated uric acid level as a significant predictor of chronic kidney disease: a cohort study with repeated measurements. J Nephrol. 2014. Nov 20 [Epub ahead of print]. [DOI] [PubMed] [Google Scholar]
- 31. Sedaghat S, Hoorn EJ, van Rooij FJ, et al. Serum uric acid and chronic kidney disease: the role of hypertension. PLoS One. 2013;8:e76827. [DOI] [PMC free article] [PubMed] [Google Scholar]
- 32. Khosla UM, Zharikov S, Finch JL, et al. Hyperuricemia induces endothelial dysfunction. Kidney Int. 2005;67:1739–1742. [DOI] [PubMed] [Google Scholar]
- 33. Mehta T, Nuccio E, McFann K, et al. Association of uric acid with vascular stiffness in the Framingham Heart Study. Am J Hypertens. 2015;28:277–283. [DOI] [PMC free article] [PubMed] [Google Scholar]