

Abstract
The origin of the eukaryotic cell is considered one of the major evolutionary transitions in the history of life. Current evidence strongly supports a scenario of eukaryotic origin in which two prokaryotes, an archaebacterial host and an α-proteobacterium (the free-living ancestor of the mitochondrion), entered a stable symbiotic relationship. The establishment of this relationship was associated with a process of chimerization, whereby a large number of genes from the α-proteobacterial symbiont were transferred to the host nucleus. A general framework allowing the conceptualization of eukaryogenesis from a genomic perspective has long been lacking. Recent studies suggest that the origins of several archaebacterial phyla were coincident with massive imports of eubacterial genes. Although this does not indicate that these phyla originated through the same process that led to the origin of Eukaryota, it suggests that Archaebacteria might have had a general propensity to integrate into their genomes large amounts of eubacterial DNA. We suggest that this propensity provides a framework in which eukaryogenesis can be understood and studied in the light of archaebacterial ecology. We applied a recently developed supertree method to a genomic dataset composed of 392 eubacterial and 51 archaebacterial genera to test whether large numbers of genes flowing from Eubacteria are indeed coincident with the origin of major archaebacterial clades. In addition, we identified two potential large-scale transfers of uncertain directionality at the base of the archaebacterial tree. Our results are consistent with previous findings and seem to indicate that eubacterial gene imports (particularly from δ-Proteobacteria, Clostridia and Actinobacteria) were an important factor in archaebacterial history. Archaebacteria seem to have long relied on Eubacteria as a source of genetic diversity, and while the precise mechanism that allowed these imports is unknown, we suggest that our results support the view that processes comparable to those through which eukaryotes emerged might have been common in archaebacterial history.
Keywords: Bayesian supertrees, symbiosis, Archaebacteria, tree of life
1. Introduction
Over the past 100 years, a multitude of hypotheses have been proposed to explain eukaryogenesis. These hypotheses can be considered as variants of two main models, autogenous and symbiotic. The autogenous model proposes that all eukaryotic membranes and their membrane-bound organelles (mitochondria and plastids) evolved through a process of compartmentalization and infolding of plasma membranes [1,2]. However, the results of empirical studies based on phylogenetics [3–9], cell biology [10,11], bioenergetics [12], as well as considerations of the Archaean fossil record [13,14] and the absence of primitively amitochondriate eukaryotes [15] overwhelmingly support a symbiotic origin, where the mitochondria and the plastids are the descendants of free-living organisms, and did not evolve autogenously (reviewed in [14]). Of the many symbiotic scenarios that have been proposed (e.g. [16–20]; see [14] for a recent review), current evidence favours a single endosymbiotic event in which the ancestor of the mitochondrion (an α-proteobacterium) and the host cell (an archaebacterium) merged to become the first eukaryote. This hypothesis, generally referred to as the ‘ring of life’ hypothesis [21], has its roots in in the eocyte hypothesis that was first introduced by Lake [3,22], who defined the unknown archaebacterial sister group of the eukaryotes as the ‘eocyte’. Initially, phylogenetic analyses suggested that the eocyte was most likely the sister group of the Crenarchaeota [3]. However, the most recent and sophisticated studies carried out to address this problem point towards the Thaumarchaeota, Aigarchaeota, Crenarchaeota, Korarchaeota group [23] as the most likely closest relative of the eocyte [8,9,24]. Under this well-supported scenario, the emergence of the first eukaryote must have post-dated the origins and initial radiations of both the α-Proteobacteria and the Archaebacteria. As a consequence, and despite the radically different cellular organization and subsequent ecological success of the eukaryotes, Eukaryota is younger than Archaebacteria and Eubacteria, and thus it cannot have been one of the primary lineages of life [8,14].
The symbiotic hypothesis for the origin of the eukaryotes implies that at least one extinct archaebacterium (the eocyte) had phagocytic abilities and could integrate the genome of another prokaryote to establish a stable symbiotic relationship. The greatest perceived weakness of the symbiotic hypothesis is that the ability to engulf another prokaryote is unknown in Archaebacteria and has only been reported in a eubacterium (a β-proteobacterium [24,25]). Thus, the symbiotic theory has sometimes been referred to as the ‘fateful encounter’ hypothesis [26] because it seems to depend upon a rare and improbable event. Here, we ask whether there is evidence for an alternative view that ancestral Archaebacteria could have been broadly capable of engaging in processes of phagocytosis, cell fusions and foreign-genome integration, all of which were likely prerequisites to the establishment of stable symbiosis.
2. The eocyte had the potential to enter into a relationship of symbiosis
Studies of archaebacterial genomes have recently demonstrated the presence of actin-like proteins in Archaebacteria [27–29]. These proteins are related to those found in Eukaryota and could have allowed ancestral Archaebacteria to create branched filamentous structures and networks that could have facilitated particle engulfment [26,27,30]. An argument that was frequently used against an eocyte ancestry of the eukaryotes is that archaebacterial membranes use glycerol-1-phosphate lipids, while eukaryotic and eubacterial membranes use glycerol-3-phosphate lipids, and that the evolution of eukaryotic membranes through intermediates composed of both lipids would have been ‘selectively disfavoured’ [31]. Yet, recent experiments have shown that heterochiral hybrid membranes consisting of a mixture of glycerol-1- and glycerol-3-phosphate lipids can be synthesized and are stable [32]. Archaebacteria with eubacterial ectosymbionts have been discovered [33], and more recently, it has been shown that at least some archaebacterial species (Haloferax volcanii and H. mediterranei) can engage in processes of cell fusion that have as a consequence the generation of recombinant heterodiploid chromosomes [34,35]. Lastly, the Lokiarchaeota, an archaebacterial phylum with sophisticated membrane remodelling capabilities and possessing a multitude of proteins that in eukaryotes are involved in phagocytosis, has recently been discovered [24]. Overall, this evidence suggests that, in principle, ancient Archaebacteria could have been capable of engulfing other prokaryotic cells, establishing stable symbiotic relationships with them, and integrating the foreign genomes with their own. What is unclear is how frequently Archaebacteria were involved in the above-mentioned processes. If these processes were frequent, eukaryogenesis would have just been an accident waiting to happen: a consequence of archaebacterial ecology.
3. Evidence for ancient gene flows and genome chimerization in Archaebacteria
Nelson-Sathi et al. [36,37] recently presented results suggesting that the emergence of several extant archaebacterial lineages correlates with several large inflows of genes acquired through massive, horizontal gene transfers (HGTs) from eubacterial donors (i.e. imports). These imports (from Eubacteria to specific archaebacterial ancestors) were massive and may constitute signatures of ancient chromosomal recombination events. In the case of the Haloarchaea, Nelson-Sathi et al. [36,37] concluded that these eubacterial genes were mainly imported from Actinobacteria. However, for other archaebacterial groups (Thermoproteales, Desulfurococcales, Methanobacteriales, Methanococcales and Methanosarcinales), the origins of which seem to have been preceded by extensive imports of eubacterial genes [37], a specific donor lineage could not be defined. This might be because HGT-based prokaryotic recombination, as opposed to sex-based eukaryotic recombination, leads to chimeric pangenomes where individual genes frequently have different phylogenetic histories. That is, the eubacterial partners in these putative, ancient, hybridization events would have been chimerical organisms to start with [38,39].
If the results of Nelson-Sathi and co-workers could be confirmed, their impact on our understanding of eukaryogenesis would be dramatic, as we should conclude that large-scale gene flows from the Eubacteria were common in archaebacterial history. This would provide a general framework for understanding eukaryogenesis in the context of archaebacterial ecology. Accordingly, while eukaryogenesis will still be a momentous singular event in the history of life, we would now be able to understand and explain it as a consequence of archaebacterial ecology.
4. Using supertrees to test hypotheses of symbiogenesis and large-scale genes flows
Supertree methods are general tools that can be used to amalgamate trees on overlapping leaf sets, with the standard consensus methods, e.g. the majority-rule consensus method [40], representing special cases where all the input trees have the same leaf set [41].
Supertree methods can be used in genomics to combine partially overlapping gene trees to make inferences about the species phylogeny and/or to investigate patterns of congruence and incongruence between realized supertrees and specific sets of gene trees. The latter has been used previously to test hypotheses of eukaryogenesis and to demonstrate the chimeric nature of eukaryotic genomes [5]. Using this approach, Pisani and co-workers were able to find genome-wide evidence for evolutionary relationships between chloroplasts and the Cyanobacteria, mitochondria and the α-Proteobacteria, and the eukaryotic nucleus and the Archaebacteria. Pisani et al. [5] also built a supertree including only Archaebacteria and Eubacteria and found no support for chimerism in archaebacterial genomes. Instead, they found maximal bootstrap support for the separation of Eubacteria and Archaebacteria. These results are incompatible with those of Nelson-Sathi et al. [36,37], which predict that supertree analyses would partition the Archaebacteria into multiple groups scattered across the Eubacteria. However, the work of Pisani et al. [5] had limitations: it used a much smaller number of genomes than those available to Nelson-Sathi et al. [37] and relied upon a parsimony based supertree method with undesirable properties [42–46].
Akanni et al. [47] recently implemented and tested a new Bayesian supertree method based on Steel & Rodrigo's [48] maximum-likelihood (ML) supertree computation. Here, we have improved our supertree implementation by correcting the likelihood calculations following the results of Bryant & Steel [49]. This new supertree method was implemented in the phylogenetic package P4 [50] and here we use this method to test Nelson-Sathi et al.'s [37] results with an independent methodological approach and a different dataset composed of 392 eubacterial and 51 archaebacterial taxa.
5. Material and methods
(a). Defining the dataset
A dataset composed of 834 genomes (including multiple species per genus and in some cases multiple strains per species—and representing all prokaryotic taxa for which a complete genome was available in the NCBI database in early 2013) was assembled and distilled into a dataset of 392 eubacterial and 51 archaebacterial genera (see §6 for details). We deem this dataset large enough to allow a robust test of the results of Nelson-Sathi et al. [37] while maintaining tractability within the context of a supertree-based phylogenomic analysis. Supertrees were generated using three datasets. The first dataset, hereafter referred to as PROK, is composed of gene trees derived from gene families assembled from the complete set of 51 archaebacterial and 392 eubacterial genera. The second dataset was derived by pruning all of the archaebacterial sequences from the gene trees in PROK. This dataset includes only sequences from the 392 considered eubacterial genera and was named EUBAC. The third dataset was generated by pruning all eubacterial sequences from PROK; it was named ARC, and contains only sequences for the 51 considered Archaebacteria. If Nelson-Sathi et al. [37] are correct, the PROK supertree should not recover a monophyletic Archaebacteria. Instead, various archaebacterial clades should be scattered across Eubacteria because of the strongly asymmetrical pattern of gene imports (from Eubacteria to Archaebacteria) underpinning the origin of multiple archaebacterial clades [37]. Furthermore, because Archaebacteria to Archaebacteria HGTs do not seem to have significantly impacted archaebacterial evolution [37], we would expect the emergence of vertical signal in ARC, leading to the recovery of a generally accepted archaebacterial tree of life, with the traditionally recognized archaebacterial phyla and superphyla well supported and arranged as in trees derived from the analysis of ribosomal proteins only [51–55].
If Nelson-Sathi et al. [37] are incorrect, the analysis of PROK should recover a well-supported monophyletic Archaebacteria emerging as the sister group of an equally well-supported monophyletic Eubacteria. It should be noted that even in this case a tree broadly consistent with the generally accepted archaebacterial tree of life should emerge from the analysis of ARC. Accordingly, the ARC supertree will be used as a benchmark to confirm that our novel supertree implementation performs well. Recovering a scrambled ARC phylogeny should warn us that our software might contain errors, or that the method we implemented has inherent biases or weaknesses.
Finally, inspection of the EUBAC supertree should inform us about the extent to which large-scale, directional, Eubacteria to Eubacteria transfers affected eubacterial evolution. If such events were irrelevant in eubacterial evolution, EUBAC would be expected to return a tree with a topology consistent with that of the generally accepted eubacterial tree of life (e.g. [52]). On the contrary, if these events were important in eubacterial evolution, eubacterial clades would be scrambled and directionality of transfers (something we do not investigate here) could be investigated through the interpretation of proximity relationships in the EUBAC supertree.
(b). Data acquisition and processing
All prokaryotic proteomes available from the NCBI database in early 2013 (a total of 834 including multiple species across genera and in some cases multiple strains) were downloaded and merged into the PROK database (which included 2 727 153 protein sequences). An all-versus-all blast search was performed (with an e-value cut-off of 10 × 10−8) using BLAST 2.2.19 [56]. Homologous protein families, tribes sensu [57], were then identified using the Markov Cluster algorithm, MCL [58]. The MCL analysis of PROK (granularity parameter = 1.4) returned 386 576 gene families of which 82 844 included four or more sequences. Families including fewer than four sequences were discarded, as they are not amenable to phylogenetic analysis. The 82 844 gene families that included more than four sequences included 47 725 single gene families (scoring only orthologues—if one assumes no hidden paralogy) and 35 119 multi-gene families (including both orthologues and paralogues).
Examination of the MCL families showed that some of the 35 119 multi-gene families obtained from the MCL analyses included many paralogy groups, which could have been split into orthology sets and used for supertree reconstruction. We further partitioned these multi-gene families using the ‘Randomblast’ algorithm [59] implemented using a PERL script written by James Cotton (Wellcome Trust Sanger Institute). The Randomblast algorithm works by iteratively choosing a sequence randomly, blasting it against all the other sequences and removing those with a significant hit until all sequences are removed. This method has previously been shown to work well for defining sets of orthologues for supertree reconstruction [5], as it efficiently breaks multi-gene families into their paralogy groups. In the randomblast analysis, smaller e-values will break each multi-gene family into progressively more numerous families of progressively more closely related taxa. An e-value that is too small would generate very small sets of orthologues that would not be adequate to reconstruct prokaryotic supertrees. Alternative e-values were tested and an e-value of 10 × 10−16 was deemed suitable for this specific dataset. It partitioned the 35 119 multi-gene families that were generated using MCL into 69 070 families, of which 4734 were single gene families including more than four species. These 4734 single gene families were added to the 47 725 single gene families from the MCL analysis to generate a total of 52 459 single gene families.
(c). Building gene trees
To infer gene trees, all 52 459 single gene families were aligned with PRANK [60]. The multiple sequence alignments were curated with Gblocks [61] using the following parameters: allow gaps in all positions; maximum number of contiguous non-conserved positions = 15 and minimum length of a block = 8. After the Gblocks step, all gene families that were composed of fewer than 100 amino acid positions were discarded as likely to be too short to allow the generation of reliable phylogenetic trees (see also [5]). Absence of putative phylogenetic signal in the data was tested in the remaining gene families using the permutation tail probability (PTP) test [62,63], significance level p = 0.05—as implemented in PAUP v. 4b10 [64]. All supertree analyses were run at the genus level by retaining only one species of each included genus in each gene family, resulting in a reduction in the number of considered taxa to 392 eubacterial genera and 51 archaebacterial genera (see also §5a). If more than one species belonging to the same genus was present in a given gene family, the retained species was randomly selected. This makes the strong assumption of monophyly of genera that is necessary for improving taxonomic overlap between input trees. All gene families that passed the PTP test (p < 0.05) were used to infer ML trees in RAxML [65]. The GTR + Gamma + F model was used for all alignments longer than 200 amino acids. To avoid overparametrization, the LG + Gamma + F model was used for alignments shorter than 200 amino acids. More parameter-rich models that can account for compositional heterogeneities in the data [50,66] were not used and this is an important limitation of our study because incongruence among gene trees could have been exacerbated by the use of compositionally homogeneous models (LG and GTR) that might not have a good fit to the data. A total of 16 463 partially overlapping gene trees were generated using the above-described strategy and these gene trees constitute the trees in the PROK dataset. Two thousand eight hundred and eighty-seven gene trees contained at least one Archaebacteria and 1512 gene trees show Archaebacteria clustering with Eubacteria. PROK was then used to create EUBAC and ARC by pruning all eubacterial and archaebacterial taxa, respectively, from the trees in PROK. Because some gene trees included only Archaebacteria or Eubacteria and because after pruning, some gene trees were left to include less than four taxa the EUBAC and ARC datasets include, respectively, 14 558 gene trees spanning a total of 392 taxa, and 1776 gene trees spanning a total of 51 taxa.
(d). Identification of unstable taxa
Taxa that are under-represented in gene trees (generally because they have a reduced genome) might be unstable in supertree analyses, artificially increasing the perceived incongruence among gene trees (e.g. [47]). Here, the concatabomination approach [67] was used to identify and remove taxa that were likely to be unstable because of poor taxonomic coverage in gene trees. Two more datasets PROK-minus and EUBAC-minus were created where all taxa identified as unstable because of poor taxonomic overlap were pruned from all gene trees. No unstable taxa were identified in ARC (even though Nanoarchaeum was unstable in the context of the PROK dataset). Accordingly, we did not have to create an ARC-minus dataset. Because we wanted to avoid the negative effects of unstable taxa on our results, only the PROK-minus, EUBAC-minus and ARC datasets were subjected to further analyses.
(e). Supertree analyses
The gene trees in PROK-minus, EUBAC-minus and ARC were used as input to Bayesian supertree analyses performed in p4 [50]. All Bayesian analyses were run with two parallel independent chains and with the model parameter set to implement the likelihood model of Steel & Rodrigo [48], with the normalizing alpha parameter approximated as in [49] and the beta parameter, a dataset-specific value that reflects concordance among the input trees, set to be a free parameter estimated during tree search. This is different and represents a significant improvement over the Bayesian supertree implementation of Akanni et al. [47] that was based on the original method of Steel & Rodrigo [48]. All analyses were run until convergence was achieved while sampling every 5000 iterations, see §6 for details referring to each specific analysis. Convergence between the two independent Markov chain Monte Carlo (MCMC) chains was monitored by plotting the sampled trees' likelihood values, and the total number of trees retained post-burn-in varied with analyses. The chains were stopped after they reached convergence and majority-rule consensus trees with minority components were generated from the trees sampled after convergence to generate our Bayesian supertrees. Support for internal branches was estimated with reference to the posterior probabilities (PP) of the recovered splits.
(f). Comparisons with the generally accepted topology of the tree of life
We first tested whether the PROK-minus supertree was significantly better than random using the YAPTP test [59]. To implement the YAPTP test, we generated 100 random trees on the same leaf set as PROK-minus in PAUP v. 4b10. The likelihood of each random tree and of the PROK-minus supertree was obtained using L.U.St. [68] recoded to implement the ML method of Steel & Rodrigo [48] as modified in [49]. The latest implementation of L.U.St. can be downloaded from bitbucket (https://afro-juju@bitbucket.org/afro-juju/l.u.st.git). The distribution of likelihood scores for the random trees and for the PROK-minus supertree were plotted in R to reveal whether the likelihood of PROK-minus was significantly better than that of the random trees. To test alternative hypotheses about the tree of life, a supertree-based version [68] of the approximately unbiased (AU) [69] test was used to compare the PROK-minus supertree against the generally accepted topology for the tree of life. The latter was obtained by modifying the tree of Ciccarelli et al. [52], which has arguably become the most widely used reference topology for the tree of life in both textbooks and the scientific literature, to include all and only the species considered in our study. Given that eukaryotes are not included in our dataset, the fact that the Ciccarelli et al. [52] tree is outdated (in that it does not display the eocyte topology) is not a problem for our analyses. The supertree-based AU test was calculated using L.U.St. [68] to obtain input-treewise likelihood values for all gene trees under both compared supertrees. These values were then used as input for CONSEL [70] that was used to perform the AU test.
(g). Identification of directional Eubacteria to Archaebacteria gene imports
All gene trees in PROK-minus that included at least one archaebacterium (2887 trees) were visually inspected, and the same strategy as used by Pisani et al. [5] to identify prokaryotic outgroups of eukaryotic genes was used to identify eubacterial outgroups of archaebacterial genes. To root the gene trees, we assumed the topology of the standard tree of life [52] to be correct. A directional HGT (from Eubacteria to Archaebacteria) was assumed in all instances where a gene was found to have a widespread distribution in Eubacteria but a very limited distribution in (specific to a phylum or to a few related taxa) Archaebacteria. We acknowledge that such gene trees could also be the result of multiple (independent) lineage-specific gene losses; however, such a scenario would be significantly less parsimonious than one assuming a single HGT. In many cases, the direction of transfer could be unambiguously identified: in cases where a gene tree could not be rooted on the Eubacteria–Archaebacteria split while at the same time resolving: (i) Archaebacteria and Eubacteria as monophyletic and (ii) the generally accepted relationships within Archaebacteria and Eubacteria. To clarify, an example would be a tree including an archaebacterial phylum (say the Haloarchaea), and two eubacterial lineages, say Actinobacteria and Proteobacteria. Such a tree will unambiguously support a directional transfer from Eubacteria to Archaebacteria if, when rooted on the Archaebacteria–Eubacteria split, it would display Actinobacteria and Proteobacteria as paraphyletic with reference to each other. On the contrary, a tree where the transfer is most parsimonious but not unambiguous would be one where the rooted tree defined on the Archaebacteria–Eubacteria split is one where Actinobacteria and Proteobacteria emerge as monophyletic. Genes with a broad distribution in Archaebacteria and Eubacteria were assumed to have been vertically inherited, and genes trees where clear monophyletic or paraphyletic groups could not be defined (e.g. where Archaebacteria known to belong to the same phylum were scattered across Eubacteria) were considered ambiguous and not included in our counts. As we did not use trees that could not be clearly interpreted based on current phylogenetic knowledge, our estimated number of imports should be considered conservative. Numbers of imported genes (from Eubacteria) were transformed into proportions of the total number of imports observed to better compare the relevance of imports from different eubacterial groups. For each considered archaebacterial lineage, the average number of transfers across all donors was calculated. The mean number of imports indicates the number of transfers that would be expected from each donor if HGT were randomly distributed. Median, standard deviation, quartiles and donors that contributed an anomalous (significantly high) number of genes to a specific archaebacterial group were identified. Significantly high imports were identified in two different ways. Firstly, for each considered archaebacterial group, a standard Shapiro–Wilk test [71] was performed (in R) to evaluate whether it was possible to reject the hypothesis that the distribution of imports across donors was normally distributed. If the hypothesis of normality could not be rejected, donors with a significantly high proportion of imports were identified as those falling outside the 95% confidence interval of the considered distribution. If the distribution was not normal, donors that provided an anomalously high number of genes were identified as those falling beyond the third quartile + 1.5 of the interquartile range (IQR). These donors are those that would be identified as falling outside the box and whiskers in a standard Tukey's boxplot. Finally, for all considered archaebacterial groups, the distribution of imports across all donors was visually represented using boxplots. Because imports from two eubacterial lineages (Clostridia and δ-Proteobacteria) were significantly high across many archaebacterial groups and generally high across all Archaebacteria, the above-mentioned approach was repeated twice, once including all imports across all archaebacterial lineages, and once after having excluded Clostridia and δ-Proteobacteria.
6. Results
Poor taxonomic overlap is a known source of instability in supertree analyses (e.g. [72]), and it can significantly reduce the branch support and resolution of a supertree. However, lack of resolution in a supertree can also be caused by important biological factors (e.g. HGTs and the signature of symbioses) and it is key to eliminate the effect of unstable taxa if we are to understand the relative strengths of vertical and horizontal signals in the data. Using the concatabomination approach [67], we identified the genome of Ureaplasma, a member of the Mollicutes (electronic supplementary material, figure S1a), to be the most unstable genus in PROK. Fifteen more unstable taxa were identified (electronic supplementary material, figure S1b–d), only one of which was an archaebacterium (Nanoarchaeum). Exclusion of all these taxa eliminates the instability caused by poor taxonomic overlap across gene trees in PROK. Notably, Nanoarchaeum caused instability in PROK but not in ARC so it was not excluded from the latter. Through the exclusion of unstable taxa in PROK and EUBAC, we generated the PROK-minus and EUBAC-minus datasets. These two datasets, together with ARC, were used for all subsequent analyses.
The PROK-minus Bayesian supertree analysis reached convergence at 1.05 million iterations and a total of 780 trees were sampled from the post-burn-in MCMC chains. The majority-rule consensus with minority components obtained from the sampled trees is our PROK-minus supertree and is presented in figure 1. It has many poorly supported groups (PP < 0.5) indicated by dotted lines in figure 1 and if these were suppressed it would be very poorly resolved. Of the 25 prokaryotic phyla represented in this tree by more than one genus only a few (Deferribacteres, Deinococcus/Thermus, Chlorobi, Fusobacteria, Plantomycetes, Thaumarchaeota, Aquificae and Thermotogae) appear monophyletic. The PROK-minus tree is generally better supported closer to the tips and with deeper nodes poorly supported. This is in line with the results of the previous supertree studies of Creevey et al. [59] and Pisani et al. [5], that found that relatively strong vertical signal exists only towards the tips of the prokaryotic tree. Signal erosion in datasets intended to be used to resolve the relationships among the primary lineages of life is in part a consequence of the complexity of trying to infer ancient divergences using limited amounts of often substitutionally saturated sequence data. However, we suggest that in our supertree analysis, poor resolution is primarily a consequence of the signal associated with vertical inheritance not being the principal determinant of prokaryotic evolution. Analyses of PROK-minus failed to recover a supertree that could be rooted in such a way as to make Archaebacteria and Eubacteria monophyletic. In figure 1, this tree has been arbitrarily rooted only for visualization proposes, as an unrooted representation would have been impractical with this number of taxa. Clades cannot be defined on an unrooted tree so groups in this tree should be considered clans (sensu [73]). In this tree, the clans corresponding to the Methanobacteriales, Methanococcales, Thermococcales and Methanopyrales are interspersed across the Actinobacteria and Bacteriodetes clans [73]. The Methanomicrobiales clan emerges within a clan mostly composed of δ-Proteobacteria. The Archaeoglobales, Thermoplasmatales and Aciduliprufundum emerge in a clan with β-Proteobacteria. Halobacteria, Methanocellales and Methanosarcinales form clans that also include γ-Proteobacteria. Sulfolobales form a clan of their own, while Desulfurococcales are interspersed across γ- and α-Proteobacteria. Finally, Thaumarchaeota and Thermoproteales nest in a clan including δ-Proteobacteria, Planctomycetes, Cyanobacteria and Chlamidiae/Verrucomicrobia. Despite its unconventional topology, the YAPTP test showed that the PROK-minus tree is not random (figure 2), and the AU test showed that it fits our dataset significantly better than a tree displaying the generally accepted topology for the tree of life (p = 1.00 × 10−112). Note, however, that most of the above-mentioned relationships have PP < 0.5 and should not be interpreted as sister-group relationships between the considered taxa. Rather, we suggest that our results should be taken to indicate that there are multiple, contradictory, vertical and horizontal signals in the data.
Figure 1.

The PROK-minus supertree. This tree fails to display monophyletic Archaebacteria and Eubacteria. Branches with support lower than 0.5 are represented using dotted lines. The outer ring in the figure identifies archaebacterial (pink) and eubacterial (light blue) taxa.
Figure 2.
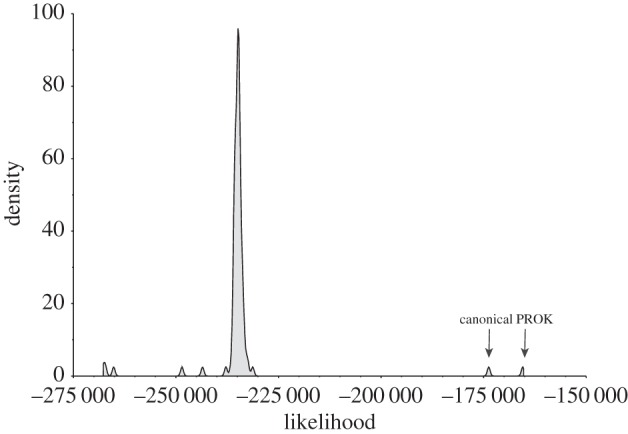
Results of the YAPTP test, illustrating the distribution of likelihoods for 100 random trees and the PROK-minus supertree. For completeness, we also included the canonical tree of life in this figure. Both PROK-minus and the generally accepted (i.e. canonical) tree of life fit our data significantly better than Random (p ∼ 0).
The EUBAC-minus Bayesian analysis reached convergence at 2.3 million, and a total of 680 trees were sampled from the post-burn-in MCMC chains and summarized using the majority-rule consensus method with minority components to derive the EUBAC-minus supertree (figure 3). Similarly to the case of the PROK-minus supertree also the EUBAC-minus supertree was arbitrarily rooted; it has to be considered as an unrooted tree and groups in this tree should be considered clans rather than clades (see above). Eubacterial relationships inferred from the EUBAC-minus supertree do not represent a significant improvement with reference to those in the PROK-minus supertree of figure 1.
Figure 3.

The EUBAC-minus supertree. This tree fails to display most eubacterial groups traditionally considered to represent monophyletic lineages. Branches with support lower than 0.5 are represented using dotted lines.
Proportions and origins of archaebacterial genes with horizontal history are reported in table 1, electronic supplementary material, table S1, and figure 4 together with descriptive statistics. Our results suggest that there is evidence that relatively large numbers of genes of eubacterial origin have entered specific archaebacterial groups independently. The average proportions of imports in the two tables indicate the expected gene flows under the assumption that imports are randomly distributed across all donors. Figure 4 is a boxplot representation of the data in electronic supplementary material, table S1, and it helps identify eubacterial taxa that seem to have contributed significant numbers of genes to specific archaebacterial groups. Of all considered eubacterial lineages, only three (Actinobacteria, Clostridia and δ-Proteobacteria) show significantly high exports towards the Archaebacteria when all donors are included in the analysis (electronic supplementary material, table S1). These three lineages are not the most highly represented in our dataset and thus these results do not seem to be dependent on eubacterial sampling density. In detail, an anomalously high number of imports can be observed from Clostridia and δ-Proteobacteria into most archaebacterial groups (electronic supplementary material, table S1, and figure 4), and from Actinobacteria into Thermoplasmatales (electronic supplementary material, table S1). A high, even if not significant, number of imports from Actinobacteria is also observed into Haloarchaea, Sulfolobales and Thermoproteales.
Table 1.
Distribution of proportion of eubacterial imports across Archaebacteria. Tha, Thaumarchaeota; Nan, Nanoarchaeota; Sul, Sulfolobales; Thc, Thermococcales; Thr, Thermoproteales; Des, Desulfurococcales; Aci, Acidolobales; Acu, Aciduliprofundum; Hal, Haloarchaea; Thp, Thermoplasmatales; Mes, Methanosarcinales; Mem, Methanomicrobiales; Meb, Methanobacteriales; Met, Methanococcales; Mep, Methanopyrales; Arc, Archaeoglobales; Mec, Methanocellales; Planctomyc, Planctomycetales; Proteobac, Proteobacteria; Chrysiogenet, Chrysiogenetes; Deferribac, Deferribacteres; GSED, Gemmatimonadetes + Synergistetes + Elusimicrobia + Dictyoglomi.
| eubacterial donors | Archaebacteria |
||||||||||||||||
|---|---|---|---|---|---|---|---|---|---|---|---|---|---|---|---|---|---|
| Tha | Nan | Sul | Thc | Thr | Des | Aci | Acu | Hal | Thp | Mes | Mem | Meb | Met | Mep | Arc | Mec | |
| Actinobacteria | 9.4 | 3.6 | 13.0 | 9.3 | 12.8 | 10.8 | 8.3 | 8.0 | 12.9 | 11.7 | 10.7 | 10.3 | 10.9 | 7.7 | 10.4 | 8.5 | 12.5 |
| Deinococcus/Thermus | 4.1 | 1.8 | 3.8 | 6.7 | 3.5 | 5.4 | 4.2 | 3.1 | 5.2 | 3.9 | 2.6 | 2.1 | 2.2 | 1.8 | 3.7 | 3.6 | 3.7 |
| Chlorobi | 3.8 | 1.8 | 1.9 | 2.8 | 1.6 | 2.0 | 2.1 | 2.7 | 1.5 | 1.1 | 4.5 | 4.2 | 2.5 | 3.7 | 1.2 | 3.4 | 2.1 |
| Cyanobacteria | 4.5 | 3.6 | 1.9 | 2.1 | 1.4 | 1.8 | — | 2.7 | 3.4 | 1.1 | 4.3 | 4.2 | 3.4 | 3.1 | 1.8 | 2.2 | 3.0 |
| Fusobacteria | 1.1 | 1.8 | 1.9 | 0.8 | 1.9 | 1.6 | 2.8 | 2.3 | 1.5 | 1.7 | 2.0 | 1.7 | 2.5 | 2.2 | 0.6 | 1.0 | 1.2 |
| Planctomyc | 3.8 | 7.3 | 2.3 | 2.6 | 2.1 | 3.6 | 2.8 | 2.3 | 3.7 | 3.4 | 2.4 | 2.4 | 2.2 | 2.4 | 3.0 | 1.6 | 2.1 |
| Acidobacteria | 3.0 | 3.6 | 1.9 | 1.6 | 1.4 | 1.2 | 2.1 | 1.9 | 1.4 | 2.8 | 1.9 | 2.1 | 3.1 | 1.7 | 1.2 | 1.8 | 1.8 |
| Deferribac | 0.8 | 5.5 | 0.4 | 2.3 | 1.9 | 2.2 | 1.4 | 2.3 | 1.1 | 1.1 | 1.4 | 1.2 | 1.5 | 2.0 | 1.8 | 2.8 | 0.9 |
| Chloroflex | 4.9 | 1.8 | 5.0 | 4.9 | 6.1 | 5.4 | 4.9 | 5.3 | 7.2 | 6.1 | 6.6 | 4.6 | 4.7 | 4.4 | 6.1 | 5.9 | 10.4 |
| Thermotogae | 1.5 | 5.5 | 3.1 | 7.8 | 4.0 | 5.4 | 4.9 | 7.6 | 1.4 | 2.8 | 2.7 | 2.0 | 2.1 | 3.1 | 3.0 | 2.6 | 1.2 |
| Firmicutes | 1.1 | 5.5 | 0.8 | 1.0 | 2.1 | 1.4 | — | 2.7 | 1.2 | — | 1.9 | 1.7 | 2.9 | 2.6 | 0.6 | 1.6 | 2.1 |
| Bacilli | 6.4 | 1.8 | 8.0 | 4.7 | 9.3 | 5.4 | 5.6 | 5.0 | 7.4 | 6.1 | 5.8 | 7.2 | 9.0 | 7.6 | 5.5 | 5.7 | 4.9 |
| Aquificae | 3.4 | 1.8 | 5.7 | 4.9 | 4.7 | 4.6 | 7.6 | 5.0 | 1.9 | 5.0 | 3.3 | 2.8 | 4.7 | 7.0 | 7.3 | 6.3 | 2.7 |
| Chlamidiae | 2.6 | 3.6 | 4.2 | 2.8 | 3.0 | 3.0 | 2.1 | 1.5 | 3.0 | 5.6 | 2.2 | 1.8 | 2.4 | 2.0 | 4.3 | 3.4 | 3.0 |
| Bacteroidetes | 8.3 | 7.3 | 7.3 | 7.8 | 7.0 | 6.4 | 7.6 | 7.6 | 7.8 | 8.9 | 9.4 | 8.1 | 9.3 | 8.1 | 7.9 | 8.1 | 7.9 |
| Spirochete | 6.8 | 5.5 | 5.0 | 6.7 | 6.5 | 6.4 | 7.6 | 9.5 | 4.5 | 5.0 | 5.2 | 5.7 | 6.2 | 7.9 | 6.1 | 6.3 | 7.0 |
| α-Proteobac | 9.8 | 9.1 | 10.0 | 7.2 | 7.9 | 7.4 | 4.9 | 6.5 | 11.0 | 8.9 | 7.9 | 9.8 | 7.1 | 7.9 | 8.5 | 7.9 | 10.4 |
| β-Proteobac | 8.6 | 7.3 | 6.1 | 4.4 | 6.5 | 4.6 | 10.4 | 4.2 | 8.1 | 6.7 | 6.6 | 7.4 | 4.4 | 6.1 | 6.7 | 6.9 | 6.7 |
| γ-Proteobac | 9.0 | 5.5 | 6.5 | 7.0 | 7.5 | 9.8 | 7.6 | 8.4 | 11.1 | 8.4 | 10.9 | 11.6 | 10.2 | 8.7 | 11.0 | 10.1 | 10.4 |
| ε-Proteobac | 3.4 | 5.5 | 3.1 | 2.3 | 2.3 | 3.2 | 5.6 | 2.3 | 2.2 | 3.4 | 2.7 | 3.8 | 2.8 | 3.5 | 1.2 | 3.0 | 1.8 |
| Chrysiogenet | — | 3.6 | 0.4 | 1.0 | 0.2 | 0.2 | 0.7 | 0.4 | 0.3 | 0.6 | 0.7 | 0.6 | 0.7 | 1.1 | — | 1.0 | 0.3 |
| GSED | 3.8 | 7.3 | 7.7 | 9.3 | 6.3 | 7.8 | 6.9 | 8.8 | 2.3 | 5.6 | 4.4 | 4.9 | 5.2 | 5.2 | 7.9 | 6.5 | 3.7 |
| averages | 4.8 | 4.5 | 4.5 | 4.5 | 4.5 | 4.5 | 5.0 | 4.5 | 4.5 | 4.8 | 4.5 | 4.5 | 4.5 | 4.5 | 4.8 | 4.5 | 4.5 |
| s.d. | 2.9 | 2.2 | 3.3 | 2.8 | 3.2 | 2.8 | 2.7 | 2.8 | 3.7 | 3.0 | 3.0 | 3.2 | 3.0 | 2.6 | 3.3 | 2.8 | 3.7 |
| 95% CI (UP) | 10.4 | 8.9 | 11.0 | 10.0 | 10.8 | 10.1 | 10.3 | 10.0 | 11.9 | 10.7 | 10.5 | 10.8 | 10.4 | 9.6 | 11.2 | 9.9 | 11.7 |
| 99% CI (UP) | 12.2 | 10.3 | 13.0 | 11.7 | 12.7 | 11.9 | 12.0 | 11.7 | 14.2 | 12.6 | 12.3 | 12.8 | 12.3 | 11.2 | 13.2 | 11.6 | 14.0 |
| median | 3.8 | 4.5 | 4.0 | 4.5 | 3.7 | 4.6 | 4.9 | 3.6 | 3.2 | 5.0 | 3.8 | 4.0 | 3.2 | 3.6 | 4.3 | 3.5 | 3.0 |
| first quartile | 3.0 | 2.3 | 1.9 | 2.3 | 1.9 | 2.1 | 2.6 | 2.3 | 1.5 | 2.8 | 2.3 | 2.0 | 2.4 | 2.3 | 1.8 | 2.3 | 1.9 |
| third quartile | 6.8 | 5.5 | 6.4 | 6.9 | 6.5 | 6.2 | 7.6 | 7.3 | 7.4 | 6.1 | 6.4 | 6.8 | 5.9 | 7.4 | 7.3 | 6.5 | 6.9 |
| IQR | 3.8 | 3.2 | 4.5 | 4.6 | 4.6 | 4.1 | 5.0 | 5.1 | 5.9 | 3.4 | 4.1 | 4.8 | 3.5 | 5.2 | 5.5 | 4.2 | 5.0 |
| third quartile + 1.5*IQR | 12.4 | 10.2 | 13.2 | 13.8 | 13.4 | 12.3 | 15.2 | 14.9 | 16.2 | 11.2 | 12.6 | 14.0 | 11.2 | 15.2 | 15.5 | 12.8 | 14.5 |
| Shapiro–Wilk test (p-value) | 0.07 | 0.02 | 0.14 | 0.08 | 0.06 | 0.39 | 0.29 | 0.03 | 0.00 | 0.33 | 0.02 | 0.02 | 0.01 | 0.01 | 0.12 | 0.08 | 0.00 |
Figure 4.

Boxplot representing, for each considered archaebacterial group, the distribution of imports from different eubacterial donors. This figure uses proportions of imports from electronic supplementary material, figure S1. In red: Clostridia, in blue: δ-Proteobacteria. Tha, Thaumarchaeota; Nan, Nanoarchaeota; Sul, Sulfolobales; Thc, Thermococcales; Thr, Thermoproteales; Des, Desulfurococcales; Aci, Acidolobales; Acu, Aciduliprofundum; Hal, Haloarchaea; Thp, Thermoplasmatales; Mes, Methanosarcinales; Mem, Methanomicrobiales; Meb, Methanobacteriales; Met, Methanococcales; Mep, Methanopyrales; Arc, Archaeoglobales; Mec, Methanocellales.
Repeating the analyses after having excluded Clostridia and the δ-Proteobacteria (table 1) showed that once these ‘outliers' are removed other significant donors emerge. In particular, Actinobacteria now emerge as having donated significantly high proportions of genes to Sulfolobales, Thermoproteales, Thermoplasmatales and Desulfurococcales, with Haloarchaea still being high but not significant. β-Proteobacteria seem to have significantly contributed to the Acidolobales, and γ-Proteobacteria to the Archaeoglobales.
The ARC Bayesian analysis reached convergence after 500 000 iterations and 600 post-burn-in trees were used to build the ARC supertree (figure 5). In contrast to the analyses of PROK-minus and EUBAC-minus, the ARC analysis (figure 5) returned a tree that is in excellent agreement with those recovered from studies based on ribosomal proteins only (e.g. [51–55]). Accordingly, this tree was rooted following previous studies in archaebacterial evolution, and the groups in this tree, contrary to the case of PROK-minus and EUBAC-minus, represent clades, not clans. In this tree, Haloarchaea emerges from the methanogens, and Crenarchaeota can be seen as the sister group of the Thaumarchaeota. In addition to having a topology comparable to that of other archaebacterial phylogenies, the ARC supertree is also ‘perfectly’ supported, that is, all splits in this tree have PP = 1.
Figure 5.

The ARC supertee. All nodes in this tree have PP = 1. Green stars indicate proposed large-scale transfers as inferred from our results. The two transfers at the base of the Archaebacteria tree might not necessarily be imports. They might also indicate large-scale exports towards δ-Proteobacteria and Clostridia (respectively). Other green stars indicate possible imports rather than exports. The yellow stars indicate large-scale imports compatible with our results and those of Nelson-Sathi et al. [37]. Finally, blue stars indicate large-scale transfers suggested by Nelson-Sathi et al. [37] but that could not be confirmed here.
7. Discussions
Our analyses did not recover a tree for Archaebacteria and Eubacteria that reflects the relationships expected according to the generally accepted topology of the tree of life. However, the results of the YAPTP test and the AU test indicate that our analyses found a tree that is not random and has better fit to our data than the generally accepted tree of life. These results might seem counterintuitive but are not. The methods implemented in our analysis are bound to return a tree based on the strongest signal in the data. Because we used genes sampled from across all genomes rather than a subset of functionally and evolutionarily-related proteins cleaned from all suspected HGTs, as it was done in Ciccarelli et al. [52], for example, the supertree is a composite derived from the interactions of vertical and horizontal signals. When seen in this way, our results indicate that there are congruent horizontal signals in the data that are strong enough to eclipse the vertical signals. We conjecture that, as suggested by Nelson-Sathi et al. [37], this is probably because Eubacteria to Archaebacteria imports are not randomly distributed. Rather, specific archaebacterial lineages mostly imported genes from well-defined eubacterial donors (e.g. δ-Proteobacteria, Clostridia and Actinobacteria; see electronic supplementary material, table S1; table 1 and figure 4). As a consequence of having imported large numbers of eubacterial genes from multiple sources, Archaebacteria are scattered across Eubacteria in the PROK-minus supertree. When Eubacteria are excluded from the analyses (i.e. when ARC is analysed), we obtain very strong support for the generally accepted archaebacterial tree, PP = 1 across all nodes. We suggest that this result confirms that the unusual topology of PROK-minus is a consequence of large imports of genes by Archaebacteria. Overall, we suggest that our results should be interpreted as supporting the hypothesis of Nelson-Sathi et al. [37], that while massive gene flows from Eubacteria are concomitant with the origin of archaebacterial clades, Archaebacteria to Archaebacteria transfers and exports from Archaebacteria to Eubacteria have been significantly less common throughout the history of life.
Ancestral Archaebacteria seem to have integrated large numbers of genes primarily from Eubacteria. Such large directional influxes of genes to well-defined archaebacterial recipients are consistent with the idea that a single eubacterial donor might have been in some way engulfed by the archaebacterial recipients passing its genes en masse to the recipient. Perhaps this happened through processes of phagocytosis followed by chromosomal recombination, or through processes of endosymbiosis, whereby the symbiont was progressively simplified and its genes transferred to the host nucleus. Similar simplification processes are known to have happened in eukaryotic organelles [74], nucleomorphs [7], and in extant animal symbionts like the Blochmannia floridanus symbionts of ants [75].
Nelson-Sathi et al. [37] identified six archaebacterial groups the origins of which seem to have been coincident with large-scale imports from Eubacteria. These are Thermoproteales, Desulfurococcales, Methanobacteriales, Methanococcales, Methanosarcinales and Haloarchaea. For the latter of these groups, these authors were able to identify Actinobacteria as the primary source of eubacterial genes [36,37]. Here, we have corroborated the latter result even though the actinobacterial import into Haloarchaea, while high, is not statistically significant. In line with the results of Nelson-Sathi and co-workers, we identified further imports from Actinobacteria into Thermoproteales and Desulfurococcales. However, we also identified significant Actinobacterial imports in Sulfolobales and Thermoplasmatales (table 1). Because Thermoproteales, Sulfolobales, Desulfurococcales form a clade in our archaebacterial tree (figure 5) and given that also Acidolobales displayed a relatively high proportion of actinobacterial genes (electronic supplementary material, table S1; table 1), this result is suggestive of a single chimerization event that involved an actinobacterium and a common ancestor of these phyla (figure 5). We further found that almost all archaebacterial lineages have an often-significant excess of genes shared with δ-Proteobacteria and Clostridia (electronic supplementary material, table S1; figure 4). Because genes shared with δ-Proteobacteria and Clostridia have a broad archaebacterial distribution, these genes are suggestive of either two more chimerization events that happened in the archaebacterial stem lineage, or of two large-scale transfers from Archaebacteria to Eubacteria (figure 5). Finally, significantly higher imports from γ-Proteobacteria into Archaeoglobales and from β-Proteobacteria into Acidolobales were identified, suggestive of two more chimerization events.
The EUBAC analysis, by failing to identify traditional eubacterial phyla as potentially monophyletic, indicates that directional Eubacteria to Eubacteria transfers might have been common in eubacterial evolution. For example, the Coriobacteriaceae seem to have been involved in directional HGT from Bacteroidetes, Ehrlichiaceae from the γ-Proteobacteria, and the Rickettsiaceae from the Nitrosomonadales (γ-Proteobacteria). Overall, the complexity of the EUBAC tree indicates that HGT had a greater impact in eubacterial evolution, and much more detailed analyses would be necessary to better understand directional patterns and the magnitude of HGTs in this primary lineage of life.
8. Conclusion
We performed an updated supertree analyses for the eubacterial and archaebacterial lineages using a recently developed and seemingly well-founded, Bayesian supertree method. Our results could not recover a monophyletic Archaebacteria when all eubacterial and archaebacterial genomes were considered simultaneously. These results are in disagreement with a previous supertree study [5]. While we did not address what could have caused this discrepancy in detail, differences between the two studies included the supertree method used and the number of genomes considered, and differences between the two studies are most likely a consequence of one or both of these factors.
How to interpret the generally accepted tree of life in light of HGTs and symbiotic events has long been debated [6,14,21,22,27,37,76,77], and the traditional interpretation of the ‘tree of life’, as representing the major determinant of the evolutionary processes that underpinned the origin and early diversification of life on Earth, has become obsolete [78]. Yet Puigbò and co-workers suggested that the tree topology represented by the canonical tree of life should still be seen as a statistical central tendency: a tree topology embedded in a phylogenetic network of life. This is because, according to these authors, this is the only tree topology that is broadly agreed upon by at the least a subset of genes across all of life: the NUTs (nearly universal trees) of Puigbò et al. [78]. Our supertrees partially reject the view of Puigbò et al. [78]. This is because, while a central tendency can be defined using large numbers of genes, a non-random supertree is recovered from the analyses of the PROK dataset with a topology that is different from and in substantial disagreement with Puigbò's NUTs [78] and with that of the generally accepted 18S rRNA tree of life [79,80]. At the same time, our results suggest that the traditional archaebacterial tree as recovered from the 18S rRNA and various datasets composed of ribosomal proteins is indicative of a real evolutionary pattern, as this tree topology can be recovered from the ARC dataset (i.e. when eubacterial lineages are pruned out from PROK). Indeed, also in the previous supertree study of Pisani et al. [5], nodes in Archaebacteria had higher support than nodes in Eubacteria, and Nelson-Sathi et al. [36,37] pointed out that Archaebacteria are less prone than Eubacteria to engage in HGTs. However, how to interpret the tree in figure 5 in light of the tendency of Archaebacteria to engage in large-scale transfers from Eubacteria (and perhaps to Eubacteria) is far from obvious. Certainly, the tree of figure 5 cannot be interpreted, in isolation, as representing the principal determinant of archaebacterial evolution, or as the complete evolutionary history of the archaebacterial genomes, as it does not describe the large-scale imports that seem to have shaped archaebacterial genome evolution. It certainly seems to indicate that vertical evolutionary processes are more important in Archaebacteria than they are in Eubacteria.
Our results are consistent with recent findings [14,36,37] suggesting that the origin of major archaebacterial lineages was coincident with large-scale gene imports into Archaebacteria. However, in addition, we also identified two large-scale transfers (not necessarily imports) at the base of the Archaebacteria. These might be the first evidence for large-scale directional transfers from Archaebacteria to Eubacteria, but further tests would be necessary to better understand this result. Together with the absence of primitively amitochondriate eukaryotes [15], recent discoveries of the existence of giant Archaebacteria with eubacterial ectosymbionts [33], the presence of eukaryotic-like actin genes across Archaebacteria [27], biotechnological evidence indicating that Archaebacteria can undergo cell fusion followed by the generation of recombinant chromosomes [34,35], evidence that heterochiral hybrid membranes consisting of a mixture of glycerol-1- and glycerol-3-phosphate lipids can be synthesized and are stable [32] and the recent discovery of the Lokiarchaeota, with their sophisticated membrane remodelling capabilities and large repertoire of genes that in eukaryotes are related to phagocytosis [24], our results reinforce evidence in favour of a symbiotic origin of the Eukaryota.
The encounter between the eocyte and the α-proteobacterial mitochondrial ancestor was a momentous event in the history of life, and most likely it was an obvious consequence of archaebacterial ecology.
Supplementary Material
Acknowledgements
The authors thank Prof. Embley and Dr Williams for inviting us to contribute to this special issue of Philosophical Transactions of the Royal Society.
Data accessibility
All data have been deposited into the Dryad dataset: http://dx.doi.org/10.5061/dryad.2r732.
Authors' contributions
D.P., W.A.A. and J.O.M. designed the experimental protocol. W.A.A. ran all the analyses. W.A.A. and D.P. created the figures and tables. W.A.A., P.G.F., C.C. and M.W. implemented the methods. K.S. ran the concatabomination analysis. All authors contributed to the writing of the manuscript.
Competing interests
We declare we have no competing interests.
Funding
W.A.K. and M.W. were supported by a BBSRC grant no. BB/K007440/. M.W. was additionally supported by Templeton Foundation grant no. 43915. D.P. and J.O.M.C.I. were supported by a Science Foundation Ireland grant no. RFP-EOB-3106, and by a Templeton Foundation grant no. 48177.
References
- 1.Cavalier-Smith T. 2002. The phagotrophic origin of eukaryotes and phylogenetic classification of Protozoa. Int. J. Syst. Evol. Microbiol. 52, 297–354. [DOI] [PubMed] [Google Scholar]
- 2.Devos DP, Reynaud EG. 2010. Intermediate steps. Science 330, 1187–1188. ( 10.1126/science.1196720) [DOI] [PubMed] [Google Scholar]
- 3.Lake JA, Henderson E, Oakes M, Clark MW. 1984. Eocytes: a new ribosome structure indicates a kingdom with a close relationship to eukaryotes. Proc. Natl Acad. Sci. USA 81, 3786–3790. ( 10.1073/pnas.81.12.3786) [DOI] [PMC free article] [PubMed] [Google Scholar]
- 4.Tourasse NJ, Gouy M. 1999. Accounting for evolutionary rate variation among sequence sites consistently changes universal phylogenies deduced from rRNA and protein-coding genes. Mol. Phylogenet. Evol. 13, 159–168. ( 10.1006/mpev.1999.0675) [DOI] [PubMed] [Google Scholar]
- 5.Pisani D, Cotton JA, McInerney JO. 2007. Supertrees disentangle the chimerical origin of eukaryotic genomes. Mol. Biol. Evol. 24, 1752–1760. ( 10.1093/molbev/msm095) [DOI] [PubMed] [Google Scholar]
- 6.Cox CJ, Foster PG, Hirt RP, Harris SR, Embley TM. 2008. The archaebacterial origin of eukaryotes. Proc. Natl Acad. Sci. USA 105, 20 356–20 361. ( 10.1073/pnas.0810647105) [DOI] [PMC free article] [PubMed] [Google Scholar]
- 7.Alvarez-Ponce D, Lopez P, Bapteste E, McInerney JO. 2013. Gene similarity networks provide tools for understanding eukaryote origins and evolution. Proc. Natl Acad. Sci. USA 110, E1594–EE603. ( 10.1073/pnas.1211371110) [DOI] [PMC free article] [PubMed] [Google Scholar]
- 8.Williams TA, Foster PG, Cox CJ, Embley TM. 2013. An archaeal origin of eukaryotes supports only two primary domains of life. Nature 504, 231–236. ( 10.1038/nature12779) [DOI] [PubMed] [Google Scholar]
- 9.Williams TA, Embley TM. 2014. Archaeal ‘dark matter’ and the origin of eukaryotes. Genome Biol. Evol. 6, 474–481. ( 10.1093/gbe/evu031) [DOI] [PMC free article] [PubMed] [Google Scholar]
- 10.Cotton JA, McInerney JO. 2010. Eukaryotic genes of archaebacterial origin are more important than the more numerous eubacterial genes, irrespective of function. Proc. Natl Acad. Sci. USA 107, 17 252–17 255. ( 10.1073/pnas.1000265107) [DOI] [PMC free article] [PubMed] [Google Scholar]
- 11.Alvarez-Ponce D, McInerney JO. 2011. The human genome retains relics of its prokaryotic ancestry: human genes of archaebacterial and eubacterial origin exhibit remarkable differences. Genome Biol. Evol. 3, 782–790. ( 10.1093/gbe/evr073) [DOI] [PMC free article] [PubMed] [Google Scholar]
- 12.Lane N, Martin W. 2010. The energetics of genome complexity. Nature 467, 929–934. ( 10.1038/nature09486) [DOI] [PubMed] [Google Scholar]
- 13.Parfrey LW, Lahr DJ, Knoll AH, Katz LA. 2011. Estimating the timing of early eukaryotic diversification with multigene molecular clocks. Proc. Natl Acad. Sci. USA 108, 13 624–13 629. ( 10.1073/pnas.1110633108) [DOI] [PMC free article] [PubMed] [Google Scholar]
- 14.McInerney JO, O'Connell MJ, Pisani D. 2014. The hybrid nature of the Eukaryota and a consilient view of life on Earth. Nat. Rev. Microbiol. 12, 449–455. ( 10.1038/nrmicro3271) [DOI] [PubMed] [Google Scholar]
- 15.Hirt RP, Logsdon JM, Healy B, Dorey MW, Doolittle WF, Embley TM. 1999. Microsporidia are related to fungi: evidence from the largest subunit of RNA polymerase II and other proteins. Proc. Natl Acad. Sci. USA 96, 580–585. ( 10.1073/pnas.96.2.580) [DOI] [PMC free article] [PubMed] [Google Scholar]
- 16.Sagan L. 1967. On the origin of mitosing cells. J. Theor. Biol. 14, 225 ( 10.1016/0022-5193(67)90079-3) [DOI] [PubMed] [Google Scholar]
- 17.Schwartz RM, Dayhoff MO. 1978. Origins of prokaryotes, eukaryotes, mitochondria, and chloroplasts. Science 199, 395–403. ( 10.1126/science.202030) [DOI] [PubMed] [Google Scholar]
- 18.Rivera MC, Lake JA. 1992. Evidence that eukaryotes and eocyte prokaryotes are immediate relatives. Science 257, 74–76. ( 10.1126/science.1621096) [DOI] [PubMed] [Google Scholar]
- 19.Moreira D, López-García P. 1998. Symbiosis between methanogenic Archaea and δ-Proteobacteria as the origin of eukaryotes: the syntrophic hypothesis. J. Mol. Evol. 47, 517–530. ( 10.1007/PL00006408) [DOI] [PubMed] [Google Scholar]
- 20.López-García P, Moreira D. 1999. Metabolic symbiosis at the origin of eukaryotes. Trends Biochem. Sci. 24, 88–93. ( 10.1016/S0968-0004(98)01342-5) [DOI] [PubMed] [Google Scholar]
- 21.Rivera MC, Lake JA. 2004. The ring of life provides evidence for a genome fusion origin of eukaryotes. Nature 431, 152–155. ( 10.1038/nature02848) [DOI] [PubMed] [Google Scholar]
- 22.Lake JA. 1988. Origin of the eukaryotic nucleus determined by rate-invariant analysis of rRNA sequences. Nature 331, 184–186. ( 10.1038/331184a0) [DOI] [PubMed] [Google Scholar]
- 23.Guy L, Ettema TJ. 2011. The archaeal ‘TACK’ superphylum and the origin of eukaryotes. Trends Microbiol. 19, 580–587. ( 10.1016/j.tim.2011.09.002) [DOI] [PubMed] [Google Scholar]
- 24.Spang A, et al. 2015. Complex Archaea that bridge the gap between prokaryotes and eukaryotes. Nature 521, 173–179. ( 10.1038/nature14447) [DOI] [PMC free article] [PubMed] [Google Scholar]
- 25.Von Dohlen CD, Kohler S, Alsop ST, McManus WR. 2001. Mealybug β-proteobacterial endosymbionts contain γ-proteobacterial symbionts. Nature 412, 433–436. ( 10.1038/35086563) [DOI] [PubMed] [Google Scholar]
- 26.De Duve C. 2005. Singularities: landmarks on the pathways of life. Cambridge, UK: Cambridge University Press. [Google Scholar]
- 27.Yutin N, Wolf MY, Wolf YI, Koonin EV. 2009. The origins of phagocytosis and eukaryogenesis. Biol. Direct 4, 21 ( 10.1186/1745-6150-4-21) [DOI] [PMC free article] [PubMed] [Google Scholar]
- 28.Bernander R, Lind AE, Ettema TJ. 2011. An archaeal origin for the actin cytoskeleton: implications for eukaryogenesis. Commun. Integr. Biol. 4, 664–667. ( 10.4161/cib.16974) [DOI] [PMC free article] [PubMed] [Google Scholar]
- 29.Ettema TJ, Lindås AC, Bernander R. 2011. An actin-based cytoskeleton in Archaea. Mol. Microbiol. 80, 1052–1061. ( 10.1111/j.1365-2958.2011.07635.x) [DOI] [PubMed] [Google Scholar]
- 30.Doolittle WF. 1998. You are what you eat: a gene transfer ratchet could account for bacterial genes in eukaryotic nuclear genomes. Trends Genet. 14, 307–311. ( 10.1016/S0168-9525(98)01494-2) [DOI] [PubMed] [Google Scholar]
- 31.Wächtershäuser G. 2003. From pre-cells to Eukarya–a tale of two lipids. Mol. Microbiol. 47, 13–22. ( 10.1046/j.1365-2958.2003.03267.x) [DOI] [PubMed] [Google Scholar]
- 32.Shimada H, Yamagishi A. 2011. Stability of heterochiral hybrid membrane made of bacterial sn-G3P lipids and archaeal sn-G1P lipids. Biochemistry 50, 4114–4120. ( 10.1021/bi200172d) [DOI] [PubMed] [Google Scholar]
- 33.Muller F, Brissac T, Le Bris N, Felbeck H, Gros O. 2010. First description of giant Archaea (Thaumarchaeota) associated with putative bacterial ectosymbionts in a sulfidic marine habitat. Environ. Microbiol. 12, 2371–2383. ( 10.1111/j.1462-2920.2010.02309.x) [DOI] [PubMed] [Google Scholar]
- 34.Naor A, Lapierre P, Mevarech M, Papke RT, Gophna U. 2012. Low species barriers in halophilic Archaea and the formation of recombinant hybrids. Curr. Biol. 22, 1444–1448. ( 10.1016/j.cub.2012.05.056) [DOI] [PubMed] [Google Scholar]
- 35.Naor A, Gophna U. 2013. Cell fusion and hybrids in Archaea: prospects for genome shuffling and accelerated strain development for biotechnology. Bioengineered 4, 126–129. ( 10.4161/bioe.22649) [DOI] [PMC free article] [PubMed] [Google Scholar]
- 36.Nelson-Sathi S, Dagan T, Landan G, Janssen A, Steel M, McInerney JO, Deppenmeier U, Martin WF. 2012. Acquisition of 1,000 eubacterial genes physiologically transformed a methanogen at the origin of Haloarchaea. Proc. Natl Acad. Sci. USA 109, 20 537–20 542. ( 10.1073/pnas.1209119109) [DOI] [PMC free article] [PubMed] [Google Scholar]
- 37.Nelson-Sathi S, et al. 2014. Origins of major archaeal clades correspond to gene acquisitions from bacteria. Nature 517, 77–80. ( 10.1038/nature13805) [DOI] [PMC free article] [PubMed] [Google Scholar]
- 38.Esser C, Martin W, Dagan T. 2007. The origin of mitochondria in light of a fluid prokaryotic chromosome model. Biol. Lett. 3, 180–184. ( 10.1098/rsbl.2006.0582) [DOI] [PMC free article] [PubMed] [Google Scholar]
- 39.Ku C, Nelson-Sathi S, Roettger M, Garg S, Hazkani-Covo E, Martin WF. 2015. Endosymbiotic gene transfer from prokaryotic pangenomes: inherited chimerism in eukaryotes. Proc. Natl Acad. Sci. USA 280, 201421385 ( 10.1073/pnas.1421385112) [DOI] [PMC free article] [PubMed] [Google Scholar]
- 40.Margush T, McMorris FR. 1981. Consensus n-trees. Bull. Math. Biol. 43, 239–244. ( 10.1016/s0092-8240(81)90019-7) [DOI] [Google Scholar]
- 41.Semple C, Steel M. 2000. A supertree method for rooted trees. Discrete Appl. Math. 105, 147–158. ( 10.1016/S0166-218X(00)00202-X) [DOI] [Google Scholar]
- 42.Rodrigo AG. 1993. A comment on Baum's method for combining phylogenetic trees. Taxon 42, 631–636. ( 10.2307/1222540) [DOI] [Google Scholar]
- 43.Purvis A. 1995. A modification to Baum and Ragan's method for combining phylogenetic trees. Syst. Biol. 44, 251–255. ( 10.1093/sysbio/44.2.251) [DOI] [Google Scholar]
- 44.Wilkinson M, Thorley JL, Littlewood D, Bray RA. 2001. Towards a phylogenetic supertree of Platyhelminthes. Interrelationships Platyhelminthes 60, 292–310. [Google Scholar]
- 45.Wilkinson M, Pisani D, Cotton JA, Corfe I. 2005. Measuring support and finding unsupported relationships in supertrees. Syst. Biol. 54, 823–831. ( 10.1080/10635150590950362) [DOI] [PubMed] [Google Scholar]
- 46.Wilkinson M, et al. 2005. The shape of supertrees to come: tree shape related properties of fourteen supertree methods. Syst. Biol. 54, 419–431. ( 10.1080/10635150590949832) [DOI] [PubMed] [Google Scholar]
- 47.Akanni WA, Wilkinson M, Creevey CJ, Foster PG, Pisani D. 2015. Implementing and testing Bayesian and maximum likelihood supertree methods in phylogenetics. R. Soc. open sci. 2, 140436 ( 10.1098/rsos.140436) [DOI] [PMC free article] [PubMed] [Google Scholar]
- 48.Steel M, Rodrigo A. 2008. Maximum likelihood supertrees. Syst. Biol. 57, 243–250. ( 10.1080/10635150802033014) [DOI] [PubMed] [Google Scholar]
- 49.Bryant D, Steel M. 2009. Computing the distribution of a tree metric. IEEE/ACM Trans. Comput. Biol. Bioinform. 6, 420–426. ( 10.1109/TCBB.2009.32) [DOI] [PubMed] [Google Scholar]
- 50.Foster PG. 2004. Modeling compositional heterogeneity. Syst. Biol. 53, 485–495. ( 10.1080/10635150490445779) [DOI] [PubMed] [Google Scholar]
- 51.Wolf YI, Rogozin IB, Grishin NV, Koonin EV. 2002. Genome trees and the tree of life. Trends Genet. 18, 472–479. ( 10.1016/S0168-9525(02)02744-0) [DOI] [PubMed] [Google Scholar]
- 52.Ciccarelli FD, Doerks T, Von Mering C, Creevey CJ, Snel B, Bork P. 2006. Toward automatic reconstruction of a highly resolved tree of life. Science 311, 1283–1287. ( 10.1126/science.1123061) [DOI] [PubMed] [Google Scholar]
- 53.Brochier-Armanet C, Boussau B, Gribaldo S, Forterre P. 2008. Mesophilic Crenarchaeota: proposal for a third archaeal phylum, the Thaumarchaeota. Nat. Rev. Microbiol. 6, 245–252. ( 10.1038/nrmicro1852) [DOI] [PubMed] [Google Scholar]
- 54.Brochier-Armanet C, Forterre P, Gribaldo S. 2011. Phylogeny and evolution of the Archaea: one hundred genomes later. Curr. Opin. Microbiol. 14, 274–281. ( 10.1016/j.mib.2011.04.015) [DOI] [PubMed] [Google Scholar]
- 55.Rochette NC, Brochier-Armanet C, Gouy M. 2014. Phylogenomic test of the hypotheses for the evolutionary origin of eukaryotes. Mol. Biol. Evol. 32, 832–845. ( 10.1093/molbev/mst272) [DOI] [PMC free article] [PubMed] [Google Scholar]
- 56.Altschul SF, Gish W, Miller W, Myers EW, Lipman DJ. 1990. Basic local alignment search tool. J. Mol. Biol. 215, 403–410. ( 10.1016/S0022-2836(05)80360-2) [DOI] [PubMed] [Google Scholar]
- 57.Haggerty LS, et al. 2014. A pluralistic account of homology: adapting the models to the data. Mol. Biol. Evol. 31, 501–516. ( 10.1093/molbev/mst228) [DOI] [PMC free article] [PubMed] [Google Scholar]
- 58.Dongen SV.2000. Graph clustering by flow simulation. PhD thesis, University of Utrecht, The Netherlands.
- 59.Creevey CJ, Fitzpatrick DA, Philip GK, Kinsella RJ, O'Connell MJ, Pentony MM, Travers SA, Wilkinson M, McInerney JO. 2004. Does a tree-like phylogeny only exist at the tips in the prokaryotes? Proc. R. Soc. Lond. B 271, 2551–2558. ( 10.1098/rspb.2004.2864) [DOI] [PMC free article] [PubMed] [Google Scholar]
- 60.Löytynoja A, Goldman N. 2008. Phylogeny-aware gap placement prevents errors in sequence alignment and evolutionary analysis. Science 320, 1632–1635. ( 10.1126/science.1158395) [DOI] [PubMed] [Google Scholar]
- 61.Castresana J. 2000. Selection of conserved blocks from multiple alignments for their use in phylogenetic analysis. Mol. Biol. Evol. 17, 540–552. ( 10.1093/oxfordjournals.molbev.a026334) [DOI] [PubMed] [Google Scholar]
- 62.Archie JW. 1989. A randomization test for phylogenetic information in systematic data. Syst. Biol. 38, 239–252. ( 10.2307/2992285) [DOI] [Google Scholar]
- 63.Faith DP, Cranston PS. 1991. Could a cladogram this short have arisen by chance alone? On permutation tests for cladistic structure. Cladistics 7, 1–28. ( 10.1111/j.1096-0031.1991.tb00020.x) [DOI] [Google Scholar]
- 64.Swofford D. 2003. PAUP*: phylogenetic analysis using parsimony, v. 4.0 b10 See http://paup.csit.fsu.edu/.
- 65.Stamatakis A. 2006. RAxML-VI-HPC: maximum likelihood-based phylogenetic analyses with thousands of taxa and mixed models. Bioinformatics 22, 2688–2690. ( 10.1093/bioinformatics/btl446) [DOI] [PubMed] [Google Scholar]
- 66.Lartillot N, Philippe H. 2004. A Bayesian mixture model for across-site heterogeneities in the amino-acid replacement process. Mol. Biol. Evol. 21, 1095–1109. ( 10.1093/molbev/msh112) [DOI] [PubMed] [Google Scholar]
- 67.Siu-Ting K, Pisani D, Creevey CJ, Wilkinson M. 2015. Concatabominations: identifying unstable taxa in morphological phylogenetics using a heuristic extension to safe taxonomic reduction. Syst. Biol. 64, 137–143. ( 10.1093/sysbio/syu066) [DOI] [PMC free article] [PubMed] [Google Scholar]
- 68.Akanni WA, Creevey CJ, Wilkinson M, Pisani D. 2014. LU St: a tool for approximated maximum likelihood supertree reconstruction. BMC Bioinform. 15, 183 ( 10.1186/1471-2105-15-183) [DOI] [PMC free article] [PubMed] [Google Scholar]
- 69.Shimodaira H. 2002. An approximately unbiased test of phylogenetic tree selection. Syst. Biol. 51, 492–508. ( 10.1080/10635150290069913) [DOI] [PubMed] [Google Scholar]
- 70.Shimodaira H, Hasegawa M. 2001. CONSEL: for assessing the confidence of phylogenetic tree selection. Bioinformatics 17, 1246–1247. ( 10.1093/bioinformatics/17.12.1246) [DOI] [PubMed] [Google Scholar]
- 71.Shapiro SS, Wilk MB. 1965. An analysis of variance test for normality (complete samples). Biometrika 52, 591–611. ( 10.1093/biomet/52.3-4.591) [DOI] [Google Scholar]
- 72.Lloyd GT, et al. 2008. Dinosaurs and the Cretaceous terrestrial revolution. Proc. R. Soc. B 275, 2483–2490. ( 10.1098/rspb.2008.0715) [DOI] [PMC free article] [PubMed] [Google Scholar]
- 73.Wilkinson M, McInerney JO, Hirt RP, Foster PG, Embley TM. 2007. Of clades and clans: terms for phylogenetic relationships in unrooted trees. Trends Ecol. Evol. 22, 114–115. ( 10.1016/j.tree.2007.01.002) [DOI] [PubMed] [Google Scholar]
- 74.Timmis JN, Ayliffe MA, Huang CY, Martin W. 2004. Endosymbiotic gene transfer: organelle genomes forge eukaryotic chromosomes. Nat. Rev. Genet. 5, 123–135. ( 10.1038/nrg1271) [DOI] [PubMed] [Google Scholar]
- 75.Gil R, et al. 2003. The genome sequence of Blochmannia floridanus: comparative analysis of reduced genomes. Proc. Natl Acad. Sci. USA 100, 9388–9393. ( 10.1073/pnas.1533499100) [DOI] [PMC free article] [PubMed] [Google Scholar]
- 76.Embley TM, Martin W. 2006. Eukaryotic evolution, changes and challenges. Nature 440, 623–630. ( 10.1038/nature04546) [DOI] [PubMed] [Google Scholar]
- 77.Dagan T, Martin W. 2006. The tree of one percent. Genome Biol. 7, 118 ( 10.1186/gb-2006-7-10-118) [DOI] [PMC free article] [PubMed] [Google Scholar]
- 78.Puigbò P, Wolf YI, Koonin EV. 2010. The tree and net components of prokaryote evolution. Genome Biol. Evol. 2, 745–756. ( 10.1093/gbe/evq062) [DOI] [PMC free article] [PubMed] [Google Scholar]
- 79.Woese CR, Fox GE. 1977. Phylogenetic structure of the prokaryotic domain: the primary kingdoms. Proc. Natl Acad. Sci. USA 74, 5088–5090. ( 10.1073/pnas.74.11.5088) [DOI] [PMC free article] [PubMed] [Google Scholar]
- 80.Pace NR, Stahl DA, Lane DJ, Olsen GJ. 1986. The analysis of natural microbial populations by ribosomal RNA sequences. In Advances in microbial ecology (ed. Marshall KC.), pp. 1–55. New York, NY: Springer. [Google Scholar]
Associated Data
This section collects any data citations, data availability statements, or supplementary materials included in this article.
Supplementary Materials
Data Availability Statement
All data have been deposited into the Dryad dataset: http://dx.doi.org/10.5061/dryad.2r732.