

Abstract
Introduction. A family history of Alzheimer's disease is a significant risk factor for its onset, but the genetic risk associated with possessing multiple risk alleles is still poorly understood. Methods. In a sample of 95 older adults (Mean age = 75.1, 64.2% female), we constructed a genetic risk score based on the accumulation of risk alleles in BDNF, COMT, and APOE. A neuropsychological evaluation and consensus determined cognitive status (44 nonimpaired, 51 impaired). Logistic regression was performed to determine whether the genetic risk score predicted cognitive impairment above and beyond that associated with each gene. Results. An increased genetic risk score was associated with a nearly 4-fold increased risk of cognitive impairment (OR = 3.824, P = .013) when including the individual gene polymorphisms as covariates in the model. Discussion. A risk score combining multiple genetic influences may be more useful in predicting late-life cognitive impairment than individual polymorphisms.
1. Introduction
A family history of late-life cognitive impairment is a well-recognized risk factor for the development of Alzheimer's disease (AD) and its preclinical stage of Mild Cognitive Impairment [1] (MCI). Twin studies report the heritability of AD to be between 58 and 79% [2], prompting a persistent search for genetic variants that influence susceptibility for AD and cognitive decline. The primary genetic risk factor for late-onset AD (LOAD) is widely considered to be the ε4 allele of the apolipoprotein E (APOE) gene, which has been consistently identified by genome-wide association studies (GWAS) of AD [3]. In the brain, apolipoprotein E serves a vital function in neuronal activity by regulating cholesterol metabolism [4]. Approximately 40% of all Caucasian adults who develop AD possess at least one ε4 allele [5], and ε4 carriers exhibit more precipitous cognitive decline [6, 7].
In addition to APOE, other genetic variants have been identified as risk factors for cognitive decline because they influence biological pathways involved in memory and executive function, which exhibit the earliest deficits during the progression of AD [8]. For example, the BDNF gene codes for brain-derived neurotrophic factor, a protein secreted by neurons that promotes neurogenesis and synaptic plasticity and transmission in the central nervous system; BDNF is particularly critical for learning and memory processes because it facilitates long-term potentiation in hippocampal neurons [9]. AD has been associated with decreased BDNF levels in the temporal and parietal cortices [10]. BDNF also circulates and can be measured in the periphery. Decreased levels of serum BDNF have been associated with AD [11]. Age-related reductions in serum BDNF levels have also been related to smaller hippocampal volume and poorer memory function even in healthy older adults [12]. In the human BDNF gene, variation in the protein's function has been attributed to a single nucleotide polymorphism (SNP, rs6265, Val66Met) resulting in a valine (Val) to methionine (Met) substitution at codon 66. The Met-substituted product is associated with impaired intracellular trafficking and secretion of BDNF, poorer performance in declarative memory [13] and executive function [14], and reduced hippocampal volume and function [13–16]. Despite these convincing links with AD, weak association between this SNP and AD has been identified by GWAS [17] and candidate gene studies yield inconsistent results regarding whether the Met allele confers an increased risk of AD [18, 19], suggesting a need for further investigation of its role as a contributing, but not sole, risk factor.
In addition to APOE and BDNF, the catechol-o-methyltransferase (COMT) gene codes for an enzyme responsible for catalysis and inactivation of catecholamine neurotransmitters such as dopamine, norepinephrine, and epinephrine [20]. A common SNP of COMT (rs4680, Val158Met) involves a substitution of Val by Met at codon 158, the product of which is four times less metabolically active than the homozygous Val allele product [21]. Slower enzymatic activity of COMT delays inactivation of dopamine in the synaptic cleft in the prefrontal cortex, resulting in enhanced executive function for Met carriers relative to Val homozygotes [22]. Although association between the COMT polymorphism and AD has not been confirmed by GWAS or meta-analysis [23], studies have demonstrated that throughout adulthood the Val allele is associated with characteristics of cognitive decline and dementia such as poorer performance on tasks of executive functioning and working memory [24], declarative memory [25], and slower processing speed [26]. As in the case of BDNF Val66Met, the COMT Val158Met SNP is likely an under-recognized contributing genetic risk factor in the development of AD.
These and other genetic polymorphisms likely contribute relatively small independent effects to collectively predispose one to develop a complex disease such as AD. Studies have begun to investigate how multiple genetic influences can be aggregated into a single risk profile to predict the prevalence or course of a given pathology, either by summing the total number of risk alleles possessed or by obtaining a weighted sum including each risk allele multiplied by its associated effect size. Rodríguez-Rodríguez et al. [27] constructed a genetic risk score to predict progression from MCI to AD that combined genotype information across 8 non-APOE genetic variants (16 total alleles) identified by GWAS of AD risk, with each allele weighted by its AD risk odds ratio. Although the weighted genetic risk score was not significant, the authors found that subjects who possessed a total of six or more risk alleles progressed from MCI to AD twice as quickly as those who possessed fewer than six risk alleles. While the accumulation of risk alleles was a significant predictor for rate of progression to AD (OR = 1.89, P < .047, and 95% C.I. = 1.01, 3.56), each individual genetic polymorphism did not have significant predictive power by itself, with the exception of one marginally significant gene (CD2AP, OR = 1.69, P < .051). Similar risk scores have been employed to predict other pathologies such as age-related macular degeneration, multiple sclerosis, and type II diabetes [28–30]. These studies indicate that incorporating multiple SNPs pertinent to a given phenotype into a genetic risk score is more useful in predicting the prevalence or progression of a disease than considering polymorphisms individually.
In this genetic risk score study, we took a candidate gene approach by targeting genetic variants that have either been identified as having a clear link with risk for AD (i.e., APOE) or that have an important role in cognitive and brain functions in late adulthood and have a relatively common minor allele frequency (i.e., BDNF, COMT) but may have been previously undetected by GWAS due to small individual effect sizes. To test whether the combination of these three risk genotypes was collectively predictive of late-life cognitive impairment, we created a cumulative genetic risk score by summing the possession or absence of each SNP's risk allele. We predicted that a higher genetic risk score would correspond to an increased risk of cognitive impairment above and beyond that of the individual gene polymorphisms.
2. Methods
2.1. Participants
Data for this study were collected as part of a larger study examining the utility of providing cognitive testing of older adults in primary care physician (PCP) offices [31, 32]. Participants included 109 adults who were consented into the parent study. The parent study recruited participants from eleven PCP practices in the greater Pittsburgh and surrounding areas. Participants were eligible to participate if they were 65 years or older, had no medical chart diagnosis of dementia, had no acute illness, and were not residing in a nursing home. They were excluded if initial screening revealed the presence of sensory deficits that would preclude computerized and paper and pencil neuropsychological testing. Additionally, they were excluded if initial screening revealed the presence of dementia as indicated by a score of ≤18 on the Mini-Mental State Examination [33].
One participant was removed due to incorrectly recorded cognitive data. Since distributions of allelic frequencies differ between races, 4 African American participants were removed from the analysis to minimize confounding by genetic admixture. Age, gender, and years of education were self-reported. All participants signed a consent form approved by the University of Pittsburgh Institutional Review Board and were remunerated $20 for participation.
2.2. Cognitive Assessment and Group Classification
Each participant completed a comprehensive neuropsychological test battery assessing five primary cognitive domains: memory, executive function, spatial ability, language, and attention/psychomotor speed. Measures of memory were the Consortium to Establish a Registry for Alzheimer's Disease (CERAD) Word List Learning Test with delayed recall [34], the Wechsler Memory Scale-Revised Logical Memory I and II [35], and the modified Rey-Osterrieth figure for immediate and delayed recall [36]. Tests of executive function were the Wechsler Adult Intelligence Scale-Revised (WAIS-R) Backward Digit Span [37], the controlled oral word association test (FAS) [38], Part B of the Trail-Making Test [39], the WAIS-R Digit Symbol [37], and the Clock Drawing Test [38]. Tests of spatial ability were the modified Rey-Osterrieth Copy [36] and the modified WAIS-R Block Design [37]. Language tests consisted of the Boston Naming Test [40] and semantic fluency (animals) [38]. Tests of attention/psychomotor speed were the WAIS-R Digit Span Forward [37] and Part A of the Trail-Making Test [39]. Participants were also administered the Center for Epidemiologic Studies Depression (CES-D) Scale[41] for assessment of depression symptomatology, the Activities of Daily Living (ADL) Scale [42], and the Instrumental Activities of Daily Living (IADL) Scale [43].
A clinical adjudication panel of three expert neuropsychologists (all licensed psychologists) determined cognitive status: normal, mild cognitive impairment (MCI), or dementia. Classifications were done according to the criteria from the University of Pittsburgh Alzheimer's Disease Research Center [44, 45]. Dementia range = scores ≥ 2SD below age norms on two cognitive domains, one of which must be memory; MCI range = at least two scores 1-2SD below age norms; normal cognition = individuals not included in ranges for either dementia or MCI. The final diagnosis took into account the cognitive test scores as well as demographic, functional, behavioral, and medical information. Adjudications were conducted blind to study group status of the parent study. Final cognitive status categories consisted of cognitively nonimpaired (n = 44), Mild Cognitive Impairment (MCI, n = 47), or dementia (n = 4). Because of the low number of individuals with dementia, those with either Mild Cognitive Impairment or dementia were combined into a single group labeled “cognitive impairment” (n = 51).
2.3. Genotype Collection, Coding, and Risk Score Computation
Genomic DNA was collected with the Oragene-DNA Self-Collection Kit OG-500 (DNA Genotek Inc., Ontario, Canada). Extraction and purification of DNA were completed using the laboratory protocol from Oragene-DNA. DNA was diluted with TE buffer to 10 ng/μL and stored at −20°C.
Participants were genotyped for rs6265 (Val66Met) in BDNF, rs4680 (Val158Met) in COMT, and rs429358/rs7412 in APOE (ApoE2, ApoE3, and ApoE4). Genotype analysis was performed by high-resolution melting (HRM) analysis. Each polymerase chain reaction (PCR) was performed on a CFX96 real-time PCR system (Bio-Rad, Hercules, CA) using 1x Precision Melt Supermix (Bio-Rad, Hercules, CA). The reaction volume was 20 μL and contained 50 ng of genomic DNA. See Table 1 for primer sequence, primer concentration, amplicon length, and melt range. The running conditions for BDNF were 1 cycle of 95°C for 2 min and 65 cycles of 95°C for 10 s, and 56.6°C for 30 sec. The running conditions for COMT were 1 cycle of 95°C for 2 min and 65 cycles of 95°C for 10 s, and 60.1°C for 30 sec. The conditions for APOE were 1 cycle of 95°C for 2 min and 60 cycles of 95°C for 10 s, 63.8°C for 30 s, and 72°C for 30 sec. The melting range varied per SNP (see Table 1) but all began with a heteroduplex formation of 95°C for 30 seconds and 60°C for 1 min. The temperature increment for melting analysis for all three genotypes was 0.2°C per 10 sec. The melting curve was analyzed using Bio-Rad Precision Melt Analysis 1.2 software. Negative and positive controls were included on each run to ensure genotyping accuracy. Greater than 50% of samples were run in duplicate.
Table 1.
Genotypes of BDNF, COMT, and APOE SNPs.
| SNP | Primer sequence | Primer concentration | Amplicon length | Melt range (°C) |
|---|---|---|---|---|
| BDNF rs6265 | FW 5′-GCTTGACATCATTGGCTGAC-3′ | 375 nM | 129 | 70.0–92.0 |
| RV 5′-TACTGAGCATCACCCTGGAC-3′ | ||||
|
| ||||
| COMT rs4680 | FW 5′-TCATCACCATCGAGATCAACC-3′ | 300 nM | 112 | 70.0–91.0 |
| RV 5′-TTTTTCCAGGTCTGACAACG-3′ | ||||
|
| ||||
| APOE rs429358/rs7412 | FW 5′-GGCACGGCTGTCCAAGGA-3′ | 200 nM | 228 | 80.0–98.0 |
| RV 5′-GCCCCGGCCTGGTACAC-3′ | ||||
For the individual genotype analyses, BDNF genotype groups consisted of Val homozygotes, Val heterozygotes, and Met homozygotes; COMT genotype groups similarly consisted of Val homozygotes, Val heterozygotes, or Met homozygotes; APOE genotype groups included ε2/ε3, ε2/ε4, ε3/ε3, ε3/ε4, or ε4/ε4. See Table 2 for genotype frequencies.
Table 2.
Frequencies of BDNF, COMT, and APOE genotypes and risk allele carriers.
| Gene | Genotype | n | Risk allele carrier status | n |
|---|---|---|---|---|
| BDNF | Val/Val | 61 | Met carriers (risk score value = 1) | 34 |
| Val/Met | 33 | Val homozygotes (risk score value = 0) | 61 | |
| Met/Met | 1 | |||
|
| ||||
| COMT | Val/Val | 23 | Val carriers (risk score value = 1) | 63 |
| Val/Met | 40 | Met homozygotes (risk score value = 0) | 32 | |
| Met/Met | 32 | |||
|
| ||||
| APOE | ε2/ε3 | 12 | ε4 carriers (risk score value = 1) | 22 |
| ε2/ε4 | 1 | Non-ε4 carriers (risk score value = 0) | 73 | |
| ε3/ε3 | 61 | |||
| ε3/ε4 | 18 | |||
| ε4/ε4 | 3 | |||
The genetic risk score was then computed for each participant by summing the presence or the absence of risk genotypes. That is, each genotype was assigned either “0” for minimally associated genetic risk with cognitive deficits or “1” for a putative association with cognitive deficits. This scoring criterion was based on the literature for each of the three polymorphisms. For APOE, the ε4 allele is widely considered to be a risk allele for cognitive deficits and decline; so its possession warranted “1” towards the risk score and its absence “0”. For BDNF, the Met allele is associated with decreased cognitive function; so possession of a Met allele resulted in “1” and its absence “0”. For COMT, the Val allele is considered to be most strongly associated with cognitive deficits, conferring “1” for its possession and “0” in its absence.
In effect, the risk score combines BDNF Met carriers into one group to be compared with Val homozygotes due to our interest in possession of the Met allele at either locus. In a similar fashion, homozygous and heterozygous COMT Val carriers were grouped and compared with Met homozygotes. Following convention established by the APOE literature, ε4 allele carriers were grouped and compared with all non-ε4 carriers. See Table 2 for risk genotype frequencies for each gene.
The sum of these three component risk genotypes for all three polymorphisms yielded a risk score with a scale of genetic risk values between 0 and 3. An overall risk score value of “0” translates into the absence of any risk genotypes and represents the lowest genetic risk category for decline in cognitive status; “1” represents possession of only one risk genotype, “2” represents possession of two risk genotypes, and “3” represents possession of all 3 risk genotypes and is proposed to represent the highest genetic risk category for decline in cognitive status.
2.4. Statistics
First, in order to determine whether any of the three genotypes were individually predictive of cognitive status, hierarchal logistic regression analyses were performed (SPSS Version 22). The demographic variables, consisting of age, gender, and years of education, comprised the 1st block while BDNF, COMT, and APOE genotype were each entered as the 2nd block in separate regression models. In these analyses, the BDNF genotype was coded as “1” for Val/Val, “2” for Val/Met, or “3” for Met/Met. In a similar fashion, the COMT genotype was coded as “1” for Val/Val, “2” for Val/Met, or “3” for Met/Met. Based on the literature, the independent effect of APOE genotype on cognitive status was determined by assigning “1” for non-ε4 carriers and “2” for the possession of at least one ε4 allele; for subsequent risk score analyses, the APOE genotype variable reflects all possible genotypes, coded as “23” for ε2/ε3, “24” for ε2/ε4, “33” for ε3/ε3, “34” for ε3/ε4, and “44” for ε4/ε4. These genotype variables were subsequently used as the individual genotype covariates in the genetic risk score analyses.
Hierarchal logistic regression was then performed to determine whether the composite genetic risk score variable (entered as the 3rd block) predicted cognitive status (nonimpaired versus impaired) above and beyond the individual genotypes (all three comprising the 2nd block) and the demographic variables (the 1st block). We report odds ratios (OR) and confidence intervals (C.I.) resulting from these analyses and report P values below 0.05.
3. Results
3.1. Demographics and Covariates
Nine participants were excluded (7 were missing genotype information for all three genes while an additional 2 were missing APOE genotype, resulting in an overall failure rate of 7.37% and error rate of 0%). Our final sample size of n = 95 was 64.2% female with a mean age of 75.1 years. Allelic frequencies did not significantly differ from Hardy-Weinberg equilibrium for any of the three genes. Table 3 shows demographic information and MMSE scores for the overall sample as well as between the nonimpaired and impaired participants. Cognitive status (the presence or absence of impairment) was significantly associated with age (OR = 1.113, P = .025, and 95% C.I. = 1.014, 1.222) and years of education (OR = .861, P = .038, and 95% C.I. = .748, .992) such that higher age and fewer years of education were associated with a higher risk of impairment. Gender was not significantly associated with an increased risk of impairment (OR = .537, P = .177, and 95% C.I. = .217, 1.324), but there were a higher proportion of men in the cognitively impaired group and there is evidence of sexual dimorphism of both BDNF and APOE on risk for AD [46, 47]. Therefore, we included age, gender, and years of education as covariates in all analyses to isolate the effects of BDNF, COMT, and APOE genotype or the genetic risk score on cognitive status. See Table 3.
Table 3.
Participant demographics.
| Characteristic | All participants (n = 95) |
Nonimpaired (n = 44) |
Impaired (n = 51) |
|---|---|---|---|
| Age (mean years [SD]) | 75.1 (5) | 73.9 (4.2) | 76.1 (5.4) |
| Completed education (mean years [SD]) | 14.4 (3.2) | 15.1 (2.9) | 13.8 (3.3) |
| Gender (% female) | 64.2 | 70.5 | 58.8 |
| MMSE (mean [SD]) | 28.1 (2.1) | 28.9 (1.2) | 27.5 (2.4) |
3.2. Association between Individual SNPs and Risk for Cognitive Impairment
Consistent with the literature, APOEε4 carrier status was significantly predictive of an increased risk of cognitive impairment (OR = 3.561, P = .032, and 95% C.I. = 1.116, 11.365) after controlling variation from age, gender, and education. Neither BDNF nor COMT genotype was related to cognitive status (BDNF, OR = 1.149, P = .755, and 95% C.I. = .479, 2.759; COMT, OR = 1.074, P = .808, and 95% C.I. = .606, 1.903).
3.3. Association between Genetic Risk Score and Risk for Cognitive Impairment
Table 4 shows the frequencies for each genetic risk score value. Each additional point towards the genetic risk score was significantly associated with a nearly 4-fold increased risk of cognitive impairment (OR = 3.824, P = .013, and 95% C.I. = 1.333, 10.973) even after including all of the individual gene polymorphisms in the model (see Table 5). Consistent with our hypothesis, a higher genetic risk score representing an increasing number of risk genotypes was predictive of an increased risk of cognitive impairment above and beyond the variation attributable to individual polymorphisms. Figure 1 shows the distribution of risk scores between cognitive status categories.
Table 4.
Genetic risk score frequencies.
| Risk score value | n |
|---|---|
| 0 | 16 |
| 1 | 46 |
| 2 | 26 |
| 3 | 7 |
| Total | 95 |
Table 5.
Results of genetic risk score controlling individual genotypes.
| Variable | OR | p value | 95% C.I. |
|---|---|---|---|
| BDNF | 0.369 | 0.145 | 0.096–1.410 |
| COMT | 2.147 | 0.061 | 0.966–4.773 |
| APOE | 0.9 | 0.093 | 0.796–1.018 |
| Risk score | 3.824 | 0.013 | 1.333–10.973 |
Figure 1.
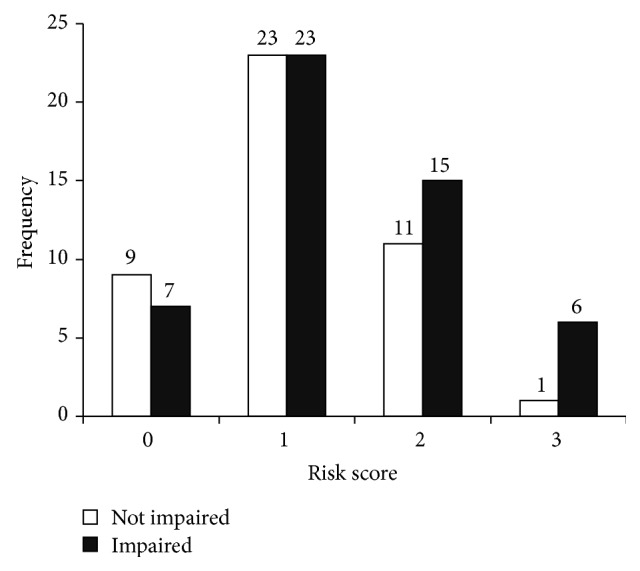
Risk score frequencies between cognitive status categories.
Follow-up analyses were performed to determine whether the 4 individuals with dementia were driving the association between the genetic risk score and cognitive impairment. After removing the 4 individuals with dementia from the analysis, the risk score remained significant (OR = 3.138, P = .039, and 95% C.I. = 1.059, 9.302) while the individual genotypes remained nonsignificant in the full model, with the exception of COMT which reached nominal significance (BDNF, OR = .446, P = .248, and 95% C.I. = .113, 1.755; COMT, OR = 1.977, P = .095, and 95% C.I. = .889, 4.396; APOE, OR = .899, P = .105, and 95% C.I. = .790, 1.022).
4. Discussion
We created a genetic risk score to represent the accumulation of risk genotypes of polymorphisms in BDNF, COMT, and APOE to test whether the risk score predicted the presence of late-life cognitive impairment above and beyond that of each individual gene polymorphism. Consistent with our predictions, a higher genetic risk score significantly predicted a higher risk of having cognitive impairment (OR = 3.824, P = .013, and 95% C.I. = 1.333, 10.973) when controlling individual polymorphisms in BDNF, COMT, and APOE (see Tables 4 and 5). Congruent with the literature, BDNF and COMT genotype were not independently predictive of cognitive status, whereas APOE ε4 carrier status was predictive of cognitive status (OR = 3.561, P = .032, and 95% C.I. = 1.116, 11.365). These results demonstrate that the aggregation of multiple risk genotypes into one total risk score predicted the presence or absence of impairment to a higher degree than any of the individual polymorphisms.
The genes under consideration for this study were chosen due to their involvement in general neural function (APOE) as well as in processes known to present the earliest deficits in AD such as learning, memory, and executive function (BDNF and COMT). Polymorphisms in these genes (BDNF, rs6265; COMT, rs4680; and APOE, rs429358/rs7412) have been associated with differential protein function, with possession of each SNP's risk allele (Met, Val, and ε4, resp.) associated with poorer cognitive performance. Our findings support the use of a single genetic risk score to represent the accumulation of genetic influences affecting multiple domains of cognition and brain health in relation to AD, which may be more important in determining cognitive decline than testing individual genotypes. When considered individually, these same genetic polymorphisms contribute small or negligible effects and remain largely undetected by previous GWAs (except APOE) but may still represent influential aspects of AD pathology. These results beg the question of the importance of other risk genotypes not assessed here that could also contribute to risk of AD. Additionally, our results complement previous reports of significant interaction between COMT Val158Met and APOEε4 on risk for AD [48], additive effects of BDNF Val66Met and APOEε4 on hippocampal activity in healthy older adults [49], and interaction between BDNF Val66Met and APOEε4 on episodic memory in cognitively healthy older adults [50].
Our study represented a unique population of older adults who underwent a comprehensive cognitive assessment and diagnosis. However, one limitation is the relatively small sample size of our study (n = 95). In genetic association studies, hundreds of subjects are genotyped in order to achieve sufficient power to reliably test specific genetic interactions or confirm epistatic effects between genes. However, we still detected an association between higher risk scores and increased odds of being cognitively impaired (Figure 1). Future studies will need to expand these results to larger samples with a higher proportion of cognitively impaired individuals. This will help verify the associations to more clearly examine potential interactions between these gene polymorphisms as well as assess effect sizes and dose-dependent effects of possessing one, both, or no risk allele(s) for each gene considered. The genetic risk score reported here was unable to account for and examine the effects of possessing either one or both risk alleles for each gene without further reducing the number of participants in each risk score category and diminishing the statistical power and interpretation of the results. Finally, an additional limitation of the current study is that we included only individuals of European descent to avoid confounding by population admixture. Future studies should recruit from various racial and ethnic backgrounds to determine whether the genetic and phenotypic trends observed here are present in other races and ethnicities while adequately accounting for population stratification.
In summary, we found that a cumulative genetic risk score across three genes related to cognition, brain function, and risk for dementia (BDNF, COMT, and APOE) significantly predicted late-life cognitive impairment. The risk score was significant above and beyond the effects of each individual genotype. Our findings demonstrate the effectiveness of genetic risk scores and their potential utility as predictors of more genetic variation in cognitive outcomes such as AD than polymorphisms considered individually.
Acknowledgment
This study was supported by grants from the National Institutes of Health (R01 DK095172 and R01 AG023129).
Conflict of Interests
All authors declare that there is no conflict of interests regarding the publication of this paper.
Authors' Contribution
Mariegold Wollam performed data analysis and interpretation and preparation of paper. Andrea Weinstein helped in data acquisition and preparation of paper. Judith Saxton helped in data acquisition and preparation of paper. Lisa Morrow helped in data acquisition and preparation of paper. Beth Snitz helped in data acquisition and preparation of paper. Nicole Fowler helped in data acquisition and preparation of paper. Barbara Suever Erickson helped in genotyping procedures and preparation of paper. Kathryn Roecklein helped in genotyping procedures, data analysis and interpretation, and preparation of paper. Kirk Erickson helped in study concept and design, data analysis and interpretation, and preparation of paper.
References
- 1.Alzheimer's Association. 2014 Alzheimer's disease facts and figures. Alzheimer's & Dementia. 2014;10(2):e47–e92. doi: 10.1016/j.jalz.2014.02.001. [DOI] [PubMed] [Google Scholar]
- 2.Gatz M., Reynolds C. A., Fratiglioni L., et al. Role of genes and environments for explaining Alzheimer disease. Archives of General Psychiatry. 2006;63(2):168–174. doi: 10.1001/archpsyc.63.2.168. [DOI] [PubMed] [Google Scholar]
- 3.Coon K. D., Myers A. J., Craig D. W., et al. A high-density whole-genome association study reveals that APOE is the major susceptibility gene for sporadic late-onset Alzheimer's disease. Journal of Clinical Psychiatry. 2007;68(4):613–618. doi: 10.4088/jcp.v68n0419. [DOI] [PubMed] [Google Scholar]
- 4.Pitas R. E., Boyles J. K., Lee S. H., Hui D., Weisgraber K. H. Lipoproteins and their receptors in the central nervous system. Characterization of the lipoproteins in cerebrospinal fluid and identification of apolipoprotein B,E(LDL) receptors in the brain. The Journal of Biological Chemistry. 1987;262(29):14352–14360. [PubMed] [Google Scholar]
- 5.Farrer L. A., Cupples L. A., Haines J. L., et al. Effects of age, sex, and ethnicity on the association between apolipoprotein E genotype and Alzheimer disease. A meta-analysis. APOE and Alzheimer Disease Meta Analysis Consortium. The Journal of the American Medical Association. 1997;278(16):1349–1356. doi: 10.1001/jama.1997.03550160069041. [DOI] [PubMed] [Google Scholar]
- 6.Whitehair D. C., Sherzai A., Emond J., et al. Influence of apolipoprotein e ε4 on rates of cognitive and functional decline in mild cognitive impairment. Alzheimer's and Dementia. 2010;6(5):412–419. doi: 10.1016/j.jalz.2009.12.003. [DOI] [PMC free article] [PubMed] [Google Scholar]
- 7.Cosentino S., Scarmeas N., Helzner E., et al. APOE ε4 allele predicts faster cognitive decline in mild Alzheimer disease. Neurology. 2008;70(19):1842–1849. doi: 10.1212/01.wnl.0000304038.37421.cc. [DOI] [PMC free article] [PubMed] [Google Scholar]
- 8.National Institutes of Health. Alzheimer's Disease: Unraveling the Mystery. Government Printing Office; 2011. [Google Scholar]
- 9.Binder D. K., Scharfman H. E. Brain-derived neurotrophic factor. Growth Factors. 2004;22(3):123–131. doi: 10.1080/08977190410001723308. [DOI] [PMC free article] [PubMed] [Google Scholar]
- 10.Lee J., Fukumoto H., Orne J., et al. Decreased levels of BDNF protein in Alzheimer temporal cortex are independent of BDNF polymorphisms. Experimental Neurology. 2005;194(1):91–96. doi: 10.1016/j.expneurol.2005.01.026. [DOI] [PubMed] [Google Scholar]
- 11.Ventriglia M., Zanardini R., Bonomini C., et al. Serum brain-derived neurotrophic factor levels in different neurological diseases. BioMed Research International. 2013;2013:7. doi: 10.1155/2013/901082.901082 [DOI] [PMC free article] [PubMed] [Google Scholar]
- 12.Erickson K. I., Prakash R. S., Voss M. W., et al. Brain-derived neurotrophic factor is associated with age-related decline in hippocampal volume. The Journal of Neuroscience. 2010;30(15):5368–5375. doi: 10.1523/jneurosci.6251-09.2010. [DOI] [PMC free article] [PubMed] [Google Scholar]
- 13.Kambeitz J. P., Bhattacharyya S., Kambeitz-Ilankovic L. M., Valli I., Collier D. A., McGuire P. Effect of BDNF val66met polymorphism on declarative memory and its neural substrate: a meta-analysis. Neuroscience and Biobehavioral Reviews. 2012;36(9):2165–2177. doi: 10.1016/j.neubiorev.2012.07.002. [DOI] [PubMed] [Google Scholar]
- 14.Lim Y. Y., Villemagne V. L., Laws S. M., et al. BDNF Val66Met, Aβ amyloid, and cognitive decline in preclinical Alzheimer's disease. Neurobiology of Aging. 2013;34(11):2457–2464. doi: 10.1016/j.neurobiolaging.2013.05.006. [DOI] [PubMed] [Google Scholar]
- 15.Honea R. A., Cruchaga C., Perea R. D., et al. Characterizing the role of brain derived neurotrophic factor genetic variation in Alzheimer's disease neurodegeneration. PLoS ONE. 2013;8(9) doi: 10.1371/journal.pone.0076001.e76001 [DOI] [PMC free article] [PubMed] [Google Scholar]
- 16.Pezawas L., Verchinski B. A., Mattay V. S., et al. The brain-derived neurotrophic factor val66met polymorphism and variation in human cortical morphology. The Journal of Neuroscience. 2004;24(45):10099–10102. doi: 10.1523/jneurosci.2680-04.2004. [DOI] [PMC free article] [PubMed] [Google Scholar]
- 17.Laumet G., Chouraki V., Grenier-Boley B., et al. Systematic analysis of candidate genes for Alzheimer's disease in a French, genome-wide association study. Journal of Alzheimer's Disease. 2010;20(4):1181–1188. doi: 10.3233/jad-2010-100126. [DOI] [PubMed] [Google Scholar]
- 18.Huang R., Huang J., Cathcart H., Smith S., Poduslo S. E. Genetic variants in brain-derived neurotrophic factor associated with Alzheimer's disease. Journal of Medical Genetics. 2007;44(2, article e66) doi: 10.1136/jmg.2006.044883. [DOI] [PMC free article] [PubMed] [Google Scholar]
- 19.Fehér Á., Juhász A., Rimanóczy Á., Kálmán J., Janka Z. Association between BDNF Val66Met polymorphism and alzheimer disease, dementia with lewy bodies, and pick disease. Alzheimer Disease and Associated Disorders. 2009;23(3):224–228. doi: 10.1097/wad.0b013e318199dd7d. [DOI] [PubMed] [Google Scholar]
- 20.Bertocci B., Miggiano V., Da Prada M., Dembic Z., Lahm H.-W., Malherbe P. Human catechol-O-methyltransferase: cloning and expression of the membrane-associated form. Proceedings of the National Academy of Sciences of the United States of America. 1991;88(4):1416–1420. doi: 10.1073/pnas.88.4.1416. [DOI] [PMC free article] [PubMed] [Google Scholar]
- 21.Männistö P. T., Kaakkola S. Catechol-O-methyltransferase (COMT): biochemistry, molecular biology, pharmacology, and clinical efficacy of the new selective COMT inhibitors. Pharmacological Reviews. 1999;51(4):593–628. [PubMed] [Google Scholar]
- 22.Bilder R. M., Volavka J., Lachman H. M., Grace A. A. The catechol-O-methyltransferase polymorphism: relations to the tonic-phasic dopamine hypothesis and neuropsychiatric phenotypes. Neuropsychopharmacology. 2004;29(11):1943–1961. doi: 10.1038/sj.npp.1300542. [DOI] [PubMed] [Google Scholar]
- 23.Barnett J. H., Scoriels L., Munafò M. R. Meta-analysis of the cognitive effects of the catechol-O-methyltransferase gene Val158/108Met polymorphism. Biological Psychiatry. 2008;64(2):137–144. doi: 10.1016/j.biopsych.2008.01.005. [DOI] [PubMed] [Google Scholar]
- 24.Bruder G. E., Keilp J. G., Xu H., et al. Catechol-O-methyltransferase (COMT) genotypes and working memory: associations with differing cognitive operations. Biological Psychiatry. 2005;58(11):901–907. doi: 10.1016/j.biopsych.2005.05.010. [DOI] [PubMed] [Google Scholar]
- 25.de Frias C. M., Annerbrink K., Westberg L., Eriksson E., Adolfsson R., Nilsson L.-G. COMT gene polymorphism is associated with declarative memory in adulthood and old age. Behavior Genetics. 2004;34(5):533–539. doi: 10.1023/b:bege.0000038491.06972.8c. [DOI] [PubMed] [Google Scholar]
- 26.Starr J. M., Fox H., Harris S. E., Deary I. J., Whalley L. J. COMT genotype and cognitive ability: a longitudinal aging study. Neuroscience Letters. 2007;421(1):57–61. doi: 10.1016/j.neulet.2007.05.023. [DOI] [PubMed] [Google Scholar]
- 27.Rodríguez-Rodríguez E., Sánchez-Juan P., Vázquez-Higuera J. L., et al. Genetic risk score predicting accelerated progression from mild cognitive impairment to Alzheimer's disease. Journal of Neural Transmission. 2013;120(5):807–812. doi: 10.1007/s00702-012-0920-x. [DOI] [PubMed] [Google Scholar]
- 28.Fritsche L. G., Chen W., Schu M., et al. Seven new loci associated with age-related macular degeneration. Nature Genetics. 2013;45(4):433–439. doi: 10.1038/ng.2578. [DOI] [PMC free article] [PubMed] [Google Scholar]
- 29.De Jager P. L., Chibnik L. B., Cui J., et al. Integration of genetic risk factors into a clinical algorithm for multiple sclerosis susceptibility: a weighted genetic risk score. The Lancet Neurology. 2009;8(12):1111–1119. doi: 10.1016/s1474-4422(09)70275-3. [DOI] [PMC free article] [PubMed] [Google Scholar]
- 30.Cornelis M. C., Qi L., Zhang C., et al. Joint effects of common genetic variants on the risk for type 2 diabetes in U.S. men and women of European ancestry. Annals of Internal Medicine. 2009;150(8):541–550. doi: 10.7326/0003-4819-150-8-200904210-00008. [DOI] [PMC free article] [PubMed] [Google Scholar]
- 31.Snitz B. E., Morrow L. A., Rodriguez E. G., Huber K. A., Saxton J. A. Subjective memory complaints and concurrent memory performance in older patients of primary care providers. Journal of the International Neuropsychological Society. 2008;14(6):1004–1013. doi: 10.1017/s1355617708081332. [DOI] [PMC free article] [PubMed] [Google Scholar]
- 32.Morrow L. A., Snitz B. E., Rodriquez E. G., Huber K. A., Saxton J. A. High medical co-morbidity and family history of dementia is associated with lower cognitive function in older patients. Family Practice. 2009;26(5):339–343. doi: 10.1093/fampra/cmp047. [DOI] [PMC free article] [PubMed] [Google Scholar]
- 33.Fowler N. R., Morrow L. A., Tu L., et al. Association between cognitive decline in older adults and use of primary care physician services in Pennsylvania. Journal of Primary Care & Community Health. 2012;3(3):201–209. doi: 10.1177/2150131911434204. [DOI] [PMC free article] [PubMed] [Google Scholar]
- 34.Morris J. C., Heyman A., Mohs R. C., et al. The Consortium to Establish a Registry for Alzheimer's Disease (CERAD). Part I. Clinical and neuropsychological assessment of Alzheimer's disease. Neurology. 1989;39(9):1159–1165. doi: 10.1212/WNL.39.9.1159. [DOI] [PubMed] [Google Scholar]
- 35.Wechsler D. Wechsler Memory Scale—Revised. New York, NY, USA: The Psychological Corporation; 1987. [Google Scholar]
- 36.Shin M.-S., Park S.-Y., Park S.-R., Seol S.-H., Kwon J. S. Clinical and empirical applications of the Rey-Osterrieth Complex Figure Test. Nature Protocols. 2006;1(2):892–899. doi: 10.1038/nprot.2006.115. [DOI] [PubMed] [Google Scholar]
- 37.Wechsler D. Wechsler Adult Intelligence Scale—Revised Manual. New York, NY, USA: The Psychological Corporation; 1981. [Google Scholar]
- 38.Spreen O., Strauss E. A Compendium of Neuropsychological Tests. New York, NY, USA: Oxford University Press; 1998. [Google Scholar]
- 39.Reitan R. M. Validity of the trail-making tests as an indication of organic brain damage. Perceptual and Motor skills. 1958;(8):271–276. [Google Scholar]
- 40.Kaplan E., Goodglass H., Weintraub S. Boston Naming Test. 2nd. Philadelphia, Pa, USA: Lippincott Williams & Wilkins; 2001. [Google Scholar]
- 41.Radloff L. S. The CES-D Scale: a self-report depression scale for research in the general population. Applied Psychological Measurement. 1977;1(3):385–401. doi: 10.1177/014662167700100306. [DOI] [Google Scholar]
- 42.McDowell I., Newell C. Measuring Health: A Guide to Rating Scales and Questionnaires. Oxford, UK: Oxford University Press; 1987. [Google Scholar]
- 43.Galasko D., Bennett D., Sano M., et al. An inventory to assess activities of daily living for clinical trials in Alzheimer's disease. Alzheimer Disease & Associated Disorders. 1997;11(2):S33–S39. doi: 10.1097/00002093-199700112-00005. [DOI] [PubMed] [Google Scholar]
- 44.Ganguli M., Gilby J., Seaberg E., Belle S. Depressive symptoms and associated factors in a rural elderly population: the MoVIES project. The American Journal of Geriatric Psychiatry. 1995;3(2):144–160. doi: 10.1097/00019442-199500320-00006. [DOI] [PubMed] [Google Scholar]
- 45.Lopez O. L., Becker J. T., Klunk W., et al. Research evaluation and diagnosis of possible Alzheimer's disease over the last two decades: II. Neurology. 2000;55(12):1863–1869. doi: 10.1212/wnl.55.12.1863. [DOI] [PubMed] [Google Scholar]
- 46.Fukumoto N., Fujii T., Combarros O., et al. Sexually dimorphic effect of the Val66Met polymorphism of BDNF on susceptibility to Alzheimer's disease: new data and meta-analysis. American Journal of Medical Genetics, Part B: Neuropsychiatric Genetics. 2010;153(1):235–242. doi: 10.1002/ajmg.b.30986. [DOI] [PubMed] [Google Scholar]
- 47.Damoiseaux J. S., Seeley W. W., Zhou J., et al. Gender modulates the APOE epsilon4 effect in healthy older adults: convergent evidence from functional brain connectivity and spinal fluid tau levels. The Journal of Neuroscience. 2012;32(24):8254–8262. doi: 10.1523/jneurosci.0305-12.2012. [DOI] [PMC free article] [PubMed] [Google Scholar]
- 48.Martínez M. F., Martín X. E., Alcelay L. G., et al. The COMT Val158 Met polymorphism as an associated risk factor for Alzheimer disease and mild cognitive impairment in APOE 4 carriers. BMC Neuroscience. 2009;10, article 125 doi: 10.1186/1471-2202-10-125. [DOI] [PMC free article] [PubMed] [Google Scholar]
- 49.Kauppi K., Nilsson L.-G., Persson J., Nyberg L. Additive genetic effect of APOE and BDNF on hippocampus activity. NeuroImage. 2014;89:306–313. doi: 10.1016/j.neuroimage.2013.11.049. [DOI] [PubMed] [Google Scholar]
- 50.Ward D. D., Summers M. J., Saunders N. L., Janssen P., Stuart K. E., Vickers J. C. APOE and BDNF Val66Met polymorphisms combine to influence episodic memory function in older adults. Behavioural Brain Research. 2014;271:309–315. doi: 10.1016/j.bbr.2014.06.022. [DOI] [PubMed] [Google Scholar]