

Abstract
Background
Android fat distribution (abdominal obesity) is associated with insulin resistance, hepatic steatosis, and greater secretion of large very low‐density lipoprotein (VLDL) particles in men. Since abdominal obesity is becoming increasingly prevalent in women, we aimed to investigate the relationship between android fat and hepatic lipid metabolism in pre‐ and postmenopausal women.
Methods and Results
We used a combination of stable isotope tracer techniques to investigate intrahepatic fatty acid synthesis and partitioning in 29 lean and 29 abdominally obese women (android fat/total fat 0.065 [0.02 to 0.08] and 0.095 [0.08 to 0.11], respectively). Thirty women were premenopausal aged 35 to 45 and they were matched for abdominal obesity with 28 postmenopausal women aged 55 to 65. As anticipated, abdominal obese women were more insulin resistant with enhanced hepatic secretion of large (404±30 versus 268±26 mg/kg lean mass, P<0.001) but not small VLDL (160±11 versus 142±13). However, postmenopausal status had a pronounced effect on the characteristics of small VLDL particles, which were considerably triglyceride‐enriched (production ratio of VLDL 2‐ triglyceride:apolipoprotein B 30±5.3 versus 19±1.6, P<0.05). In contrast to postmenopausal women, there was a tight control of hepatic fatty acid metabolism and triglyceride production in premenopausal women, whereby oxidation (r s=−0.49, P=0.006), de novo lipogenesis (r s=0.55, P=0.003), and desaturation (r s=0.48, P=0.012) were closely correlated with abdominal obesity‐driven large VLDL‐triglyceride secretion rate.
Conclusions
In women, abdominal obesity is a major driver of hepatic large VLDL particle secretion, whereas postmenopausal status was characterized by increased small VLDL particle size. These data provide a mechanistic basis for the hyperlipidemia observed in postmenopausal obesity.
Keywords: apolipoproteins, cholesterol, lipids, lipoproteins, menopause, women
Introduction
Menopause is associated with increased cardiovascular disease and once women develop acute coronary symptoms, they have worse short‐ and long‐term outcomes than men.1 Many different factors contribute, including marked hormonal changes,2 changes in metabolic profile associated with increased risk of the metabolic syndrome,3 and relative increase in intra‐abdominal fat with age.4 Accumulation of intra‐abdominal fat is associated with increased waist circumference and liver fat,5 overproduction of very low‐density lipoprotein (VLDL), and decreased catabolism of apolipoprotein (apo)B‐containing particles in men.6 The catabolism of apoB‐containing particles is partly determined by plasma apoC‐III concentrations, and higher plasma apoC‐III has been associated with dyslipidemia in obese men.7 Although abdominal obesity tends to be associated with obesity in men, data from the United States have been used to estimate that 40% of women have an abdominal fat distribution pattern as defined by waist:hip ratio.8
Normally, fasting plasma triglycerides (TG) are determined by 2 distinct subclasses of VLDL9; VLDL1 is larger and more TG‐rich than VLDL2, the latter can either be secreted directly from the liver, or formed by the peripheral hydrolysis of VLDL1. Hypertriglyceridemia is associated with atherogenic dyslipidemia including the production of small dense LDL, lower HDL cholesterol, and accumulation of postprandial TG‐rich lipoproteins.10 In men with type 2 diabetes, the secretion of VLDL1 is associated with liver fat, hypertriglyceridemia, and increased atherogenic risk.11
Impaired hepatic fatty acid oxidation has been reported to be related to obesity and insulin resistance by some12, 13 but not all.14 Few detailed studies have investigated VLDL1 and VLDL2 kinetics in women, and none have compared the kinetics of VLDL or apoC‐III in pre‐ and postmenopausal women. We hypothesized that VLDL1‐TG and ‐apoB secretion would be higher in abdominally obese compared with abdominally lean women and aimed to investigate the effect of menopause status on this relationship by measuring hepatic de novo fatty acid synthesis (DNL), oxidation, and desaturation in relation to VLDL1 and VLDL2 kinetics in pre‐ and postmenopausal women.
Materials and Methods
Subjects
We recruited 60 healthy white women from local advertising and the Oxford Biobank as previously reported15 equally into pre‐ and postmenopausal groups aged 35 to 45 and 55 to 65, respectively. The age groups ensured that perimenopausal women were not included and postmenopausal status was defined as absence of menses for at least 12 months and follicle‐stimulating hormone >30 IU/L. Since we also wished to investigate the effect of android fat (abdominal obesity), we used waist circumference, a marker of android fat, to facilitate recruitment of women into groups with low or high android fat. For simplicity, we have referred to the group with low android fat as “lean.” A waist circumference of ≥80 cm was selected as the proxy measure of high android fat, with increased risk of cardiovascular disease in Europid women defined by the International Diabetes Federation16 and additionally, we recruited women into small waist (<80 cm, n=30), or large waist (80 to 84 cm, n=5; 85 to 91 cm, n=5; and 92 to 110 cm, n=5) categories in both menopausal groups. This was to ensure a good range of android fat in our cohort, and ensure exact matching of abdominal obesity between menopausal groups. Other inclusion and exclusion criteria have been previously described in a study relating to energy intake in a subset of the participants15 but briefly, women were excluded if they had any condition or treatment that would affect metabolic or hormonal status (including smoking, diabetes, or hormone replacement therapy), or had body mass index (BMI) <18.5 or >34.9. Smokers or women exceeding alcohol consumption guidelines of 2 to 3 units per day were also excluded.17 All participants gave informed, written consent and the study was approved by the Oxfordshire Clinical Research Ethics Committee. Participants attended the Clinical Research Unit prior to the metabolic day in order to be given deuterated water for consumption the evening before the study day, and to give a blood sample for background isotopic enrichment measurements relating to the measurement of DNL (see below).
Measurement of Liver, Subcutaneous, and Visceral Fat and Body Composition
Intrahepatic fat was measured by magnetic resonance spectroscopy, visceral and subcutaneous fat were measured by magnetic resonance imaging after an overnight fast and within 2 weeks of the study day,18 and whole body composition and fat distribution (eg, android and gynoid fat) were measured using DEXA.15
Metabolic Study Day
Participants arrived after an overnight fast and after consuming deuterated water (2H2O, in order to measure de novo lipogenesis, DNL) (3 g/kg body water) at 8 and 10 pm the evening before the study day and then continued to consume enriched water (2.5 g per 500 mL water), in order to achieve and maintain a plasma water enrichment of 0.3%.19 A cannula was placed in an antecubital vein in order to take blood samples for the estimation of DNL in VLDL1‐ and VLDL2‐palmitate, and background isotopic enrichments for the kinetic studies. Another cannula was placed in the contralateral arm to administer intravenous boluses of [2H3]leucine (7 mg/kg) and [2H5]glycerol (500 mg), while an intravenous infusion of [U‐13C]palmitic acid, potassium salt complexed with albumin20 at 0.03 μmol/kg per minute, was started. Blood samples were taken for a further 8 hours and VLDL1 and VLDL2 were isolated from plasma using density gradient ultracentrifugation.20 Due to technical problems, 1 participant did not receive the palmitate infusion, 1 participant's infusion was stopped early, and 1 participant did not complete the metabolic study day.
Biochemical Analyses
Blood samples were drawn into heparinized syringes (Sarstedt, Leicester, UK) and plasma was rapidly separated at 4°C. Plasma metabolites were analyzed enzymatically,20 insulin was measured by radioimmunoassay (Millipore [UK] Ltd, Watford, UK), and homeostatic model assessment of insulin resistance was calculated as an index of insulin resistance.21 A time‐averaged area‐under‐the‐curve for plasma 3‐hydroxybutyrate (3OHB) and nonesterified fatty acids (NEFA) was calculated from hourly values taken during the study. Serum steroids (cortisol, dehydroepiandrosterone, and androstenedione) were measured by liquid chromatography/tandem mass spectrometry using a Waters Xevo mass spectrometer with Acquity uPLC system as described previously.22 [2H5]glycerol in plasma, VLDL1 and VLDL2‐TG (to trace TG) and [2H3]leucine in plasma, and VLDL1‐and VLDL2‐apoB (to trace whole particles) were measured by gas chromatography–mass spectrometry.23 [U‐13C]palmitic acid was measured in plasma NEFA and VLDL1 and VLDL2‐TG by gas chromatography–mass spectrometry20 and the proportion of fatty acids (Fas) in VLDL‐TG that were derived from nonsystemic sources was calculated,20 assuming that 16:0 is representative of all FAs. Mathematical modeling of VLDL kinetics (VLDL1‐TG, VLDL2‐TG, VLDL1‐apoB, VLDL2‐apoB production and clearance) was calculated from [2H5]glycerol and [2H3]leucine enrichments in plasma and lipoprotein fractions.11 See Figures S1 and S2 for examples of raw data used for modeling. VLDL‐TG production rates were corrected for lean mass in order to consider delivery of TG to muscle as previously described24 but not corrected when considering hepatic FA trafficking. Total plasma apoC‐III and apoC‐III in plasma devoid of apoB‐containing particles were measured using a Hydragel LP CIII Electroimmunodiffusion kit (Sebia, France) with appropriate standards and quality controls according to the manufacturer's instructions. By difference, we calculated apoC‐III concentrations in apoB‐containing particles (apoC‐III LpB). ApoCIII kinetic modeling was carried out as previously described25 and assumes (consistent with previous studies, and earlier radiotracer studies) that apoCIII exchanges between VLDL and HDL particles, and therefore that measuring apoCIII kinetics in plasma is valid.
The ratio of [U‐13C]16:1n‐7/[U‐13C]16:0 in VLDL1 and VLDL2‐TG was determined as a short‐term index of hepatic stearoyl‐CoA desaturase (SCD) activity (the “isotopic desaturation index”) and also the SCD16 and SCD18 FA ratios.26 FA methyl esters prepared from VLDL1 and VLDL2‐TG FAs20 were analyzed by GC13 to quantify 16:0 and 16:1n‐7, and by GC‐Isotope Ratio Mass Spectrometer to measure isotopic enrichment.26
Hepatic DNL was measured on the study day, based on the incorporation of 2H in plasma water (Finnigan GasBench‐II; ThermoFisher Scientific, UK) and into VLDL1‐ and VLDL2‐TG palmitate using gas chromatography–mass spectrometry.27 For simplicity, this is referred to as “%DNL” and represents synthesis of FAs from precursors such as sugars and amino acids.28
FA rate of appearance (RaNEFA) was calculated from the [U‐13C]16:0 infusion rate and enrichment in the plasma NEFA fraction and RdNEFA was assumed to equal RaNEFA.24
Statistical Analysis
Statistical analysis was performed using SPSS Statistics 19 (IBM, SPSS products, Chertsey, UK). Two‐way ANOVA was used to determine the effect of abdominal obesity and menopausal status (fixed factors) on each dependent variable, and interaction between the fixed factors. A significant interaction term indicated that the relationship between the dependent variable and abdominal obesity was significantly different in pre‐ and postmenopausal women. Associations between variables were carried out using Spearman's rank correlation coefficient (univariate analysis).
In order to visualize relationships between metabolic variables, we plotted significant correlations between metabolic and anthropometric variables related to hepatic FA partitioning using “hive plots.”29 Each variable is represented by a node and the nodes are joined by blue (significant positive correlations) or red (significant negative correlations) lines. The nodes are placed on 3 duplicated radial axes, which represent grouped variables (anthropometric and metabolic variables/VLDL1 or VLDL2). The axes are duplicated in order to allow for representation of correlations within the variable group (eg, there are lines joining the isotopic desaturation index and %DNL in VLDL1 for pre‐ and postmenopausal women, representing significant positive correlations).
Power Calculation
Using data from a study of the reproducibility of relevant kinetic parameters (VLDL TG and apoB100 secretion rates, VLDL‐TG clearance rate, rate of appearance NEFA,30 and DNL),19 separate power calculations were carried out and the numbers in pre‐ and postmenopausal groups to detect a 40% difference with power of 0.80 at α of 0.05 were 4, 8, 9, 10, and 15, respectively (in each group). A difference of 40% was considered to be clinically significant and was within the range of differences previously reported in other studies.11
Results
Sixty women were recruited: mean age was 41.0 years (range 35 to 45) for premenopausal and 58.1 years (55 to 64) for postmenopausal women. Mean age when divided according to abdominal obesity was 49.3 (35 to 64) and 49.3 (35 to 63) for lean and abdominally obese women, respectively. Plasma follicle‐stimulating hormone concentrations ranged from 3.0 to 21.3 and 46.5 to 125 IU/L in pre‐ and postmenopausal women, respectively (confirming menopausal status). Fifty‐eight women from whom DEXA scans were available are included in this study, divided according to menopause status and android fat measurement (corrected for total fat), for statistical analyses. Lean women had a mean android fat of 0.065 (SD 0.013) and abdominally obese women had a mean value of 0.094 (SD 0.008). Gynoid fat was significantly lower, and intra‐abdominal fat was significantly higher in postmenopausal women, despite being matched for abdominal obesity (Table 1). Liver fat was generally low, although 6 women, all abdominally obese, had values of >5%. BMI was not significantly different between menopausal groups and ranged from 21.5 to 33.0 kg/m2 in abdominally obese and 19.5 to 27.6 kg/m2 in abdominally lean women. Thus, some abdominally lean women would be classified as overweight by BMI, and some abdominally obese women would be classified as lean by BMI.
Table 1.
Body Composition in Women According to Menopausal Status and Abdominal Obesity
| Premenopausal (n=30) | Postmenopausal (n=30)a | Lean (n=29) | Abdominally Obese (n=29) | P meno | P Abd obesity | |
|---|---|---|---|---|---|---|
| Waist, cm | 83.5 (1.8) | 82.1 (1.4) | 77.1 (0.86) | 88.6 (1.5) | NS | <0.001 |
| BMI, kg/m2 | 24.9 (0.6) | 24.8 (0.4) | 23.2 (0.36) | 26.6 (0.54) | NS | <0.001 |
| WHR | 0.85 (0.01) | 0.84 (0.01) | 0.82 (0.009) | 0.87 (0.01) | NS | 0.001 |
| Gynoid fat | 5.3 (0.25) | 5.0 (0.14) | 4.6 (0.17) | 5.6 (0.20) | NS | <0.001 |
| Gynoid fatb | 0.24 (0.07) | 0.21 (0.05) | 0.25 (0.006) | 0.20 (0.004) | <0.01 | <0.001 |
| Android:gynoid ratio | 0.35 (0.02) | 0.39 (0.02) | 0.27 (0.015) | 0.47 (0.015) | <0.05 | <0.001 |
| Intra‐ab fat, cm2 | 40.7 (4.1) | 53.3 (5.5) | 26.5 (2.0) | 67 (4.6) | <0.05 | <0.001 |
| Subcut fat, cm2 | 225.0 (17.0) | 241.0 (14.0) | 181 (11) | 282 (14) | NS | <0.001 |
| Fat mass, kg | 23.2 (1.3) | 23.4 (0.9) | 19.0 (0.72) | 27.6 (0.88) | NS | <0.001 |
| Lean mass, kg | 42.4 (0.9) | 39.4 (0.8) | 39.5 (0.89) | 42.4 (0.87) | <0.05 | <0.001 |
| Fat:lean mass | 0.54 (0.03) | 0.60 (0.02) | 0.49 (0.21) | 0.65 (0.015)c | <0.05 | <0.001 |
| Liver fat, % | 0.78 (0.25 to 11.5) | 0.97 (0.44 to 6.8) | 0.61 (0.25 to 2.1) | 1.3 (0.32 to 11.5) | NS | <0.001 |
Data presented as mean (SEM) or median (range). Statistical significance based on 2‐way ANOVA: P meno, statistical significance for an effect of menopausal status; P Abd obesity, statistical significance for an effect of abdominal obesity. BMI indicates body mass index; Intra‐ab fat, intra‐abdominal fat; NS, not significant; Subcut fat, subcutaneous fat; WHR, waist‐to‐hip ratio.
n=30 for postmenopausal women apart from data derived from DEXA measurements, which were n=28 (gynoid fat, android: gynoid ratio, fat mass, lean mass and fat:lean mass).
Corrected for total fat mass in order to investigate differences in body fat distribution.
P<0.05 for interaction between abdominal obesity and menopausal status.
Postmenopausal women had significantly higher concentrations of plasma total, LDL, non‐HDL cholesterol, apoCIII‐LpB, plasma apoB, and systolic BP than premenopausal women (Table 2). Women with abdominal obesity were more insulin resistant with a more adverse lipid profile (higher non‐HDL cholesterol, plasma TG, VLDL1‐ and VLDL2‐TG concentrations). One postmenopausal woman had impaired fasting glucose.
Table 2.
Biochemical and Metabolic Variables in Women According to Menopausal Status and Abdominal Obesity
| Premenopausal (n=30) | Postmenopausal (n=30) a | Lean (n=29) | Abdominally Obese (n=29) | P meno | P Abd obesity | |
|---|---|---|---|---|---|---|
| Total chol, mmol/L | 4.9 (0.1) | 5.9 (0.2) | 5.3 (0.2) | 5.5 (0.2) | <0.001 | NS |
| LDL chol, mmol/L | 2.9 (0.1) | 3.8 (0.2) | 3.1 (0.1) | 3.5 (0.2) | <0.001 | <0.05 |
| HDL chol, mmol/L | 1.6 (0.1) | 1.7 (0.1) | 1.8 (0.07) | 1.4 (0.06) | NS | <0.001 |
| Non‐HDL chol, mmol/L | 3.3 (0.1) | 4.2 (0.2) | 3.5 (0.15) | 4.0 (0.18) | <0.001 | <0.01 |
| TG, mmol/L | 0.9 (0.1) | 0.9 (0.1) | 0.72 (0.05) | 1.09 (0.15) | NS | <0.01 |
| VLDL1‐TG, μmol/L | 142 (33 to 2083) | 226 (82 to 1090) | 181 (26) | 369 (72) | NS | 0.001 |
| VLDL2‐TG, μmol/L | 142 (39 to 1061) | 189 (78 to 488) | 154 (17) | 247 (34) | NS | <0.01 |
| Plasma apoC‐III, mg/L | 28.7 (1.9) | 33.8 (1.5) | 31 (1.7) | 31 (2.0) | 0.06 | NS |
| apoCIII‐LpB, mg/L | 11.9 (0.9) | 15.5 (1.0) | 13 (0.9) | 14 (1.1) | <0.01 | NS |
| ApoC‐III Lp nonB, mg/L | 16.8 (1.4) | 18.4 (1.0) | 18 (1.2) | 17 (1.2) | NS | NS |
| Plasma apoB, g/L | 0.73 (0.51 to 1.27) | 0.89 (0.51 to 1.37) | 0.78 (0.51 to 1.23) | 0.88 (0.51 to 1.27) | 0.001 | <0.05 |
| VLDL1‐apoB, g/L | 0.006 (0.001 to 0.05) | 0.007 (0.004 to 0.03) | 0.005 (0.001 to 0.03) | 0.008 (0.004 to 0.05) | NS | <0.05 |
| VLDL2‐apoB, g/L | 0.018 (0.004 to 0.13) | 0.023 (0.01 to 0.06) | 0.018 (0.004 to 0.04) | 0.023 (0.01 to 0.13) | NS | <0.05 |
| Insulin, mU/L | 11.5 (0.9) | 10.5 (0.4) | 9.2 (0.44) | 12.8 (0.79) | NS | <0.001 |
| Glucose, mmol/L | 5.0 (0.1) | 5.1 (0.1) | 4.9 (0.08) | 5.2 (0.07) | NS | <0.05 |
| HOMA‐IR | 3.1 (0.3) | 2.8 (0.1) | 2.4 (0.14) | 3.5 (0.24) | NS | <0.01 |
| NEFA, μmol (AUC) | 591 (33) | 626 (25) | 633 (32) | 579 (27) | NS | NS |
| Plasma 3OHB, μmol (AUC) | 156 (13.5) | 130 (13.5) | 160 (14) | 126 (13) | NS | <0.05 |
| Systolic BP, mm Hg | 114 (2.2) | 126 (2.5) | 119 (2.8) | 121 (2.5) | 0.001 | NS |
| Diastolic BP, mm Hg | 75 (1.4) | 75 (2.3) | 75 (1.7) | 76 (1.8) | NS | NS |
Data presented as mean (SEM) or median (range). Statistical significance based on 2‐way ANOVA: P meno, statistical significance for an effect of menopausal status; P Abd obesity, statistical significance for an effect of abdominal obesity; NS, not significant; no significant interaction between abdominal obesity and menopausal status was found. 3OHB indicates plasma 3‐hydroxybutyrate; apoB, apolipoprotein B; apoC‐III LpB, apoC‐III associated with lipoprotein B containing particles; AUC, area under the curve; BP, blood pressure; Chol, cholesterol; HDL, high‐density lipoprotein; HOMA‐IR, homeostatic model assessment of insulin resistance; LDL, low‐density lipoprotein; NEFA, nonesterified fatty acids; TG, triglyceride; VLDL, very low‐density lipoprotein.
n=30 for postmenopausal women apart from AUC measurements for NEFA and 3OHB which are n=29.
The rate of disappearance of FAs (RdNEFA), expressed per kg lean mass was significantly higher in post‐ compared to premenopausal women (Table 3). Release of FAs into plasma (RaNEFA) per unit weight of adipose tissue was lower in women with abdominal obesity, but VLDL1‐TG and VLDL1‐apoB production were significantly higher. The ratio of VLDL2‐TG direct production: VLDL2‐apoB production was significantly higher in post‐ compared to premenopausal women, indicating production of larger particles.
Table 3.
Kinetic Estimates Relating to NEFA, VLDL, and apoC‐III Metabolism in Women According to Menopausal Status and Abdominal Obesity
| Premenopausal | Postmenopausal | Lean | Abdominally Obese | P meno | P Abd obesity | |
|---|---|---|---|---|---|---|
| RaNEFA, μmol min−1 per kg fat mass | 9.1 (0.8) n=30 | 10.0 (0.6) n=26 | 11 (0.8) n=28 | 8.2 (0.6) n=28 | NS | 0.01 |
| RdNEFA, μmol min−1 per kg lean mass | 4.6 (0.3) n=30 | 5.8 (0.3) n=26 | 5.1 (0.4) n=28 | 5.3 (0.3) n=28 | <0.055 | NS |
| RaNEFA, μmol min−1 | 193 (12) n=30 | 220 (12) n=28 | 197 (13) n=28 | 219 (11) n=28 | 0.05 | NS |
| VLDL1‐TG Prod, mg/kg lean mass | 332 (35) n=26 | 350 (27) n=26 | 268 (26) n=24 | 404 (30) n=28 | NS | 0.001 |
| VLDL2‐TG dirProd, mg/kg lean mass | 129 (12) n=26 | 174 (12) n=26 | 142 (13) n=24 | 160 (11) n=28 | <0.01 | 0.07 |
| VLDL2‐TG indirProd, mg/kg lean mass | 100 (21) n=25 | 110 (14) n=26 | 88 (17) n=24 | 120 (18) n=27 | NS | NS |
| VLDL1‐TG FCR, pools/day | 29 (3.2) n=26 | 26 (2.5) n=27 | 31 (2.9) n=24 | 25 (2.8) n=28 | NS | NS |
| VLDL2‐TG FCR, pools/day | 22 (2.3) n=26 | 26 (2.7) n=27 | 26 (2.6) n=24 | 22 (2.4) n=28 | NS | NS |
| VLDL1‐TG FTR, pools/day | 6.8 (1.0) n=25 | 7.5 (1.0) n=27 | 7.9 (1.2) n=24 | 6.6 (0.8) n=27 | NS | NS |
| VLDL1‐TG FDC, pools/day | 22 (3.2) n=26 | 18 (2.3) n=27 | 23 (3.0) n=24 | 18 (2.7) n=28 | NS | NS |
| VLDL1‐apoB FDC, pools/day | 9.2 (1.7) n=28 | 7.5 (1.5) n=28 | 8.5 (1.5) n=26 | 8.5 (1.7) n=29 | NS | NS |
| VLDL1‐apoB FTR, pools/day | 8.6 (1.0) n=27 | 8.2 (0.8) n=28 | 8.5 (1.0) n=26 | 8.1 (0.8) n=28 | NS | NS |
| VLDL1‐apoB FCR, pools/day | 18 (1.9) n=28 | 16 (1.5) n=28 | 17 (1.6) n=26 | 16 (1.8) n=29 | NS | NS |
| VLDL2‐apoB FCR, pools/day | 8.6 (0.8) n=28 | 7.7 (0.8) n=28 | 8.7 (0.8) n=26 | 7.8 (0.8) n=29 | NS | NS |
| VLDL1‐apoB Prod, mg/day | 344 (38) n=28 | 316 (27) n=28 | 253 (26) n=26 | 397 (34)a n=29 | NS | 0.001 |
| VLDL2‐apoB dirProd, mg/day | 304 (21) n=28 | 278 (20) n=28 | 269 (19) n=26 | 311 (22)a n=29 | NS | NS |
| VLDL2‐apoB indirProd, mg/day | 194 (34) n=28 | 163 (19) n=28 | 130 (18) n=25 | 215 (31) n=28 | NS | <0.05 |
| VLDL1‐TG Prod:VLDL1 apoB Prod, mg/day | 42 (2.8) n=26 | 49 (5.9) n=27 | 45 (4.2) n=24 | 47 (5.2) n=28 | NS | NS |
| VLDL2‐TG dirProd:VLDL2 apoB Prod, mg/day | 19 (1.6) n=26 | 30 (5.3) n=27 | 21 (2.1) n=24 | 28 (5.1) n=28 | <0.05 | NS |
| ApoC‐III FCR, pools/day | 1.1 (0.1) n=30 | 1.1 (0.1) n=30 | 1.1 (0.1) n=29 | 1.0 (0.09) n=29 | NS | NS |
| ApoC‐III PR, mg/kg per day | 1.5 (0.2) n=30 | 1.7 (0.1) n=30 | 1.6 (0.2) n=29 | 1.4 (0.1) n=29 | NS | NS |
Data presented as mean (SEM). Statistical significance based on 2‐way ANOVA: P meno, statistical significance for an effect of menopausal status; P Abd obesity, statistical significance for an effect of abdominal obesity. apoB indicates apolipoprotein B100; dirprod, direct production; FCR, fractional clearance rate; FDC, fractional direct clearance; FTR, fractional transfer rate; indirprod, indirect production; lean, lean tissue; NEFA, nonesterified fatty acids; NS, not significant; Prod, production; PR, production rate; Ra, rate of appearance; Rd, rate of disappearance; TG, triacylglycerol; VLDL, very low‐density lipoprotein.
P<0.05 for interaction between abdominal obesity and menopausal status.
There were no significant positive correlations between age and liver fat, VLDL1‐TG and VLDL2‐TG direct production, VLDL1 and VLDL2 direct apoB production, or VLDL1 and VLDL2‐TG:apoB production ratios within menopausal groups.
Plasma apoC‐III concentrations positively correlated with apoC‐III production rate (r s=0.59, P=9.0×10⁻⁷) but not clearance rate, indicating that plasma apoC‐III concentrations were determined by production rate. Plasma, HDL‐ and apoC‐III associated withlipoprotein B‐containing particle (apoC‐III LpB) concentrations were not affected by abdominal obesity, but plasma apoC‐III LpB concentrations were higher in postmenopausal women.
Overall, mean %DNL was less than 10% in VLDL1‐ and VLDL2‐palmitate (data not shown) and when corrected for flux from the liver, was not significantly different between menopausal groups, but was higher with abdominal obesity. Menopause status affected the relationship between abdominal obesity and 3OHB:NEFA, and abdominal obesity per se had a strong influence on factors related to FA partitioning (Table 4). Of note, the systemic FA contribution to VLDL1‐TG production was significantly higher in abdominally obese women, in line with higher VLDL1‐TG secretion.
Table 4.
Variables Relating to FA Metabolism in Women According to Menopausal Status and Abdominal Obesity
| Premenopausal | Postmenopausal | Lean | Abdominally Obese | P meno | P Abd obesity | |
|---|---|---|---|---|---|---|
| Nonsystemic FA—VLDL1‐TG, % | 15.5 (3.2) n=27 | 14.2 (2.6) n=23 | 9.5 (1.9) n=24 | 20 (3.4) n=26 | NS | <0.05 |
| Nonsystemic FA—VLDL2‐TG, % | 17.2 (3.4) n=27 | 18.6 (2.6) n=23 | 11 (2.1) n=24 | 24 (3.3) n=26 | NS | <0.01 |
| Nonsystemic FA contribution to VLDL1‐TG production, mg/day | 2943 (803) n=24 | 1678 (367) n=21 | 1180 (349) n=20 | 3290 (747) n=25 | NS | <0.001 |
| Nonsystemic FA contribution to VLDL2‐TG direct production, mg/day | 1028 (197) n=24 | 1192 (181) n=21 | 668 (146) n=20 | 1453 (185)* n=25 | <0.05 | <0.001 |
| Systemic FA contribution to VLDL1‐TG production, mg/day | 11 814 (1307) n=24 | 11 449 (956) n=21 | 9613 (946) n=20 | 13 269 (1183) n=25 | NS | <0.05 |
| Systemic FA contribution to VLDL2‐TG direct production, mg/day | 4563 (511) n=24 | 5594 (389) n=21 | 4709 (441) n=20 | 5312 (486) n=25 | 0.06 | NS |
| VLDL1‐TG isotopic desaturation index | 9.2 (3.0 to 29.2) n=30 | 10.5 (3.6 to 68.2) n=28 | 8.2 (3 to 29) n=28 | 10.6 (36 to 68) n=29 | NS | 0.06 |
| VLDL2‐TG isotopic desaturation index | 9.0 (3.2 to 28.5) n=30 | 10.2 (4.9 to 60.7) n=28 | 8.5 (3.5 to 28) n=28 | 10.6 (4.9 to 61) n=29 | NS | <0.05 |
| VLDL1‐16:0 TG synthesized de novo, mg/day | 118 (4.9 to 1444) n=26 | 283 (27.2 to 2564) n=26 | 114 (4.9 to 1444) n=23 | 309 (12 to 2564) n=28 | NS | 0.06 |
| VLDL2‐16:0 TG synthesized de novo, mg/day | 62 (0.42 to 351) n=26 | 102 (7.4 to 583) n=26 | 61 (42 to 351) n=23 | 117 (7.4 to 583) n=28 | NS | <0.05 |
| 3OHB/NEFA | 0.24 (0.012) n=30 | 0.22 (0.02) n=29 | 0.25 (0.02) n=29 | 0.21 (0.02) n=29** | NS | NS |
Data presented as mean (SEM) or median (range). Statistical significance based on 2‐way ANOVA: P meno, statistical significance for an effect of menopausal status; P Abd obesity, statistical significance for an effect of abdominal obesity. 3OHB indicates 3‐hydroxybutyrate; FA, fatty acid; NEFA, nonesterified fatty acids; NS, not significant; TG, triglyceride; VLDL, very low‐density lipoprotein.
*P<0.05, **P<0.01 for a statistically significant interaction between abdominal obesity and menopausal status.
To explore FA partitioning in relation to metabolic and anthropometric measurements, we tabulated univariate correlations between relevant variables in pre‐ and postmenopausal women (selected data in Tables 5 through 8 and complete analysis in Tables S1 through S4). The data are illustrated in hive plots (Figure 1), which clearly show that the patterns of correlations are quite different in pre‐ and postmenopausal women. In particular, the density of correlations in the top left of the figure for premenopausal women (Figure 1A, anthropometric and metabolic variables with VLDL2 metabolism) is markedly less for postmenopausal women (Figure 1B). Correlations relating to %DNL and VLDL production are shown in Figure 2A and 2B and between %DNL and plasma 3OHB in Figure 2C and 2D. The most marked univariate correlations relating to hepatic FA partitioning were between the isotopic desaturation index in VLDL1 and VLDL2‐TG and plasma 3OHB area under the curve (Figure 2E and 2F). VLDL‐ApoB and ‐TG production were highly correlated for VLDL1 and less so for VLDL2 (Figure 3). Serum cortisol concentrations were negatively correlated with waist‐to‐hip ratio in pre‐ (r s=−0.38, P=0.04) but not postmenopausal women. There was a significant correlation between abdominal fat and liver fat (r s=0.50, P<0.001, n=60). The importance of menopausal status in this relationship is shown in the hive plots and Tables 5 through 8 which showed, remarkably, that a significant correlation between liver fat and abdominal obesity was observed only in premenopausal women.
Table 5.
Correlation Coefficients (r s) for Premenopausal Women Between Selected Variables Relating to VLDL1 Metabolism, Liver Fat, and Intra‐Abdominal Fat
| Total Body Fat, kg | Android/Tot Fat, kg | Gynoid/Tot Fat, kg | Visceral Fat, cm2 | Subcut Fat, cm2 | HOMA‐IR | Plasma NEFAa, μmol/L | Plasma 3OHBa, μmol/L | VLDL1‐TG Prod/d | VLDL1‐TG SCD Iso Index | VLDL1‐TG SCD16 | VLDL1‐TG SCD18 | VLDL1‐TG DNL (%) | VLDL1‐TG 18:2n‐6 (%) | VLDL1‐TG Prod/apoB Prod | |
|---|---|---|---|---|---|---|---|---|---|---|---|---|---|---|---|
| Liver fat, % |
0.57 P=0.001 |
0.63 P<0.001 |
−0.39 P=0.034 |
0.71 P<0.001 |
0.47 P=0.009 |
0.63 P<0.001 |
−0.07 P=0.702 |
−0.42 P=0.022 |
0.40 P=0.045 |
0.41 P=0.025 |
−0.05 P=0.803 |
−0.33 P=0.078 |
0.47 P=0.009 |
−0.19 P=0.323 |
−0.29 P=0.150 |
| Total body fat, kg |
0.68 P<0.001 |
−0.63 P<0.001 |
0.80 P<0.001 |
0.90 P<0.001 |
0.36 P=0.052 |
−0.00 P=0.982 |
−0.33 P=0.077 |
0.61 P=0.001 |
0.39 P=0.039 |
0.17 P=0.370 |
−0.13 P=0.480 |
0.49 P=0.006 |
−0.35 P=0.055 |
−0.07 P=0.739 |
|
| Android/tot fat, kg |
−0.74 P<0.001 |
0.78 P<0.001 |
0.63 P<0.001 |
0.53 P=0.003 |
−0.10 P=0.596 |
−0.37 P=0.046 |
0.53 P=0.005 |
0.35 P=0.057 |
0.09 P=0.629 |
−0.20 P=0.300 |
0.32 P=0.085 |
−0.07 P=0.699 |
−0.07 P=0.719 |
See Supplemental Material for full statistical analysis. 3OHB indicates 3‐hydroxybutyrate; apoB, apolipoprotein B; AUC, area under the curve; d, day; DNL, de novo lipogenesis; HOMA‐IR, homeostatic model assessment of insulin resistance; iso, isotopic; NEFA, nonesterified fatty acids; prod, production; SCD, stearoyl‐CoA desaturase 1; SCD16, ratio of 16:1n‐7/16:0; SCD18, ratio 18:1n‐9/18:0; Subcut, subcutaneous; TG, triglyceride; tot, total; VLDL, very low‐density lipoprotein.
AUC.
Table 8.
Correlation Coefficients (r s) for Postmenopausal Women Between Selected Variables Relating to VLDL2 Metabolism, Liver Fat, and Intra‐Abdominal Fat
| Total Body Fat, kg | Android/Tot Fat, kg | Gynoid/Tot Fat, kg | Visceral Fat, cm2 | Subcut Fat, cm2 | HOMA‐IR | Plasma NEFAa, μmol/L | Plasma 3OHBa, μmol/L | VLDL2‐TG Prod/d | VLDL2‐TG SCD Iso Index | VLDL2‐TG SCD16 | VLDL2‐TG SCD18 | VLDL2‐TG DNL (%) | VLDL2‐TG 18:2n‐6 (%) | VLDL2‐TG Prod/apoB Prod | |
|---|---|---|---|---|---|---|---|---|---|---|---|---|---|---|---|
| Liver fat, % |
0.28 P=0.150 |
0.26 P=184 |
−0.42 P=0.028 |
0.61 P<0.001 |
0.26 P=0.192 |
0.23 P=0.232 |
0.00 P=0.994 |
0.09 P=0.647 |
−0.15 P=0.470 |
−0.05 P=0.797 |
−0.46 P=0.013 |
−0.44 P=0.016 |
0.11 P=0.564 |
0.15 P=0.450 |
0.11 P=0.594 |
| Total body fat, kg |
0.78 P<0.001 |
−0.57 P=0.002 |
0.73 P<0.001 |
0.86 P<0.001 |
0.29 P=0.133 |
−0.09 P=0.648 |
0.19 P=0.326 |
0.18 P=0.380 |
−0.03 P=0.875 |
−0.12 P=0.554 |
−0.04 P=0.842 |
0.13 P=0.518 |
0.27 P=0.171 |
0.30 P=0.133 |
|
| Android/tot fat, kg |
−0.76 P<0.001 |
0.72 P<0.001 |
0.69 P<0.001 |
0.35 P=0.064 |
−0.35 P=0.072 |
−0.14 P=0.475 |
0.20 P=0.341 |
0.20 P=0.329 |
−0.23 P=0.244 |
−0.13 P=0.506 |
0.16 P=0.423 |
0.22 P=0.275 |
0.31 P=0.123 |
See Supplementary Material for full statistical analysis. 3OHB indicates 3‐hydroxybutyrate; apoB, apolipoprotein B; AUC, area under the curve; d, day; DNL, de novo lipogenesis; HOMA‐IR, homeostatic model assessment of insulin resistance; iso, isotopic; NEFA, nonesterified fatty acids; prod, production; SCD, stearoyl‐CoA desaturase 1; SCD16, ratio of 16:1n‐7/16:0; SCD18, ratio 18:1n‐9/18:0; Subcut, subcutaneous; TG, triglyceride; tot, total; VLDL, very low‐density lipoprotein.
AUC.
Figure 1.
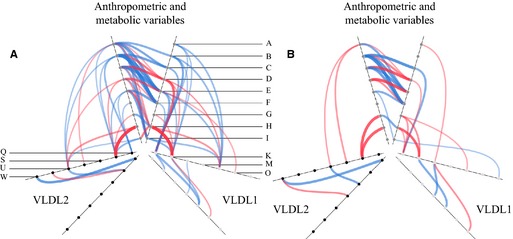
Significant correlations between variables relating to VLDL‐TG metabolism represented as hive plots for premenopausal (A) and postmenopausal (B) women. Each variable is represented by a node and the nodes are joined by blue (significant positive correlations) or red (significant negative correlations) lines. The thickness of the line represents the strength of the correlation. The nodes are placed on 3 duplicated radial axes that represent grouped variables (anthropometric and metabolic variables/VLDL 1 or VLDL 2). Individual nodes are coded as indicated and specific correlation coefficients are given in Supplemental Material. Node codes: A, liver fat (%); B, total body fat (kg); C, android fat/total fat; D, gynoid fat/total fat; E, visceral fat (cm2); F, subcut fat (cm2); G, NEFA (μmol/L); H, 3OHB (AUC); I, HOMA‐IR; K, VLDL‐TG SCD isotopic index; M, VLDL‐TG SCD18 index; O, VLDL‐TG 18:2n‐6 (%); Q, VLDL‐TG production per day; S, VLDL‐TG SCD16; U, VLDL‐TG DNL (%); W, VLDL‐TG production/apoB production. 3OHB indicates plasma 3‐hydroxybutyrate; apoB, apolipoprotein B; AUC, area under the curve; DNL, hepatic de novo lipogenesis; HOMA‐IR, homeostatic model assessment of insulin resistance; NEFA, plasma nonesterified fatty acids; SCD, stearoyl‐CoA desaturase; SCD16, 16:1 n‐7/16:0 ratio in VLDL‐TG; SCD18, 18:1 n‐9/18:0 ratio in VLDL‐TG; subcut, subcutaneous; TG, triglyceride; VLDL, very low‐density lipoprotein.
Figure 2.
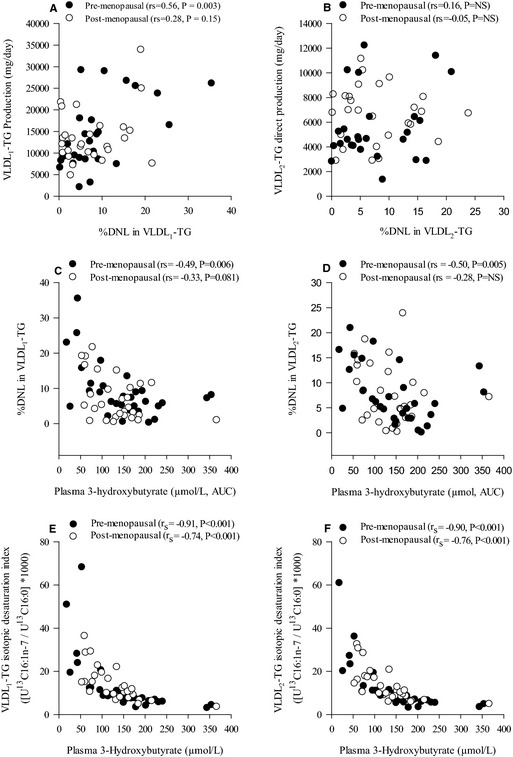
Correlations between VLDL 1‐TG production (mg/day) and the proportion (%) of DNL fatty acids VLDL 1‐TG (A), VLDL 2‐TG direct production (mg/day) and the proportion (%) of DNL fatty acids VLDL 2‐TG (B), the proportion (%) of DNL fatty acids VLDL 1‐TG and the AUC for plasma 3‐hydroxybutyrate (μmol/L) (C), the proportion (%) of DNL fatty acids VLDL 2‐TG and the AUC for plasma 3‐hydroxybutyrate (μmol/L) (D), and the association between plasma 3‐hydroxybutyrate concentrations (μmol/L) and the isotopic desaturation index ([U13C16:1n‐7/U13C16:0]*1000) in VLDL 1‐TG (E) and VLDL 2‐TG (F) in pre‐ (●) and post‐ (○) menopausal women. AUC indicates area under the curve; DNL, hepatic de novo lipogenesis; NS, not significant; TG, triglyceride; VLDL, very low‐density lipoprotein.
Figure 3.
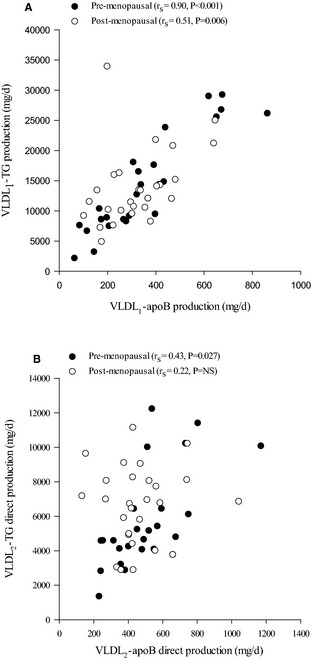
Correlations between VLDL 1‐apoB production (mg/day) and VLDL 1‐TG production (mg/day) (A), VLDL 2‐apoB production (mg/day) and VLDL 2‐TG direct production (mg/day) (B) in pre‐ (●) and post‐ (○) menopausal women. apoB, apolipoprotein B; NS, not significant; TG, triglyceride; VLDL, very low‐density lipoprotein.
Table 6.
Correlation Coefficients (r s) for Premenopausal Women Between Selected Variables Relating to VLDL2 Metabolism, Liver Fat, and Intra‐Abdominal Fat
| Total Body Fat, kg | Android/Tot Fat, kg | Gynoid/Tot Fat, kg | Visceral Fat, cm2 | Subcut Fat, cm2 | HOMA‐IR | Plasma NEFAa, μmol/L | Plasma 3OHBa, μmol/L | VLDL2‐TG Prod/d | VLDL2‐TG SCD Iso Index | VLDL2‐TG SCD16 | VLDL2‐TG SCD18 | VLDL2‐TG DNL (%) | VLDL2‐TG 18:2n‐6 (%) | VLDL2‐TG Prod/apoB Prod | |
|---|---|---|---|---|---|---|---|---|---|---|---|---|---|---|---|
| Liver fat, % |
0.57 P=0.001 |
0.63 P<0.001 |
−0.39 P=0.034 |
0.71 P<0.001 |
0.47 P=0.009 |
0.63 P<0.001 |
−0.07 P=0.702 |
−0.42 P=0.022 |
0.21 P=0.306 |
0.38 P=0.040 |
0.01 P=0.952 |
−0.37 P=0.042 |
0.42 P=0.021 |
−0.19 P=0.323 |
−0.29 P=0.150 |
| Total body fat, kg |
0.68 P<0.001 |
−0.63 P<0.001 |
0.80 P<0.001 |
0.90 P<0.001 |
0.36 P=0.052 |
−0.00 P=0.982 |
−0.33 P=0.077 |
0.51 P=0.007 |
0.41 P=0.023 |
0.21 P=0.257 |
−0.24 P=0.202 |
0.41 P=0.023 |
−0.25 P=0.177 |
0.23 P=0.255 |
|
| Android/tot fat, kg |
−0.74 P<0.001 |
0.78 P<0.001 |
0.63 P<0.001 |
0.53 P=0.003 |
−0.10 P=0.596 |
−0.37 P=0.046 |
0.29 P=0.145 |
0.36 P=0.052 |
0.12 P=0.516 |
−0.31 P=0.092 |
0.22 P=0.240 |
−0.05 P=0.791 |
0.11 P=0.580 |
See Supplementary Material for full statistical analysis. 3OHB indicates 3‐hydroxybutyrate; apoB, apolipoprotein B; AUC, area under the curve; d, day; DNL, de novo lipogenesis; HOMA‐IR, homeostatic model assessment of insulin resistance; iso, isotopic; NEFA, nonesterified fatty acids; prod, production; SCD, stearoyl‐CoA desaturase 1; SCD16, ratio of 16:1n‐7/16:0; SCD18, ratio 18:1n‐9/18:0; Subcut, subcutaneous; TG, triglyceride; tot, total; VLDL, very low‐density lipoprotein.
AUC.
Table 7.
Correlation Coefficients (r s) for Post‐Menopausal Women Between Selected Variables Relating to VLDL1 Metabolism, Liver Fat and Intra‐Abdominal Fat
| Total Body Fat, kg | Android/Tot Fat, kg | Gynoid/Tot Fat, kg | Visceral Fat, cm2 | Subcut Fat, cm2 | HOMA‐IR | Plasma NEFAa, μmol/L | Plasma 3OHBa, μmol/L | VLDL1‐TG Prod/d | VLDL1‐TG SCD Iso Index | VLDL1‐TG SCD16 | VLDL1‐TG SCD18 | VLDL1‐TG DNL (%) | VLDL1‐TG 18:2n‐6 (%) | VLDL1‐TG Prod/apoB Prod | |
|---|---|---|---|---|---|---|---|---|---|---|---|---|---|---|---|
| Liver fat, % |
0.28 P=0.150 |
0.26 P=0.184 |
−0.42 P=0.028 |
0.61 P<0.001 |
0.26 P=0.192 |
0.23 P=0.232 |
0.00 P=0.994 |
0.09 P=0.647 |
0.05 P=0.797 |
−0.11 P=0.595 |
−0.42 P=0.023 |
−0.26 P=0.173 |
0.04 P=0.838 |
0.11 P=0.578 |
0.26 P=0.200 |
| Total body fat, kg |
0.78 P<0.001 |
−0.57 P=0.002 |
0.73 P<0.001 |
0.86 P<0.001 |
0.29 P=0.133 |
−0.09 P=0.648 |
0.19 P=0.326 |
0.34 P=0.093 |
−0.01 P=0.949 |
−0.13 P=0.512 |
0.22 P=0.279 |
0.01 P=0.967 |
0.32 P=0.106 |
0.35 P=0.077 |
|
| Android/tot fat, kg |
−0.76 P<0.001 |
0.72 P<0.001 |
0.69 P<0.001 |
0.35 P=0.064 |
−0.35 P=0.072 |
−0.14 P=0.475 |
0.57 P=0.003 |
0.23 P=0.246 |
−0.21 P=0.287 |
−0.05 P=0.788 |
0.19 P=0.342 |
0.29 P=0.143 |
0.25 P=0.225 |
See Supplementary Material for full statistical analysis. 3OHB indicates 3‐hydroxybutyrate; apoB, apolipoprotein B; AUC, area under the curve; d, day; DNL, de novo lipogenesis; HOMA‐IR, homeostatic model assessment of insulin resistance; iso, isotopic; NEFA, nonesterified fatty acids; prod, production; SCD, stearoyl‐CoA desaturase 1; SCD16, ratio of 16:1n‐7/16:0; SCD18, ratio 18:1n‐9/18:0; Subcut, subcutaneous; TG, triglyceride; tot, total; VLDL, very low‐density lipoprotein.
AUC.
We also took the opportunity to examine metabolic variables according to liver fat content because of the importance of liver fat with respect to the metabolic complications of obesity.32 The median value in the cohort of 60 women was 0.85%. Of the 50% of women with lower liver fat, 17 were premenopausal and 13 were postmenopausal. In general, significant effects reflected those found by considering women according to abdominal obesity (Tables S5 through S7). However, the effect of liver fat on LDL, HDL, and non‐HDL cholesterol as well as VLDL‐TG production was less than for abdominal obesity.
Discussion
Using a combination of stable isotope tracer techniques, we investigated kinetic parameters of apoB, apoC‐III, and TG metabolism in pre‐ and postmenopausal women. We report for the first time that menopausal status is a determinant of hepatic TG flux through enhancement of adipose tissue NEFA flux, altered intrahepatic FA partitioning, and secretion of larger VLDL2. VLDL‐TG secretion is normally dependent on VLDL‐apoB100 secretion,33 but we found that VLDL2‐TG secretion after the menopause was dissociated from VLDL2‐apoB production. Systemic FAs were the major source of VLDL2‐TG in all women, but both systemic and nonsystemic FAs contributed to greater VLDL2‐TG secretion in postmenopausal women. We also report for the first time that VLDL1‐TG secretion is higher in abdominally obese women. Our main findings are summarized in Figure S3.
VLDL1 and VLDL2 metabolism have not previously been measured in relation to menopausal and abdominal obesity status in women. We measured 2 aspects of VLDL secretion: VLDL‐apoB secretion rate, which measures whole particle secretion; and VLDL‐TG secretion, which tracks the lipid component. Using these 2 parameters we were also able to estimate the relative sizes of VLDL1 and VLDL2 at the point of hepatic secretion. VLDL1 and VLDL2 secretion rates were correlated but in agreement with previous findings, their metabolism was independent34 as shown in hive plots.
VLDL1‐TG and VLDL1‐apoB production rates were significantly higher in the abdominally obese compared to abdominally lean women. Higher VLDL1‐TG secretion was attributable to both systemic and nonsystemic FA. There are no previous comparable studies, but in lean and obese premenopausal women there were no differences in total VLDL‐apoB or VLDL‐TG secretion.35, 36 Another study in premenopausal women found higher total VLDL‐TG production in upper‐body obese compared with lean women,37 although production was not corrected for any measure of body mass.
VLDL2‐TG direct production was higher in post‐ compared to premenopausal women, due to production of TG‐enriched VLDL2. This has not been reported previously and the relevance is not clear as yet, but small rather than large VLDL is implicated in atherosclerosis progression.38 VLDL2‐TG production was higher in postmenopausal women than men matched for plasma TG concentrations24 and as discussed by the authors, VLDL2 is more efficiently converted to LDL than VLDL1. Moderate hypercholesterolemia arises principally from overproduction of VLDL2 particles in men39; our study was not designed to measure LDL, kinetics but higher plasma and LDL cholesterol concentrations after the menopause were not accompanied by an increase in VLDL2‐apoB production.
Menopausal status did not affect VLDL1 or VLDL2 clearance, in contrast to the work of Mittendorfer.40 VLDL kinetics are sensitive to intra‐abdominal and liver fat content,32 and discrepancies between published studies may be due to liver fat content, and/or kinetic parameters not corrected for adiposity or lean mass. Although estrogen per se may affect VLDL kinetics,41 other factors such as the changes in body composition accompany estrogen deficiency. We found increased concentrations of plasma total and LDL cholesterol and apoB, which are typical features of dyslipidemia in postmenopausal women.42 Additionally, we found significantly higher apoC‐III LpB in postmenopausal women. Since apoC‐III plays a pivotal role in the development of hypertriglyceridemia,7 apoC‐III may play a role in the development of dyslipidemia in older, postmenopausal women.
Higher RdNEFA in postmenopausal women is consistent with the finding that exogenous estrogen reduced NEFA flux in postmenopausal women.43 This suggests that higher NEFA flux in postmenopausal women is a result of estrogen depletion. RaNEFA, when corrected for fat mass, was significantly lower with increasing abdominal obesity, in agreement with the concept of downregulated adipose tissue FA trafficking in obesity with reduced expression of lipolytic genes such as hormone‐sensitive lipase and adipose triglyceride lipase.44 The relationship between obesity, insulin resistance, and lipolysis is not clear in the literature and has been elegantly reviewed.45 At a whole body level, lipolysis was similar in lean and abdominally obese groups, but the contribution of systemic FA to increased VLDL1‐TG was significantly higher in abdominally obese women, as was the contribution of nonsystemic FA, with a tendency toward increased de novo hepatic FA secretion indicating an upregulation of secretion of FA from all sources. Higher secretion of de novo palmitate has previously been found in obese hypertriglyceridemic men compared with lean normolipidemic men and women.46 Our findings of inverse correlations between plasma 3OHB and %DNL in VLDL1‐TG are in agreement with studies in healthy men and women.47 Moreover, we found strong inverse correlations between the isotopic desaturation index in VLDL1‐ and VLDL2‐TG and plasma 3OHB in the whole cohort. These 2 variables are not obviously related but provide the first evidence of a clear divergence of FA partitioning in humans in vivo such that hepatic desaturation of FAs was low when FA oxidation was high (and vice versa).
Serum cortisol concentrations were negatively correlated with waist‐to‐hip ratio in pre‐ but not postmenopausal women. Cortisol status has previously been inversely related to waist‐to‐hip ratio in women, although menopause status was not defined; this has been explained by a higher local clearance rate of cortisol in visceral fat, which has more glucocorticoid receptors than subcutaneous fat.48 However, we found no correlation between serum cortisol concentrations and intra‐abdominal fat area. In agreement with previous studies of aging,49 serum cortisol concentrations were higher in postmenopausal women.
Strengths of our study include the unique combination of kinetic and anthropometric measurements in large groups of well‐matched women, but a limitation is the cross‐sectional design. Therefore, we cannot ascribe causality to any of the correlations found. Postmenopausal women were older and therefore any effects of “menopausal status” do not reflect a difference in hormone concentrations, but rather the natural course of events (menopause plus aging with accompanying changes in body fat distribution). Indeed, postmenopausal women had equal abdominal obesity but higher intra‐abdominal fat and less gynoid fat, demonstrating a change in body fat distribution.4 Given the importance of estrogen in determining body fat distribution and direct effects on lipid metabolism, it may have been insightful to measure serum estrogen concentrations, although it is clear that many factors beyond sex hormones contribute to lipid and lipoprotein metabolism.50 The study design meant that we were able to look at correlations within each menopausal group. We also analyzed our data according to liver fat and we found that overall, the results were similar to when we divided according to abdominal obesity. This is in contrast to findings in individuals with a large range of liver fat,32 where liver fat was found to be more discriminatory. However, we found that abdominal obesity in women was more related to impaired VLDL‐TG secretion than liver fat. This suggests that other intrahepatic factors are contributing to VLDL‐TG secretion.
We did not include a comparator group of men, but other groups have compared lipoprotein metabolism in men and women.50 One study found that VLDL‐TG secretion rate was significantly higher in pre‐menopausal women than men,31 whereas another found that VLDL2‐TG but not VLDL1‐TG secretion rate was higher in post‐menopausal women than men.24 We have previously reported no difference in the postprandial contribution of dietary and nonsystemic FA to VLDL‐TG between insulin‐sensitive men and women.13 However, lipoprotein metabolism is dependent on a many factors, and accumulation of excess body fat seems to affect lipid kinetics differently in men and women as recently discussed.50 Total body fat and body fat distribution are obvious differences between men and women, and this study has highlighted the importance of body fat distribution in women.
Conclusions
VLDL1 and VLDL2 metabolism is complex in women, and hive plots illustrate that the patterns of associations with metabolic variables are different between menopausal groups. A lack of significant correlation between hepatic VLDL2‐TG and VLDL2‐apoB production in post‐menopausal women is intriguing and requires further study. Abdominal obesity was characterized by increased cardiovascular disease risk factors such as VLDL1‐TG and ‐apoB production, liver fat, and non‐HDL cholesterol. Interestingly, this was observed despite a considerable overlap in BMI between abdominally lean and abdominally obese groups. Our study is the first to report that VLDL1‐TG secretion is significantly higher in abdominally obese women and accounts for increased plasma VLDL1‐TG and plasma TG concentrations. This is important because there is increasing evidence that there is a causal relationship between TG‐mediated pathways and coronary heart disease.51 Weight gain in postmenopausal women is likely to impact on both VLDL1‐TG and VLDL2‐TG secretory pathways with consequent implications for cardiovascular disease risk.
Sources of Funding
The study was funded by the British Heart Foundation (Project Grant PG/09/003) and Hodson is a British Heart Foundation Intermediate Fellow in Basic Science (FS/11/18/28633). The British Heart Foundation had no role in the design, analysis, or writing of this article. Marinou was funded by the European Commission under the Marie Curie Programme (FP7‐PEOPLE‐2011‐IEF). The contents reflect only the author's views and not the views of the European Commission. ApoC‐III kinetics were funded by a grant from the National Heart Foundation of Australia (G 11P 5739). PHRB is a senior research fellow of the National Health and Medical Research Council (NHMRC) of Australia. Chan is a career development fellow of the NHMRC.
Disclosures
None.
Supporting information
Table S1. Correlation Coefficients (r s) for Premenopausal Women—Correlations Between Variables Relating to VLDL1 Metabolism
Table S2. Correlation Coefficients (r s) for Premenopausal Women—Correlations Between Variables Relating to VLDL2 Metabolism
Table S3. Correlation Coefficients (r s) for Postmenopausal Women—Correlations Between Variables Relating to VLDL1 Metabolism
Table S4. Correlation Coefficients (r s) for Postmenopausal Women—Correlations Between Variables Relating to VLDL2 Metabolism
Table S5. Biochemical and Metabolic Variables in Women According to Abdominal Obesity and Liver Fat
Table S6. Kinetic Estimates Relating to NEFA, VLDL, and apoC‐III Metabolism in Women According to Abdominal Obesity and Liver Fat
Table S7. Variables Relating to Fatty Acid Metabolism in Women According to Abdominal Obesity and Liver Fat
Figure S1. Mean tracer: trace ratio for glycerol stable isotope enrichment used to model VLDL‐TG kinetics (n=58, mean±SEM, filled circles represent VLDL1‐TG, open circles represent VLDL2‐TG).
Figure S2. Mean percent enrichment for leucine stable isotope enrichment used to model VLDL‐apoB100 kinetics (n=59, mean±SEM, filled circles represent VLDL1‐TG, open circles represent VLDL2‐TG).
Figure S3. Overview of hepatic fatty acid trafficking according to abdominal obesity and menopausal status in healthy women.
Acknowledgments
Thanks to Jane Cheeseman, Louise Dennis, Marjorie Gilbert, Pauline Sutton, Catriona McNeil, Sandy Humphreys, Keith Frayn for help, and Costas Christodoulides who was the duty clinician. We also thank the enthusiastic participants.
(J Am Heart Assoc. 2015;4:e002258 doi: 10.1161/JAHA.115.002258)
Accompanying Tables S1 through S7 and Figures S1 through S3 are available at http://jaha.ahajournals.org/content/4/9/e002258/suppl/DC1
References
- 1. Ng MK. New perspectives on Mars and Venus: unravelling the role of androgens in gender differences in cardiovascular biology and disease. Heart Lung Circ. 2007;16:185–192. [DOI] [PubMed] [Google Scholar]
- 2. Pasquali R, Vicennati V, Bertazzo D, Casimirri F, Pascal G, Tortelli O, Labate AM. Determinants of sex hormone‐binding globulin blood concentrations in premenopausal and postmenopausal women with different estrogen status. Virgilio‐Menopause‐Health Group. Metabolism. 1997;46:5–9. [DOI] [PubMed] [Google Scholar]
- 3. Carr MC. The emergence of the metabolic syndrome with menopause. J Clin Endocrinol Metab. 2003;88:2404–2411. [DOI] [PubMed] [Google Scholar]
- 4. Pou KM, Massaro JM, Hoffmann U, Lieb K, Vasan RS, O'Donnell CJ, Fox CS. Patterns of abdominal fat distribution: the Framingham Heart Study. Diabetes Care. 2009;32:481–485. [DOI] [PMC free article] [PubMed] [Google Scholar]
- 5. Kotronen A, Westerbacka J, Bergholm R, Pietilainen KH, Yki‐Jarvinen H. Liver fat in the metabolic syndrome. J Clin Endocrinol Metab. 2007;92:3490–3497. [DOI] [PubMed] [Google Scholar]
- 6. Chan DC, Watts GF, Redgrave TG, Mori TA, Barrett PH. Apolipoprotein B‐100 kinetics in visceral obesity: associations with plasma apolipoprotein C‐III concentration. Metabolism. 2002;51:1041–1046. [DOI] [PubMed] [Google Scholar]
- 7. Zheng C, Khoo C, Furtado J, Sacks FM. Apolipoprotein C‐III and the metabolic basis for hypertriglyceridemia and the dense low‐density lipoprotein phenotype. Circulation. 2010;121:1722–1734. [DOI] [PMC free article] [PubMed] [Google Scholar]
- 8. Meigs JB, Wilson PW, Nathan DM, D'Agostino RB Sr, Williams K, Haffner SM. Prevalence and characteristics of the metabolic syndrome in the San Antonio Heart and Framingham Offspring Studies. Diabetes. 2003;52:2160–2167. [DOI] [PubMed] [Google Scholar]
- 9. Karpe F, Bell M, Bjorkegren J, Hamsten A. Quantification of postprandial triglyceride‐rich lipoproteins in healthy men by retinyl ester labeling and simultaneous measurement of apolipoproteins B‐48 and B‐100. Arterioscler Thromb Vasc Biol. 1995;15:199–207. [DOI] [PubMed] [Google Scholar]
- 10. Adiels M, Olofsson SO, Taskinen MR, Boren J. Overproduction of very low‐density lipoproteins is the hallmark of the dyslipidemia in the metabolic syndrome. Arterioscler Thromb Vasc Biol. 2008;28:1225–1236. [DOI] [PubMed] [Google Scholar]
- 11. Adiels M, Taskinen MR, Packard C, Caslake MJ, Soro‐Paavonen A, Westerbacka J, Vehkavaara S, Hakkinen A, Olofsson SO, Yki‐Jarvinen H, Boren J. Overproduction of large VLDL particles is driven by increased liver fat content in man. Diabetologia. 2006;49:755–765. [DOI] [PubMed] [Google Scholar]
- 12. Vice E, Privette JD, Hickner RC, Barakat HA. Ketone body metabolism in lean and obese women. Metabolism. 2005;54:1542–1545. [DOI] [PubMed] [Google Scholar]
- 13. Hodson L, Bickerton AS, McQuaid SE, Roberts R, Karpe F, Frayn KN, Fielding BA. The contribution of splanchnic fat to VLDL triglyceride is greater in insulin‐resistant than insulin‐sensitive men and women: studies in the postprandial state. Diabetes. 2007;56:2433–2441. [DOI] [PubMed] [Google Scholar]
- 14. Hodson L, McQuaid SE, Humphreys SM, Milne R, Fielding BA, Frayn KN, Karpe F. Greater dietary fat oxidation in obese compared with lean men: an adaptive mechanism to prevent liver fat accumulation? Am J Physiol Endocrinol Metab. 2010;299:E584–E592. [DOI] [PMC free article] [PubMed] [Google Scholar]
- 15. Hodson L, Harnden K, Banerjee R, Real B, Marinou K, Karpe F, Fielding BA. Lower resting and total energy expenditure in post‐menopausal compared with pre‐menopausal women matched for abdominal obesity. J Nutr Sci. 2014;3:9. [DOI] [PMC free article] [PubMed] [Google Scholar]
- 16. Alberti KG, Zimmet P, Shaw J. The metabolic syndrome—a new worldwide definition. Lancet. 2005;366:1059–1062. [DOI] [PubMed] [Google Scholar]
- 17. British Heart Foundation . Available at: http://www.bhf.org.uk/. Accessed April 1, 2007.
- 18. Banerjee R, Pavlides M, Tunnicliffe EM, Piechnik SK, Sarania N, Philips R, Collier JD, Booth JC, Schneider JE, Wang LM, Delaney DW, Fleming KA, Robson MD, Barnes E, Neubauer S. Multiparametric magnetic resonance for the non‐invasive diagnosis of liver disease. J Hepatol. 2014;60:69–77. [DOI] [PMC free article] [PubMed] [Google Scholar]
- 19. Diraison F, Pachiaudi C, Beylot M. Measuring lipogenesis and cholesterol synthesis in humans with deuterated water: use of simple gas chromatographic/mass spectrometric techniques. J Mass Spectrom. 1997;32:81–86. [DOI] [PubMed] [Google Scholar]
- 20. Marinou K, Adiels M, Hodson L, Frayn KN, Karpe F, Fielding BA. Young women partition fatty acids towards ketone body production rather than VLDL‐TAG synthesis, compared with young men. Br J Nutr. 2011;105:857–865. [DOI] [PubMed] [Google Scholar]
- 21. Matthews DR, Hosker JP, Rudenski AS, Naylor BA, Treacher DF, Turner RC. Homeostasis model assessment: insulin resistance and beta‐cell function from fasting plasma glucose and insulin concentrations in man. Diabetologia. 1985;28:412–419. [DOI] [PubMed] [Google Scholar]
- 22. O'Reilly MW, Taylor AE, Crabtree NJ, Hughes BA, Capper F, Crowley RK, Stewart PM, Tomlinson JW, Arlt W. Hyperandrogenemia predicts metabolic phenotype in polycystic ovary syndrome: the utility of serum androstenedione. J Clin Endocrinol Metab. 2014;99:1027–1036. [DOI] [PMC free article] [PubMed] [Google Scholar]
- 23. Adiels M, Packard C, Caslake MJ, Stewart P, Soro A, Westerbacka J, Wennberg B, Olofsson SO, Taskinen MR, Boren J. A new combined multicompartmental model for apolipoprotein B‐100 and triglyceride metabolism in VLDL subfractions. J Lipid Res. 2005;46:58–67. [DOI] [PubMed] [Google Scholar]
- 24. Sarac I, Backhouse K, Shojaee‐Moradie F, Stolinski M, Robertson MD, Bell JD, Thomas EL, Hovorka R, Wright J, Umpleby AM. Gender differences in VLDL1 and VLDL2 triglyceride kinetics and fatty acid kinetics in obese postmenopausal women and obese men. J Clin Endocrinol Metab. 2012;97:2475–2481. [DOI] [PubMed] [Google Scholar]
- 25. Chan DC, Nguyen MN, Watts GF, Barrett PH. Plasma apolipoprotein C‐III transport in centrally obese men: associations with very low‐density lipoprotein apolipoprotein B and high‐density lipoprotein apolipoprotein A‐I metabolism. J Clin Endocrinol Metab. 2008;93:557–564. [DOI] [PMC free article] [PubMed] [Google Scholar]
- 26. Hodson L, Fielding BA. Stearoyl‐CoA desaturase: rogue or innocent bystander? Prog Lipid Res. 2013;52:15–42. [DOI] [PubMed] [Google Scholar]
- 27. Semple RK, Sleigh A, Murgatroyd PR, Adams CA, Bluck L, Jackson S, Vottero A, Kanabar D, Charlton‐Menys V, Durrington P, Soos MA, Carpenter TA, Lomas DJ, Cochran EK, Gorden P, O'Rahilly S, Savage DB. Postreceptor insulin resistance contributes to human dyslipidemia and hepatic steatosis. J Clin Invest. 2009;119:315–322. [DOI] [PMC free article] [PubMed] [Google Scholar]
- 28. Moore JB, Gunn PJ, Fielding BA. The role of dietary sugars and de novo lipogenesis in non‐alcoholic fatty liver disease. Nutrients. 2014;6:5679–5703. [DOI] [PMC free article] [PubMed] [Google Scholar]
- 29. Krzywinski M, Birol I, Jones SJ, Marra MA. Hive plots—rational approach to visualizing networks. Brief Bioinform. 2012;13:627–644. [DOI] [PubMed] [Google Scholar]
- 30. Magkos F, Patterson BW, Mittendorfer B. Reproducibility of stable isotope‐labeled tracer measures of VLDL‐triglyceride and VLDL‐apolipoprotein B‐100 kinetics. J Lipid Res. 2007;48:1204–1211. [DOI] [PubMed] [Google Scholar]
- 31. Magkos F, Patterson BW, Mohammed BS, Klein S, Mittendorfer B. Women produce fewer but triglyceride‐richer very low‐density lipoproteins than men. J Clin Endocrinol Metab. 2007;92:1311–1318. [DOI] [PubMed] [Google Scholar]
- 32. Fabbrini E, Magkos F, Mohammed BS, Pietka T, Abumrad NA, Patterson BW, Okunade A, Klein S. Intrahepatic fat, not visceral fat, is linked with metabolic complications of obesity. Proc Natl Acad Sci USA. 2009;106:15430–15435. [DOI] [PMC free article] [PubMed] [Google Scholar]
- 33. Nielsen S, Karpe F. Determinants of VLDL‐triglycerides production. Curr Opin Lipidol. 2012;23:321–326. [DOI] [PubMed] [Google Scholar]
- 34. Gill JM, Brown JC, Bedford D, Wright DM, Cooney J, Hughes DA, Packard CJ, Caslake MJ. Hepatic production of VLDL1 but not VLDL2 is related to insulin resistance in normoglycaemic middle‐aged subjects. Atherosclerosis. 2004;176:49–56. [DOI] [PubMed] [Google Scholar]
- 35. Mittendorfer B, Patterson BW, Klein S. Effect of weight loss on VLDL‐triglyceride and apoB‐100 kinetics in women with abdominal obesity. Am J Physiol Endocrinol Metab. 2003;284:E549–E556. [DOI] [PubMed] [Google Scholar]
- 36. Mittendorfer B, Patterson BW, Klein S, Sidossis LS. VLDL‐triglyceride kinetics during hyperglycemia‐hyperinsulinemia: effects of sex and obesity. Am J Physiol Endocrinol Metab. 2003;284:E708–E715. [DOI] [PubMed] [Google Scholar]
- 37. Gormsen LC, Nellemann B, Sorensen LP, Jensen MD, Christiansen JS, Nielsen S. Impact of body composition on very‐low‐density lipoprotein‐triglycerides kinetics. Am J Physiol Endocrinol Metab. 2009;296:E165–E173. [DOI] [PubMed] [Google Scholar]
- 38. Nordestgaard BG, Tybjaerg‐Hansen A. IDL, VLDL, chylomicrons and atherosclerosis. Eur J Epidemiol. 1992;8(suppl 1):92–98. [DOI] [PubMed] [Google Scholar]
- 39. Gaw A, Packard CJ, Lindsay GM, Griffin BA, Caslake MJ, Lorimer AR, Shepherd J. Overproduction of small very low density lipoproteins (Sf 20‐60) in moderate hypercholesterolemia: relationships between apolipoprotein B kinetics and plasma lipoproteins. J Lipid Res. 1995;36:158–171. [PubMed] [Google Scholar]
- 40. Mittendorfer B, Patterson BW, Klein S. Effect of sex and obesity on basal VLDL‐triacylglycerol kinetics. Am J Clin Nutr. 2003;77:573–579. [DOI] [PubMed] [Google Scholar]
- 41. Smith GI, Reeds DN, Okunade AL, Patterson BW, Mittendorfer B. Systemic delivery of estradiol, but not testosterone or progesterone, alters VLDL‐triglyceride kinetics in postmenopausal women. J Clin Endocrinol Metab. 2014;99:E1306–E1310. [DOI] [PMC free article] [PubMed] [Google Scholar]
- 42. Matthews KA, Crawford SL, Chae CU, Everson‐Rose SA, Sowers MF, Sternfeld B, Sutton‐Tyrrell K. Are changes in cardiovascular disease risk factors in midlife women due to chronological aging or to the menopausal transition? J Am Coll Cardiol. 2009;54:2366–2373. [DOI] [PMC free article] [PubMed] [Google Scholar]
- 43. Jensen MD, Martin ML, Cryer PE, Roust LR. Effects of estrogen on free fatty acid metabolism in humans. Am J Physiol. 1994;266:E914–E920. [DOI] [PubMed] [Google Scholar]
- 44. McQuaid SE, Hodson L, Neville MJ, Dennis AL, Cheeseman J, Humphreys SM, Ruge T, Gilbert M, Fielding BA, Frayn KN, Karpe F. Downregulation of adipose tissue fatty acid trafficking in obesity: a driver for ectopic fat deposition? Diabetes. 2011;60:47–55. [DOI] [PMC free article] [PubMed] [Google Scholar]
- 45. Karpe F, Dickmann JR, Frayn KN. Fatty acids, obesity, and insulin resistance: time for a reevaluation. Diabetes. 2011;60:2441–2449. [DOI] [PMC free article] [PubMed] [Google Scholar]
- 46. Vedala A, Wang W, Neese RA, Christiansen MP, Hellerstein MK. Delayed secretory pathway contributions to VLDL‐triglycerides from plasma NEFA, diet, and de novo lipogenesis in humans. J Lipid Res. 2006;47:2562–2574. [DOI] [PubMed] [Google Scholar]
- 47. Matikainen N, Adiels M, Soderlund S, Stennabb S, Ahola T, Hakkarainen A, Boren J, Taskinen MR. Hepatic lipogenesis and a marker of hepatic lipid oxidation, predict postprandial responses of triglyceride‐rich lipoproteins. Obesity (Silver Spring). 2014;22:1854–1859. [DOI] [PubMed] [Google Scholar]
- 48. Pedersen SB, Jonler M, Richelsen B. Characterization of regional and gender differences in glucocorticoid receptors and lipoprotein lipase activity in human adipose tissue. J Clin Endocrinol Metab. 1994;78:1354–1359. [DOI] [PubMed] [Google Scholar]
- 49. Larsson CA, Gullberg B, Rastam L, Lindblad U. Salivary cortisol differs with age and sex and shows inverse associations with WHR in Swedish women: a cross‐sectional study. BMC Endocr Disord. 2009;9:16. [DOI] [PMC free article] [PubMed] [Google Scholar]
- 50. Wang X, Magkos F, Mittendorfer B. Sex differences in lipid and lipoprotein metabolism: it's not just about sex hormones. J Clin Endocrinol Metab. 2011;96:885–893. [DOI] [PMC free article] [PubMed] [Google Scholar]
- 51. Sarwar N, Sandhu MS, Ricketts SL, Butterworth AS, Di Angelantonio E, Boekholdt SM, Ouwehand W, Watkins H, Samani NJ, Saleheen D, Lawlor D, Reilly MP, Hingorani AD, Talmud PJ, Danesh J. Triglyceride‐mediated pathways and coronary disease: collaborative analysis of 101 studies. Lancet. 2010;375:1634–1639. [DOI] [PMC free article] [PubMed] [Google Scholar]
Associated Data
This section collects any data citations, data availability statements, or supplementary materials included in this article.
Supplementary Materials
Table S1. Correlation Coefficients (r s) for Premenopausal Women—Correlations Between Variables Relating to VLDL1 Metabolism
Table S2. Correlation Coefficients (r s) for Premenopausal Women—Correlations Between Variables Relating to VLDL2 Metabolism
Table S3. Correlation Coefficients (r s) for Postmenopausal Women—Correlations Between Variables Relating to VLDL1 Metabolism
Table S4. Correlation Coefficients (r s) for Postmenopausal Women—Correlations Between Variables Relating to VLDL2 Metabolism
Table S5. Biochemical and Metabolic Variables in Women According to Abdominal Obesity and Liver Fat
Table S6. Kinetic Estimates Relating to NEFA, VLDL, and apoC‐III Metabolism in Women According to Abdominal Obesity and Liver Fat
Table S7. Variables Relating to Fatty Acid Metabolism in Women According to Abdominal Obesity and Liver Fat
Figure S1. Mean tracer: trace ratio for glycerol stable isotope enrichment used to model VLDL‐TG kinetics (n=58, mean±SEM, filled circles represent VLDL1‐TG, open circles represent VLDL2‐TG).
Figure S2. Mean percent enrichment for leucine stable isotope enrichment used to model VLDL‐apoB100 kinetics (n=59, mean±SEM, filled circles represent VLDL1‐TG, open circles represent VLDL2‐TG).
Figure S3. Overview of hepatic fatty acid trafficking according to abdominal obesity and menopausal status in healthy women.