

Abstract
The pharmacokinetic (PK) behavior of monoclonal antibodies in cynomolgus monkeys (cynos) is generally translatable to that in humans. Unfortunately, about 39% of the antibodies evaluated for PKs in cynos have fast nonspecific (or non-target-mediated) clearance (in-house data). An empirical model relating variable region (Fv) charge and hydrophobicity to cyno nonspecific clearance was developed to gauge the risk an antibody would have for fast nonspecific clearance in the monkey. The purpose of this study was to evaluate the predictability of this empirical model on cyno nonspecific clearance with antibodies specifically engineered to have either high or low Fv charge. These amino acid changes were made in the Fv region of two test antibodies, humAb4D5-8 and anti-lymphotoxin α. The humAb4D5-8 has a typical nonspecific clearance in cynos, and by making it more positively charged, the antibody acquires fast nonspecific clearance, and making it less positively charged did not impact its clearance. Anti-lymphotoxin α has fast nonspecific clearance in cynos, and making it more positively charged caused it to clear even faster, whereas making it less positively charged caused it to clear slower and within the typical range. These trends in clearance were also observed in two other preclinical species, mice and rats. The effect of modifying Fv charge on subcutaneous bioavailability was also examined, and in general bioavailability was inversely related to the direction of the Fv charge change. Thus, modifying Fv charge appears to impact antibody PKs, and the changes tended to correlate with those predicted by the empirical model.
Keywords: antibody, antibody engineering, homology modeling, mutant, pharmacokinetics, charge, clearance
Introduction
Hundreds of monoclonal antibody (mAb) therapeutics have been evaluated in clinical trials as potential life-saving therapeutics, yet only about 30 are approved for use in the United States and/or Europe, and they span therapeutic areas such as oncology, ophthalmology, viral infections, and autoimmune disease (1). These therapeutics fail for four main reasons, including lack of efficacy, safety, business, and others (2). As such, there is an effort to conduct appropriate preclinical studies to reduce the chances of failure as much as possible in the clinic. The focus of this paper is on efforts to lower the risk of fast antibody pharmacokinetics.
Factors that affect antibody pharmacokinetics (PK)2 include antibody-specific properties (charge, hydrophobicity, target affinity, FcRn affinity, Fcγ receptor interactions, and glycosylation) (3), target properties (expression level, turnover rate, and soluble versus membrane-associated) (4, 5), drug administration (dose and route) (3, 6), anti-therapeutic antibody formation (6, 7), off-target/nonspecific binding (8–12), and disease state (healthy volunteers versus patients) (13). Given the many factors that could affect the PK of therapeutic antibodies, finding a representative preclinical species in which to assess PK is imperative. An in-depth analysis of 23 monoclonal antibodies with linear PK and six with non-linear PK from three preclinical species yielded the conclusion that cynomolgus monkeys (cynos) are reliable for human PK predictions (14, 15). Therefore, PK characterization in cynos is a key step in the therapeutic mAb development process.
Approximately 39% of the bivalent antibodies evaluated for PK in cynos (in-house data, n = 118) have fast nonspecific clearance, >8 ml/day/kg. A cutoff of 8 ml/day/kg was determined following a population analysis of cyno PK data from 25 antibodies, which indicated that antibodies that had acceptable kinetics in the clinic had a nonspecific clearance below 8 ml/day/kg in the cyno, with only one antibody, MNRP1685A, being an outlier.3 One method to reduce the number of antibodies with fast nonspecific clearance (CL) is to screen antibodies for general nonspecific binding using a baculovirus (BV) binding assay (16). Although this assay can help mitigate the risk of fast nonspecific clearance, it does not identify all antibodies that display fast nonspecific clearance. Indeed, with a false negative rate of about 10%, additional tools are necessary to further minimize the risk of fast nonspecific clearance.
More recently, we have shown that an empirical model based on in silico calculations of variable region (Fv) charge and hydrophobicity may have utility for risk assessment (17). Briefly, the model calculates the charge of the Fv region at pH 5.5 and the hydrophobicity (using the Eisenberg scale) of the CDRs in the L1, L3, and H3 domains. Antibodies that have an Fv charge between 0 and 6.2 tended to have acceptable nonspecific CL in the monkey (CL <8 ml/day/kg), although antibodies with Fv charge outside that range tended to clear faster. Similarly, antibodies with an Fv hydrophobicity sum of >5.2 (of select CDRs) tended to clear fast, whereas those with lower Fv hydrophobicity sum values had acceptable nonspecific CL. There has been some evidence in the literature indicating the antibody isoelectric point (pI) (18–22) and even Fv pI (16, 23, 24) can impact PK; however, the model evaluated in this study attempts to establish a range of Fv charges that may lower the risk of fast nonspecific CL in cynos.
Development of the empirical model was based on a retrospective analysis of a collection of bivalent antibodies differing in many properties rather than the result of a designed experiment. Therefore, we wanted to evaluate the predictions of the model with more systematic studies. Here, we have tested the Fv charge portion of the model through studies with designed variants of two antibodies, anti-lymphotoxin α (anti-LTα) (25) and humAb4D5-8 (anti-HER2) (26). The humAb4D5-8 has an Fv charge within the acceptable range and acceptable cyno nonspecific CL, whereas anti-LTα has an Fv charge outside the acceptable range and fast nonspecific CL in cynos. Both antibodies are calculated to have low Fv hydrophobicity. Two variants were made for each antibody as follows: one that had a more positively charged Fv than the parental antibody and one had a less positively charged Fv. Our hypothesis is that the higher positive charge would lead to faster nonspecific CL through increased nonspecific binding, perhaps due to greater electrostatic interactions with the negatively charged extracellular matrix (27, 28), whereas the lower positive charge would lead to decreased nonspecific binding and slower nonspecific CL. From the prediction of the model, the anti-LTα variant with reduced positive charge should clear within the acceptable range (nonspecific CL <8 ml/day/kg). The PK for the parental antibodies and their Fv charge variants were assessed in cynos following i.v. and s.c. administration. Similar studies were conducted in mice and rats to determine whether similar PK trends would be observed across species. Our results with both anti-LTα and humAb4D5-8 support the predictions based on the in silico model.
Experimental Procedures
Production and Characterization of Antibody Variants
Crystal structures of anti-LTα:LTα (Protein Data Bank code 4MXV) (29) and humAb4D5-8:HER2 (Protein Data Bank code 1N8Z) (30) were examined using MacPyMOL (Schrödinger, Inc.). In addition to selection criteria of non-antigen contact and side chain solvent accessibility, high variability in the Kabat database (31) was used to choose sites for substitution. Amino acid substitutions were modeled onto antibody structures, and electrostatic surfaces were calculated using vacuum electrostatics setting of MacPyMOL. Oligonucleotide-directed mutagenesis was used to incorporate amino acid sequence changes following the protocol described in Kelley and Meng (32). Antibody variants were transiently expressed in CHO cells and purified using immunoaffinity chromatography as described previously (33). Antibody pI values were determined using imaged capillary isoelectric focusing as described in Li et al. (34).
Binding Affinity Characterization
All kinetic experiments were performed with a BIAcore T200 instrument. For the kinetic measurement of humAb4D5-8 and its variants binding to Her2 as well as anti-LTα and its variants to LTα1β2, an anti-human Fc-capture antibody was immobilized onto a series S CM5 sensor chip. Antibodies were sequentially flowed over flow cells 2–4 to allow capture of IgG to 50–150 resonance units, after which antigens were flowed over the immobilized IgGs (30 μl/min for 5 min) to measure the binding response using flow cell 1 for reference subtraction. To measure the kinetics for KD determination, a 5-point dilution series (1.23–100 nm) of Her2 or a 9-point dilution series (0.076–500 nm) of LTα1β2 were measured for binding to corresponding captured IgGs, respectively, as described above and fit to a simple 1:1 binding model in the BIAevaluation software.
BV ELISA
The assay was performed as described previously (16). Briefly, BV particles were coated on 384-well ELISA plates at a 1% suspension. The plates were then blocked with PBS/BSA and test antibodies were added to the plates for an hour. Bound antibodies were detected with goat anti-human IgG conjugated to horseradish peroxidase (Jackson ImmunoResearch), followed by the addition of tetramethylbenzidine substrate and 1 m phosphoric acid. The absorbance was read at 450 nm and referenced at 620 nm. A value of >1 in the assay suggests that an antibody is at greater risk for fast clearance in the monkey.
Anti-LTα in Vitro Cell Potency Characterization
Functional blocking of NF-κB reporter assays was performed as described previously (29). Briefly, HeLa cells stably expressing the NF-κB-luciferase reporter construct were preincubated with antibody variants from 30 min at 37 °C and then stimulated with 200 ng/ml LTα3 or LTα1β2. Cells were lysed 6 h later, and luciferase activity was measured using the Promega Luciferase Assay System, with luminescence read using EnVision (PerkinElmer Life Sciences).
FcRn Binding Affinity
Affinity for soluble human FcRn was determined by surface plasmon resonance measurements on a BIAcore T200 (GE Healthcare) instrument as described previously (34).
Pharmacokinetics in Cynomolgus Monkeys
The animal protocol was approved by the IACUC of Charles River Laboratories (Reno, NV). Forty eight experimentally naive cynomolgus monkeys weighing between 3 and 5 kg (Macaca fascicularis, Chinese origin) were used for this study and were assigned to 1 of 12 groups based on test article and administration route assignment as presented in Table 1. Blood was collected via the femoral vein into serum separator tubes at the following time points post-dose: 15 min, 8 h, and 1, 3, 7, 14, 21, 28, and 35 days. The blood samples were allowed to clot for 20 min at room temperature and then centrifuged at 2000 × g for 10 min at 4 °C. The serum samples were separated from the blood clot and stored frozen at −80 °C until analysis.
TABLE 1.
Design of the cyno PK study
| Group | Test article | Dose route | n (male/female) | Dose |
|---|---|---|---|---|
| mg/kg | ||||
| 1 | HumAb4D5-8 parental | i.v. | 2/2 | 10 |
| 2 | HumAb4D5-8 parental | s.c. (scapular) | 2/2 | 10 |
| 3 | HumAb4D5-8 + 5 | i.v. | 2/2 | 10 |
| 4 | HumAb4D5-8 + 5 | s.c. (scapular) | 2/2 | 10 |
| 5 | HumAb4D5-8 − 4 | i.v. | 2/2 | 10 |
| 6 | HumAb4D5-8 − 4 | s.c. (scapular) | 2/2 | 10 |
| 7 | Anti-LTα parental | i.v. | 2/2 | 10 |
| 8 | Anti-LTα parental | s.c. (scapular) | 2/2 | 10 |
| 9 | Anti-LTα +3 | i.v. | 2/2 | 10 |
| 10 | Anti-LTα +3 | s.c. (scapular) | 2/2 | 10 |
| 11 | Anti-LTα −4 | i.v. | 2/2 | 10 |
| 12 | Anti-LTα −4 | s.c. (scapular) | 2/2 | 10 |
Pharmacokinetics in Rats and Mice
All animal protocols were approved by the IACUC of Genentech, Inc., and were conducted in accordance with the National Institutes of Health's Guide for the Care and Use of Laboratory Animals. Thirty-six experimentally naive female Sprague-Dawley rats weighing ∼250 g or 108 experimentally naive female C57BL/6 mice weighing ∼20 g were assigned to 1 of 12 groups, in a design identical to that of the cyno study. All animals receive a single 10 mg/kg dose of their respective dose solutions via either IV or s.c.. Blood (n = 3 per time point) was collected via the tail vein for the rats and retro-orbital for the mice into serum separator tubes at the following time points post-dose: 15 min, 1 and 6 h, and 1, 3, 7, 14, 21, and 28 days. The rats were serially sampled, whereas the mice were sparse sampled utilizing three sample groups rotating at each collection time point. The blood samples were allowed to clot for 30 min at room temperature and then centrifuged at 2000 × g for 10 min at 4 °C. The serum samples were separated from the blood clot and stored frozen at −80 °C until analysis.
Total Antibody ELISA
Total antibody concentrations in cynomolgus monkey, rat, and mouse serum were measured with an ELISA using the Gyros technology platform (Gyros US Inc., Warren, NJ) and a generic PK assay. This assay uses biotin-sheep anti-human IgG antibody as capture and Alexa Fluor® 647-conjugated sheep anti-human IgG as detection. The minimum dilution for this assay was 1:10. The assay has a standard curve range of 0.03–30 μg/ml for cynomolgus monkey and mouse serum and a range of 0.1–30 μg/ml for rat serum.
PK Parameter Estimation
PK parameters were estimated using SimBiology®, version 4.3.1 (The Mathworks®, Inc., Natick, MA). A two-compartment model with a depot for the s.c. space and parallel nonspecific and specific clearance combined with naive pooling the data were used for parameter estimation. The i.v. and s.c. data for each molecule were simultaneously fit to estimate the following PK: t½β (terminal half-life), nonspecific CL, area under the concentration-time curve from time 0 to time of last measurable concentration, as calculated using the linear trapezoidal rule, volume of distribution in the central compartment, bioavailability, ka (absorption constant), tmax (time to maximum serum concentration), and Cmax (maximum serum concentration). The tmax and Cmax values were generated for s.c. administration only. Antibody concentrations below the limit of detection were interpreted as missing for graphical and summary presentations and were not included in any calculations. The nominal dose administered to each group was used for parameter estimation.
Statistical Analysis
Statistical analysis for PK parameters was performed using GraphPad Prism version 6.05 (La Jolla, CA) using a one-way analysis of variance followed by the Dunnett's multiple comparison test.
Results
Design of Mutants
Structures of the anti-LTα·LTα and humAb4D5-8·HER2 complexes (Fig. 1) were examined to identify solvent-accessible, non-antigen-contacting CDR residues that could be candidate positions for substitution without impact on antigen binding. CDR regions were chosen for introduction of Fv charge variation because these are the hypervariable segments and are more tolerant of amino acid change than the framework regions. From this analysis of anti-LTα, positions 28, 52, and 54 of the light chain and 55 and 64 of the heavy chain were selected. Substitutions VL-A28K, S52K, and VH-A55K resulted in a variant with a calculated increase in Fv charge of +3. A variant with a calculated Fv charge change of −4 was created through substitutions VL-A28D, R54S, and VH-A55D, K64Q. Similarly, humAb4D5-8 substitutions VH-D31R, D61Q, S62K, and G65R were used to design a variant with a calculated Fv charge increase of +5. A humAb4D5-8 variant with a calculated Fv charge change of −4 was produced through substitutions VH-N28D, K30S, S62D, and G65D. Substitutions for humAb4D5-8 were all on the heavy chain, CDRs H1 and H2, whereas substitutions for anti-LTα variants were in CDRs L1, L2, and H2. These substitutions expanded electropositive or electronegative patches calculated for the surface of the modeled variants (Fig. 1B).
FIGURE 1.
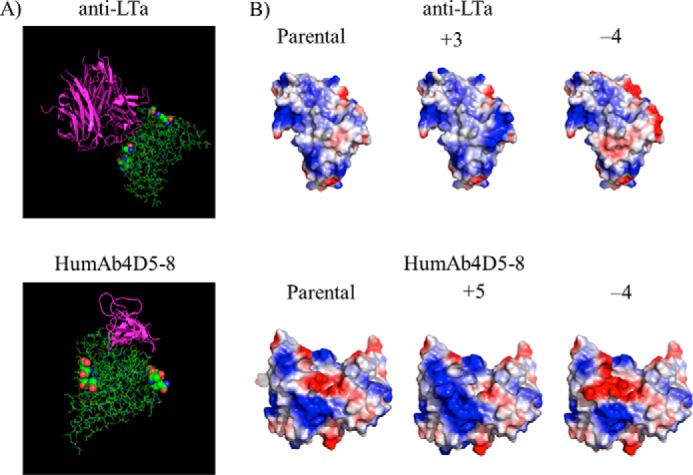
Modeling of charge variants onto crystal structures determined for complexes of anti-LTα·LTα and humAb4D5-8:HER2. A, antibody-antigen structures for anti-LTα (Protein Data Bank code 4MXV) (29) and humAb4D5-8 (Protein Data Bank code 1N8Z) (30) are shown with antigens colored purple and the antibody Fabs in green. The colored spheres show the location of the amino acids that were mutated to alter Fv charge. B, electrostatic surfaces calculated (PyMOL, Shrödinger, Inc.) for Fv portions of modeled charge variants. Positive charge is indicated by blue and negative charge by red.
Mutant Alignment with Fv Charge and Hydrophobicity Model
The sequences of the anti-LTα and humAb4D5-8 mutants were added to the empirical model that had been developed relating Fv charge at pH 5.5 and hydrophobicity to the cyno nonspecific clearance parameter (17) to see where they would align compared with their parental counterparts (Fig. 2). The parental anti-LTα antibody started with an Fv charge of +8.1, which is above the theoretical cutoff of acceptable Fv charge of +6.2 (17). The positive mutant, with a calculated Fv charge of +11.1, was also outside this range, whereas the negative mutant, with a calculated Fv charge of +4.1, was within the range. The parental humAb4D5-8 antibody started with an Fv charge of +6.1, just inside the theoretical acceptable range. The positive mutant, with a calculated Fv charge of +11.1, was outside of this range, whereas the negative mutant, with a calculated Fv charge of +2.2, was within this range. Based on their placement in the model, the antibodies with an Fv charge within the 0–6.2 range are predicted to have a cyno-nonspecific CL of <8 ml/day/kg, whereas those outside that range are predicted to have a cyno-nonspecific CL of >8 ml/day/kg.
FIGURE 2.

In silico model predictions of where the nonspecific CL of the Fv charge variants would fall relative to their parental counterparts. Fv charge was calculated at pH 5.5, and hydrophobicity product was calculated by taking the product of the hydrophobic to hydrophilic amino acid ratios for CDRs L1, L3, and H3, weighted by their respective lengths (17). The anti-LTα variants are shown in A, with the parental antibody at +8.1 Fv charge. The humAb4D5-8 variants are shown in B, with the parental antibody at +6.1 Fv charge.
Antibody Characterization
The parental antibodies and mutant antibodies were characterized for calculated Fv charge, hydrophobicity product, pI, antigen binding affinity, and human FcRn binding affinity (Table 2). The amino acid substitutions produce a large change in charge calculated for the Fv but only a minimal change (<1 pI unit) in pI measured for the whole antibody. The parental antibodies have low calculated hydrophobicity products, and the amino acid substitutions in the variants have a minimal effect on these values. The charge alterations in the Fv region had no significant impact on the antibody's ability to bind to target as the binding affinity values for all mutants were within 2-fold of their parental antibodies. Consistently, the binding kinetics of the mutants to their respective antigens, as determined by BIAcore, were also similar to their parental antibodies (Fig. 3). For anti-LTα, the charge variants did not have an impact on potency measured in a cell-based assay of LTα or LTα1b2 activity (Fig. 4). There was little difference in FcRn binding affinity among the mutants as well. The more positively charged Fv variants for both humAb4D5-8 and anti-LTα, but not the less positively charged Fv variants, show strong binding in the baculovirus assay (16), indicating an increased propensity for nonspecific binding.
TABLE 2.
Antibody characteristics
| Characteristic | Anti-LTαparental | Anti-LTα+3 | Anti-LTα-4 | HumAb4D5-8 parental | HumAb4D5-8 +5 | HumAb4D5-8 −4 |
|---|---|---|---|---|---|---|
| Calculated Fv chargea | +8.1 | +11.1 | +4.1 | +6.1 | +11.1 | +2.2 |
| Measured mAb pI | 9.43 | 9.61 | 9.01 | 9.27 | 9.65 | 8.83 |
| Calculated HI | 3.6 | 3.1 | 3.2 | 2.2 | 2.2 | 2.2 |
| Antigen binding affinity (nm) | 20.8 | 14.1 | 11.1 | 2.4 | 4.2 | 1.0 |
| BV assay score | 0.37 | 2.19 | 0.15 | 0.11 | 1.65 | 0.09 |
| Human FcRn binding affinity (μm)b | 2.0 | 2.2 | 1.3 | 1.5 | 1.5 | 1.4 |
a Charge and pI values were calculated and performed at pH 5.5.
b FcRn binding affinity was determined at pH 5.8. The following abbreviations are used: Fv = variable region of the antibody; mAb = monoclonal antibody; pI = isoelectric point; BV = baculovirus, score determined using methods previously published (16); HI = hydrophobicity product as determined by methods previously published (17).
FIGURE 3.

Antigen binding kinetics of the parental and Fv charge variants as determined by BIAcore. A, binding kinetics of the anti-LTα antibodies was determined for LTα1b2. The kinetics were determined at concentrations between 0.076 and 500 nm. B, binding kinetics of the humAb4D5-8 antibodies was determined for HER2. The kinetics were determined at concentrations between 1.23 and 100 nm. The data were fit to a simple 1:1 binding model in the BIAevaluation software.
FIGURE 4.

Inhibition of TNFR2 and LTβR signaling by parental and Fv charge variants of anti-LTα antibodies. HeLa/NF-βB-luc reporter cells were stimulated with LTα3 (A) or LTα1β2 (B) to induce activation of the NF-βB signaling pathway mediated through TNFR2 or LTβR, respectively. NF-βB activity was measured in relative luciferase units and normalized to luminescence measured in the absence of antibody blockade. Baseline activity in unstimulated cells (diamond) and activity in stimulated cells in absence of blockade (+ symbol) are indicated. Data are shown as mean ± S.D. of duplicate wells from duplicate plates. Data are representative of at least two experiments.
Antibody Pharmacokinetics in Cynomolgus Monkeys, Rats, and Mice
The parental antibodies and their Fv charge mutants were administered as a single 10 mg/kg dose to cynomolgus monkeys, rats, and mice via either intravenous or subcutaneous dosing. In cynos, the preclinical species whose PK is most translatable to human PK (14), striking differences in half-life, nonspecific CL, exposure (area under the concentration-time curve), maximum serum concentration (Cmax), and bioavailability were noted among the variants (Fig. 5). The humAb4D5-8 parental antibody displayed a biphasic concentration-time profile with a nonspecific clearance of 6.22 ± 0.607 ml/day/kg and an s.c. bioavailability of about 72% (Table 3). Increasing the Fv charge by 5 charge units resulted in ∼8-fold faster nonspecific clearance, whereas decreasing the Fv charge by 4 charge units had no impact on nonspecific CL. There was no significant impact on s.c. bioavailability with an increase in Fv charge, but there was a significant increase in s.c. bioavailability when Fv charge was decreased (p < 0.05). The trend in terminal half-life was similar to that for nonspecific CL. The Cmax value following s.c. administration of the parental humAb4D5-8 antibody was 88.0 μg/ml, and an increase in Fv charge resulted in a significant decrease in maximum concentration (16.2 μg/ml), whereas a decrease in Fv charge resulted in a significant increase (118 μg/ml). There were differences in time to maximum concentration (tmax) following s.c. administration, but there was no clear charge-related trend. The impact of modulating Fv charge on the anti-LTα antibodies was more striking. Parental anti-LTα has a nonspecific clearance of 14.9 ml/day/kg and an s.c. bioavailability of 59.9%. Increasing Fv charge by 3 charge units resulted in a 4-fold increase in nonspecific clearance and a 2-fold decrease in s.c. bioavailability, whereas decreasing Fv charge by 4 charge units resulted in 2.5-fold decrease in nonspecific clearance but no significant change in s.c. bioavailability. The terminal half-life for the more positively charged anti-LTα variant was shorter (3.23 days), although not statistically significant, than that of the parental (4.62 days), whereas the terminal half-life for the less positively charged variant was significant longer (7.33 days). The Cmax and tmax values for anti-LTα variants followed the same trends as those observed with the humAb4D5-8 variants. Charge had very little impact on the absorption rate constant (ka) for either set of antibodies.
FIGURE 5.

Concentration-time profiles of the parental antibodies and the Fv charge variants following a single i.v. or s.c. dose at 10 mg/kg to cynos. The parental antibodies are depicted in red, and the more positively charge variants are depicted in blue, and the less positively charge variants are depicted in green. The i.v. dose groups are depicted in A and C for the anti-LTα and humAb4D5-8 antibodies, respectively. The s.c. dose groups are depicted in B and D for the anti-LTα and humAb4D5-8 antibodies, respectively. Each point represents an individual animal (n = 4), and the line represents the average concentration among them.
TABLE 3.
Average (± S.D.) PK parameters following single i.v. or s.c. dose administration at 10 mg/kg in cynos
The following abbreviations are used: t½β = terminal half-life; CL = non-specific clearance; AUC = area under the concentration time curve from time 0 to time of last measurable concentration; V1 = volume of distribution of the central compartment; %F = bioavailability; ka = absorption rate constant; tmax = time to maximum serum concentration; Cmax = maximum serum concentration; i.v. = intravenous; s.c. = subcutaneous.
| Parameter | Anti-LTαparental | Anti-LTα+3 | Anti-LTα−4 | HumAb4D5-8 parental | HumAb4D5-8 +5 | HumAb4D5-8 −4 |
|---|---|---|---|---|---|---|
| t½β day | 4.62 ± 1.09 | 3.23 ± 0.766 | 7.33 ± 0.846 | 7.06 ± 0.917 | 8.50 ± 0.372 | 7.57 ± 2.05 |
| CL ml/day/kg | 14.9 ± 2.53 | 59.3 ± 7.51 | 5.78 ± 0.415 | 6.22 ± 0.607 | 51.1 ± 5.42 | 6.63 ± 0.559 |
| AUC (i.v.) day·μg/ml | 671 ± 114 | 169 ± 21.4 | 1730 ± 124 | 1610 ± 157 | 196 ± 20.8 | 1510 ± 127 |
| V1 ml/kg | 88.1 ± 18.0 | 69.7 ± 14.4 | 50.4 ± 4.57 | 58.7 ± 7.39 | 97.3 ± 20.9 | 66.3 ± 7.33 |
| %F | 59.9 ± 14.3 | 31.4 ± 5.23 | 69.9 ± 7.62 | 71.5 ± 10.2 | 82.7 ± 11.9 | 117 ± 14.5 |
| ka 1/day | 0.970 ± 0.370 | 0.921 ± 0.213 | 1.09 ± 0.204 | 0.555 ± 0.126 | 0.384 ± 0.0916 | 0.454 ± 0.0869 |
| tmax (s.c.) day | 1.00 ± 0 | 0.833 ± 0.333 | 2.50 ± 1.00 | 3.00 ± 0 | 1.50 ± 1.00 | 2.5 ± 1.00 |
| Cmax (s.c.) μg/ml | 55.3 ± 17.8 | 17.0 ± 10.4 | 143 ± 5.52 | 88.0 ± 9.25 | 16.2 ± 4.78 | 118 ± 20.5 |
To determine whether the trend in nonspecific CL and s.c. bioavailability observed in cynos would be conserved across other preclinical species, we also evaluated the PK of these antibodies in mice and rats. As presented in Fig. 6 for rats and in Fig. 7 for mice, similar pharmacokinetic profiles were observed in these lower species to those observed in cynos. Increasing Fv charge resulted in faster nonspecific clearance for both anti-LTα and humAb4D5-8, whereas decreasing Fv charge resulted in a slower nonspecific clearance for anti-LTα, and no significant change for humAb4D5-8. The PK parameters for these species are presented in Table 4.
FIGURE 6.

Concentration-time profiles of the parental antibodies and the Fv charge variants following a single i.v. or s.c. dose at 10 mg/kg to Sprague-Dawley rats. The parental antibodies are depicted in red; the more positively charge variants are depicted in blue, and the less positively charge variants are depicted in green. The i.v. dose groups are depicted in A and C for the anti-LTα and humAb4D5-8 antibodies, respectively. The s.c. dose groups are depicted in B and D for the anti-LTα and humAb4D5-8 antibodies, respectively. Each point represents an individual animal (n = 3), and the line represents the average concentration among them.
FIGURE 7.

Concentration-time profiles of the parental antibodies and the Fv charge variants following a single i.v. or s.c. dose at 10 mg/kg to C57BL/6 mice. The parental antibodies are depicted in red; the more positively charge variants are depicted in blue, and the less positively charge variants are depicted in green. The i.v. dose groups are depicted in A and C for the anti-LTα and humAb4D5-8 antibodies, respectively. The s.c. dose groups are depicted in B and D for the anti-LTα and humAb4D5-8 antibodies, respectively. Each point represents an individual animal (n = 3), and the line represents the average concentration among them.
TABLE 4.
Average (± S.D.) PK parameters following single i.v. or s.c. dose administration at 10 mg/kg in mice and rats
The following abbreviations are used: t½β = terminal half-life; CL = non-specific clearance; AUC = area under the concentration-time curve from time 0 to time of last measurable concentration; V1 = volume of distribution of the central compartment; %F = bioavailability; ka = absorption rate constant; tmax = time to maximum serum concentration; Cmax = maximum serum concentration; i.v. = intravenous; s.c. = subcutaneous.
| Parameter | Species | Anti-LTαparental | Anti-LTα+3 | Anti-LTα−4 | HumAb4D5-8 parental | HumAb4D5-8 +5 | HumAb4D5-8 −4 |
|---|---|---|---|---|---|---|---|
| t½β day | Rat | 9.09 ± 0.480 | 5.08 ± 0.681 | 9.10 ± 3.03 | 10.9 ± 2.32 | 8.22 ± 1.04 | 14.0 ± 3.39 |
| Mouse | 12.8 | 7.90 | 13.5 | 15.8 | 7.15 | 18.1 | |
| CL ml/day/kg | Rat | 9.94 ± 1.35 | 38.1 ± 4.08 | 2.87 ± 0.60 | 7.33 ± 0.763 | 19.1 ± 1.68 | 3.41 ± 0.406 |
| Mouse | 9.19 | 34.5 | 3.57 | 5.61 | 49.7 | 4.79 | |
| AUC (i.v.) day·μg/ml | Rat | 1010 ± 137 | 262 ± 28.1 | 3480 ± 728 | 1360 ± 142 | 524 ± 46.1 | 2930 ± 349 |
| Mouse | 1088 | 290 | 2800 | 1780 | 201 | 2090 | |
| V1 ml/kg | Rat | 64.7 ± 9.03 | 92.2 ± 15.0 | 30.2 ± 4.80 | 54.3 ± 7.27 | 54.6 ± 7.99 | 49.5 ± 7.62 |
| Mouse | 63.1 | 139 | 37.6 | 48.4 | 99.8 | 53.8 | |
| %F | Rat | 76.2 ± 11.0 | 43.9 ± 6.24 | 67.5 ± 17.5 | 109 ± 17.1 | 33.6 ± 4.50 | 97.1 ± 16.5 |
| Mouse | 51.2 | 68.6 | 79.2 | 75.1 | 45.3 | 89.5 | |
| ka1/day | Rat | 0.162 ± 0.0308 | 0.243 ± 0.0420 | 0.119 ± 0.0368 | 0.157 ± 0.0397 | 0.392 ± 0.0773 | 0.170 ± 0.0404 |
| Mouse | 1.54 | 1.09 | 1.46 ± 0.187 | 1.14 | 0.728 | 1.37 | |
| tmax (s.c.) day | Rat | 3.00 ± 0 | 3.00 ± 0 | 3.00 ± 0 | 4.33 ± 2.31 | 4.33 ± 2.31 | 5.67 ± 2.31 |
| Mouse | 3.00 | 1.00 | 3.00 | 1.00 | 0.400 | 1.00 | |
| Cmax (s.c.) μg/ml | Rat | 55.6 ± 12.7 | 14.9 ± 0.988 | 125 ± 6.66 | 83.3 ± 8.75 | 21.2 ± 2.43 | 116 ± 16.8 |
| Mouse | 28.1 | 14.2 | 99.0 | 63.4 | 56.7 | 97.9 |
Discussion
Introducing site-specific amino acid mutations to alter the charge of the Fv region of two monoclonal antibodies resulted in significant PK changes in cynos. Utilizing the antibody-antigen crystal structures enabled the selection of amino acids that were not directly involved in antigen binding and therefore should have limited impact on target affinity, as was the case. Furthermore, no other significant alterations in the antibody characteristics, including antibody pI, Fv hydrophobicity, or FcRn binding affinity, were noted (Table 2). Making the anti-LTα and humAb4D5-8 Fv more positively charged resulted in significantly faster nonspecific clearance compared with their parental counterparts. This increase in nonspecific clearance could be due to electrostatic interaction between the more positively charged Fv and the negatively charged components of vascular and/or tissue cells, such as negatively charged glycosaminoglycans and proteoglycans (27, 28). By being attracted to negatively charged moieties, it is hypothesized that the antibodies could be sequestered from circulation and possibly could also undergo more fluid phase pinocytosis due to their higher concentration in the extracellular space, thus increasing their overall clearance from the body (35). Indeed studies have been conducted to show that cationized antibodies are more efficiently internalized into cells by absorptive-mediated endocytosis than their less positively charged counterparts (35). An alternative hypothesis has recently been proposed by Schoch et al. (36) in which specifically located positively charged regions in the CDRs of antibodies have been shown to prolong the association of antibodies with FcRn, thus preventing their dissociation from FcRn and increasing their degradation. We did not observe a greater than 2-fold change in FcRn binding affinity at pH 5.8 for any of the Fv charge variants that would support this hypothesis. However, the assay we used measures the kon of the interaction, although the method published by Schoch et al. (36) focuses more on the koff. It is possible that it is this koff measurement that corresponds more to systemic nonspecific CL than the kon. More studies are needed to resolve the mechanism driving the faster nonspecific clearance of these variants.
Decreasing the positive charge of the Fv regions of these two antibodies resulted in different PK trends; the humAb4D5-8 −4 variant had very similar nonspecific CL as its parental counterpart, whereas the anti-LTα −4 variant cleared slower. The nonspecific CL changes for the anti-LTα less positive variant is consistent with the electrostatic hypothesis in that the antibody should be less attracted to the negatively charged components of cells within tissues, thus clearing more slowly. However, the reason for the lack of a change in nonspecific CL for the less positively charged humAb4D5-8 variant is currently unclear. It had a reduction in Fv charge by about 4 units, going from a +6.1 to a +2.2. It is possible that charge changes within the acceptable range predicted by the model of 0–6.2 do not mediate a change in PK or that the mutations chosen had no significant impact on the overall charge distribution within the Fv, as indicated by the homology model for this variant compared with its parental antibody (Fig. 1). Alternatively, it is possible that even in the presence of further charge repulsion, the basal level of pinocytosis is already quite low so differences in kinetics may not be detectable. Further investigation into this is warranted to understand the low Fv charge cost/benefit relationship.
The effect of altering Fv charge on s.c. bioavailability was less clear than that for nonspecific CL. For the anti-LTα variants, the more positively charged variant showed a significant decrease in s.c. bioavailability compared with its parental counterpart (31% versus 60%), although there was no significant change in the s.c. bioavailability for the less positively charged variant (70% versus 60%). The opposite trend was observed for the humAb4D5-8 antibodies. The s.c. bioavailability was not significantly decreased with the more positively charged variant (72% versus 83%), but there was a significant increase in s.c. bioavailability for the less positively charged variant (>100% versus 83%). We did observe a charge-dependent trend in Cmax, with the more positively charged variants having lower maximum serum concentrations, and the less positively charged variants having higher maximum serum concentrations than their parental counterparts. Mach et al. (37) hypothesized that antibody charge could affect antibody s.c. bioavailability and examined the binding of antibodies to rat s.c. tissue ex vivo. They observed a trend that the more positively charged antibody (pI = 9.1) bound more to the rat s.c. tissue than the less positively charged antibody (pI = 7.3). Altering the ionic strength of the formulation buffer or antibody concentration changed the degree of binding to the rat tissue. Indeed, all antibodies examined in this study had calculated antibody pI values ranging from 8.75 to 9.55, and all were dosed at the same concentration, so there may not have been enough of a difference among the antibodies to observe a clear difference in bioavailability. Furthermore, Igawa et al. (23) also were not able to see a clear correlation between s.c. bioavailability in mice and total antibody pI, even with antibodies with pI values ranging from 7.2 to 9.2. A variety of mechanisms can contribute to s.c. absorption, including formulation, rate of proteolysis, endocytosis, and FcRn recycling (6); therefore, it is also possible that altering antibody electrostatics is not enough to elicit a significant change in any or all of these processes. This could also explain why no significant difference was observed in the absorption rate constant values among the charge variants. The trend observed with Cmax was likely due to a combination of the lower/higher absorption and faster/slower systemic clearance, depending on the direction of Fv charge modification. A more directed approach of sampling the s.c. space or lymphatic fluid may provide a better understanding of which processes are driving the kinetics from this compartment and whether Fv charge can indeed affect those processes.
Similar PK profiles for all variants were observed in all preclinical species tested. The lack of species dependence in PK supports the hypothesis for a nonspecific electrostatic interaction. However, the magnitude of change in nonspecific CL and bioavailability did differ among the species. For example, in all species, the more positively charged variant of anti-LTα cleared about four times faster than the parental antibody; however, the less positively charged variant cleared between 2.5 and 13-fold slower than the parental antibody, depending on the species. For humAb4D5-8, cyno and mouse displayed similar changes in nonspecific CL with the more positively charged variants clearing ∼8–9 times faster than the parental, whereas the less positively charged variant cleared similarly to that of the parental. However, in rats, the more positively charged variant cleared only ∼2 times faster than parental, whereas the less positively charged variant cleared 2 times more slowly. Similar differences among the species were noted in s.c. bioavailability as well. These species differences could be due to inter-study variability, differences in FcRn affinity (38), or qualitative differences in animal physiology (14, 39–41). Despite these species differences in the magnitude of change, the consistency in the direction of the change among species suggests that these trends would also hold true in humans.
The PK trends we observed with the charge variants tested in this study are consistent with those predicted by the empirical model. The antibodies with an Fv charge greater than +6.2 had faster than acceptable nonspecific clearance (>8 ml/day/kg), whereas those with an Fv charge within the 0–6.2 range had acceptable nonspecific clearance (<8 ml/day/kg). However, these trends were only observed with two antibodies. It is possible that similar Fv charge modifications with other antibodies may not yield results that are consistent with the model, especially because this is an empirically derived model, not grounded on biological interactions and using handpicked parameters such as monitoring the Fv charge at pH 5.5 or only including the physicochemical properties of select light and heavy chain domains (17). Nonetheless, this approach was able to accurately predict the PK of anti-LTα parental, whereas another test to lower risk, the BV assay, was not. In the BV assay, the anti-LTα antibody had relatively low nonspecific binding and was not flagged as an antibody at risk for fast nonspecific clearance in the cyno. However, in this case the Fv charge of +8.1 was predictive of high risk for fast nonspecific CL in cyno, and with nonspecific clearance of 14.9 ml/day/kg, this antibody did indeed clear faster than typical antibodies. This observation suggests that not all screening methods are 100% accurate and that using multiple tests may provide a more accurate picture of what the true risk for an antibody may be. Our results suggest that in silico calculations of Fv charge provide a complementary tool to nonspecific binding assays for risk assessment of fast nonspecific clearance.
Consequently, given that the PK was consistent with that predicted by the model and that a multifaceted risk analysis approach may be beneficial for antibody development, this model may be useful to select against antibodies with high Fv charge in the case when all other factors are equal. Similarly, if an antibody does prove to have fast nonspecific clearance in the monkey and its Fv charge is high, it may be worth introducing mutations to decrease charge and potentially improve the PK of the antibody. Indeed, Sampei et al. (24) used a similar approach to rescue one of their fast clearing antibodies. We took advantage of the availability of high resolution, antigen-antibody complex structures to design variants having minimal impact on antigen binding. In cases where complex structures are not available, determination of the functional paratope of an antibody could be used to identify substitutable positions (42–46). An alternative approach may be to change the framework of the antibody, as that has been shown to significantly change the pI of antibodies, resulting in significantly altered PK and tissue distribution (34). Thus, using this model along with other screening methods for antibodies may help lower the risk of developing antibodies with PK liabilities while still retaining antibody binding and activity.
Author Contributions
D. B. Y., R. F. K., V. K. S., I. H., L. A. K., and C. A. B. designed the studies. I. H. and R. F. K. designed the mutants, and Y. S. made and purified them. K. U. and S. U. coordinated and ran the in vivo studies. Y. Y. and S. K. F. ran all the ELISAs. D. T., E. Y. C., and J. L. G. ran the antibody characterization experiments. D. B. Y. conducted the pharmacokinetic analysis and wrote the manuscript. S. P. and S. J. contributed to helpful discussion of the data. All authors reviewed the results and approved the final version of the manuscript.
At the time this work was conducted, all authors were full-time employees of Genentech, Inc., a member of the Roche Group.
M. Dostalek, D. Bumbaca Yadav, C. Cullen, K. Gadkar, J. Lutman, J. Wang, M. Kenrick, R. Port, R. F. Kelley, F. P. Theil, P. Fielder, S. Joseph, and S. Prabhu, manuscript in preparation.
- PK
- pharmacokinetics
- BV
- baculovirus
- CL
- non-specific clearance
- cyno
- cynomolgus monkey
- F
- bioavailability
- FcRn
- neonatal constant fragment receptor
- Fv
- variable region of antibody
- ka
- absorption rate constant
- mAb
- monoclonal antibody
- pI
- isoelectric point
- s.c.
- subcutaneous
- anti-LTα
- anti-lymphotoxin α
- CDR
- complementarity determining region.
References
- 1.Reichert J. M. (2012) Marketed therapeutic antibodies compendium. mAbs 4, 413–415 [DOI] [PMC free article] [PubMed] [Google Scholar]
- 2.Hay M., Thomas D. W., Craighead J. L., Economides C., and Rosenthal J. (2014) Clinical development success rates for investigational drugs. Nat. Biotechnol. 32, 40–51 [DOI] [PubMed] [Google Scholar]
- 3.Bumbaca D., Boswell C. A., Fielder P. J., and Khawli L. A. (2012) Physiochemical and biochemical factors influencing the pharmacokinetics of antibody therapeutics. AAPS J. 14, 554–558 [DOI] [PMC free article] [PubMed] [Google Scholar]
- 4.Cao Y., and Jusko W. J. (2014) Incorporating target-mediated drug disposition in a minimal physiologically based pharmacokinetic model for monoclonal antibodies. J. Pharmacokinet. Pharmacodyn. 41, 375–387 [DOI] [PMC free article] [PubMed] [Google Scholar]
- 5.Davda J. P., and Hansen R. J. (2010) Properties of a general PK/PD model of antibody-ligand interactions for therapeutic antibodies that bind to soluble endogenous targets. mAbs 2, 576–588 [DOI] [PMC free article] [PubMed] [Google Scholar]
- 6.Wang W., Wang E. Q., and Balthasar J. P. (2008) Monoclonal antibody pharmacokinetics and pharmacodynamics. Clin. Pharmacol. Ther. 84, 548–558 [DOI] [PubMed] [Google Scholar]
- 7.Chirmule N., Jawa V., and Meibohm B. (2012) Immunogenicity to therapeutic proteins: impact on PK/PD and efficacy. AAPS J. 14, 296–302 [DOI] [PMC free article] [PubMed] [Google Scholar]
- 8.Everds N., Li N., Bailey K., Fort M., Stevenson R., Jawando R., Salyers K., Jawa V., Narayanan P., Stevens E., He C., Nguyen M. P., Tran S., Doyle N., Poitout-Belissent F., et al. (2013) Unexpected thrombocytopenia and anemia in cynomolgus monkeys induced by a therapeutic human monoclonal antibody. Toxicol. Pathol. 41, 951–969 [DOI] [PubMed] [Google Scholar]
- 9.Santostefano M. J., Kirchner J., Vissinga C., Fort M., Lear S., Pan W. J., Prince P. J., Hensley K. M., Tran D., Rock D., Vargas H. M., Narayanan P., Jawando R., Rees W., Reindel J. F., et al. (2012) Off-target platelet activation in macaques unique to a therapeutic monoclonal antibody. Toxicol. Pathol. 40, 899–917 [DOI] [PubMed] [Google Scholar]
- 10.Bumbaca D., Wong A., Drake E., Reyes A. E. 2nd., Lin B. C., Stephan J.-P., Desnoyers L., Shen B.-Q., and Dennis M. S. (2011) Highly specific off-target binding identified and eliminated during the humanization of an antibody against FGF receptor 4. mAbs 3, 376–386 [DOI] [PMC free article] [PubMed] [Google Scholar]
- 11.Xin Y., Li J., Wu J., Kinard R., Weekes C. D., Patnaik A., Lorusso P., Brachmann R., Tong R. K., Yan Y., Watts R., Bai S., and Hegde P. S. (2012) Pharmacokinetic and pharmacodynamic analysis of circulating biomarkers of anti-NRP1, a novel antiangiogenesis agent, in two phase I trials in patients with advanced solid tumors. Clin. Cancer Res. 18, 6040–6048 [DOI] [PubMed] [Google Scholar]
- 12.Vugmeyster Y., Szklut P., Wensel D., Ross J., Xu X., Awwad M., Gill D., Tchistiakov L., and Warner G. (2011) Complex pharmacokinetics of a humanized antibody against human amyloid β peptide, anti-Aβ Ab2, in nonclinical species. Pharm. Res. 28, 1696–1706 [DOI] [PubMed] [Google Scholar]
- 13.Pippig S. D., Brockmeyer C., and Zoubek R. E. (2014) in Biosimilar Monoclonal Antibodies (Dubel S., and Reichert J. M., eds) Wiley-Blackwell, Hoboken, NJ [Google Scholar]
- 14.Deng R., Iyer S., Theil F. P., Mortensen D. L., Fielder P. J., and Prabhu S. (2011) Projecting human pharmacokinetics of therapeutic antibodies from nonclinical data: what have we learned? mAbs 3, 61–66 [DOI] [PMC free article] [PubMed] [Google Scholar]
- 15.Dong J. Q., Salinger D. H., Endres C. J., Gibbs J. P., Hsu C. P., Stouch B. J., Hurh E., and Gibbs M. A. (2011) Quantitative prediction of human pharmacokinetics for monoclonal antibodies: retrospective analysis of monkey as a single species for first-in-human prediction. Clin. Pharmacokinet. 50, 131–142 [DOI] [PubMed] [Google Scholar]
- 16.Hötzel I., Theil F. P., Bernstein L. J., Prabhu S., Deng R., Quintana L., Lutman J., Sibia R., Chan P., Bumbaca D., Fielder P., Carter P. J., and Kelley R. F. (2012) A strategy for risk mitigation of antibodies with fast clearance. mAbs 4, 753–760 [DOI] [PMC free article] [PubMed] [Google Scholar]
- 17.Sharma V. K., Patapoff T. W., Kabakoff B., Pai S., Hilario E., Zhang B., Li C., Borisov O., Kelley R. F., Chorny I., Zhou J. Z., Dill K. A., and Swartz T. E. (2014) In silico selection of therapeutic antibodies for development: viscosity, clearance, and chemical stability. Proc. Natl. Acad. Sci. U.S.A. 111, 18601–18606 [DOI] [PMC free article] [PubMed] [Google Scholar]
- 18.Lee H. J., and Pardridge W. M. (2003) Monoclonal antibody radiopharmaceuticals: cationization, pegylation, radiometal chelation, pharmacokinetics, and tumor imaging. Bioconjug. Chem. 14, 546–553 [DOI] [PubMed] [Google Scholar]
- 19.Pardridge W. M., Kang Y. S., Yang J., and Buciak J. L. (1995) Enhanced cellular uptake and in vivo biodistribution of a monoclonal antibody following cationization. J. Pharm. Sci. 84, 943–948 [DOI] [PubMed] [Google Scholar]
- 20.Hervé F., Ghinea N., and Scherrmann J. M. (2008) CNS delivery via adsorptive transcytosis. AAPS J. 10, 455–472 [DOI] [PMC free article] [PubMed] [Google Scholar]
- 21.Khawli L. A., Glasky M. S., Alauddin M. M., and Epstein A. L. (1996) Improved tumor localization and radioimaging with chemically modified monoclonal antibodies. Cancer Biother. Radiopharm. 11, 203–215 [DOI] [PubMed] [Google Scholar]
- 22.Kobayashi H., Le N., Kim I. S., Kim M. K., Pie J. E., Drumm D., Paik D. S., Waldmann T. A., Paik C. H., and Carrasquillo J. A. (1999) The pharmacokinetic characteristics of glycolated humanized anti-Tac Fabs are determined by their isoelectric points. Cancer Res. 59, 422–430 [PubMed] [Google Scholar]
- 23.Igawa T., Tsunoda H., Tachibana T., Maeda A., Mimoto F., Moriyama C., Nanami M., Sekimori Y., Nabuchi Y., Aso Y., and Hattori K. (2010) Reduced elimination of IgG antibodies by engineering the variable region. Protein Eng. Des. Sel. 23, 385–392 [DOI] [PubMed] [Google Scholar]
- 24.Sampei Z., Igawa T., Soeda T., Okuyama-Nishida Y., Moriyama C., Wakabayashi T., Tanaka E., Muto A., Kojima T., Kitazawa T., Yoshihashi K., Harada A., Funaki M., Haraya K., Tachibana T., et al. (2013) Identification and multidimensional optimization of an asymmetric bispecific IgG antibody mimicking the function of factor VIII cofactor activity. PLoS One 8, e57479. [DOI] [PMC free article] [PubMed] [Google Scholar]
- 25.Chiang E. Y., Kolumam G., McCutcheon K. M., Young J., Lin Z., Balazs M., and Grogan J. L. (2012) In vivo depletion of lymphotoxin-α expressing lymphocytes inhibits xenogeneic graft-versus-host-disease. PLoS One 7, e33106. [DOI] [PMC free article] [PubMed] [Google Scholar]
- 26.Shalaby M. R., Shepard H. M., Presta L., Rodrigues M. L., Beverley P. C., Feldmann M., and Carter P. (1992) Development of humanized bispecific antibodies reactive with cytotoxic lymphocytes and tumor cells overexpressing the HER2 protooncogene. J. Exp. Med. 175, 217–225 [DOI] [PMC free article] [PubMed] [Google Scholar]
- 27.Tabrizi M., Bornstein G. G., and Suria H. (2010) Biodistribution mechanisms of therapeutic monoclonal antibodies in health and disease. AAPS J. 12, 33–43 [DOI] [PMC free article] [PubMed] [Google Scholar]
- 28.Davies Cde L., Berk D. A., Pluen A., and Jain R. K. (2002) Comparison of IgG diffusion and extracellular matrix composition in rhabdomyosarcomas grown in mice versus in vitro as spheroids reveals the role of host stromal cells. Br. J. Cancer 86, 1639–1644 [DOI] [PMC free article] [PubMed] [Google Scholar]
- 29.Sudhamsu J., Yin J., Chiang E. Y., Starovasnik M. A., Grogan J. L., and Hymowitz S. G. (2013) Dimerization of LTβR by LTα1β2 is necessary and sufficient for signal transduction. Proc. Natl. Acad. Sci. U.S.A. 110, 19896–19901 [DOI] [PMC free article] [PubMed] [Google Scholar]
- 30.Cho H. S., Mason K., Ramyar K. X., Stanley A. M., Gabelli S. B., Denney D. W. Jr., and Leahy D. J. (2003) Structure of the extracellular region of HER2 alone and in complex with the herceptin Fab. Nature 421, 756–760 [DOI] [PubMed] [Google Scholar]
- 31.Kabat E. A., Wu T. T., Perry H., Gottesman K., and Foeller C. (1991) Sequences of Proteins of Immunological Interest, 5th Ed., NIH Publication, Bethesda [Google Scholar]
- 32.Kelley R. F., and Meng Y. G. (2012) Methods to engineer and identify IgG1 variants with improved FcRn binding or effector function. Methods Mol. Biol. 901, 277–293 [DOI] [PubMed] [Google Scholar]
- 33.Pantua H., Diao J., Ultsch M., Hazen M., Mathieu M., McCutcheon K., Takeda K., Date S., Cheung T. K., Phung Q., Hass P., Arnott D., Hongo J. A., Matthews D. J., Brown A., et al. (2013) Glycan shifting on hepatitis C virus (HCV) E2 glycoprotein is a mechanism for escape from broadly neutralizing antibodies. J. Mol. Biol. 425, 1899–1914 [DOI] [PubMed] [Google Scholar]
- 34.Li B., Tesar D., Boswell C. A., Cahaya H. S., Wong A., Zhang J., Meng Y. G., Eigenbrot C., Pantua H., Diao J., Kapadia S. B., Deng R., and Kelley R. F. (2014) Framework selection can influence pharmacokinetics of a humanized therapeutic antibody through differences in molecule charge. mAbs 6, 1255–1264 [DOI] [PMC free article] [PubMed] [Google Scholar]
- 35.Boswell C. A., Tesar D. B., Mukhyala K., Theil F. P., Fielder P. J., and Khawli L. A. (2010) Effects of charge on antibody tissue distribution and pharmacokinetics. Bioconjug. Chem. 21, 2153–2163 [DOI] [PubMed] [Google Scholar]
- 36.Schoch A., Kettenberger H., Mundigl O., Winter G., Engert J., Heinrich J., and Emrich T. (2015) Charge-mediated influence of the antibody variable domain on FcRn-dependent pharmacokinetics. Proc. Natl. Acad. Sci. U.S.A. 112, 5997–6002 [DOI] [PMC free article] [PubMed] [Google Scholar]
- 37.Mach H., Gregory S. M., Mackiewicz A., Mittal S., Lalloo A., Kirchmeier M., and Shameem M. (2011) Electrostatic interactions of monoclonal antibodies with subcutaneous tissue. Ther. Deliv. 2, 727–736 [DOI] [PubMed] [Google Scholar]
- 38.Ober R. J., Radu C. G., Ghetie V., and Ward E. S. (2001) Differences in promiscuity for antibody-FcRn interactions across species: implications for therapeutic antibodies. Int. Immunol. 13, 1551–1559 [DOI] [PubMed] [Google Scholar]
- 39.Boxenbaum H. (1982) Interspecies scaling, allometry, physiological time, and the ground plan of pharmacokinetics. J. Pharmacokinet. Biopharm. 10, 201–227 [DOI] [PubMed] [Google Scholar]
- 40.Lin J. H. (1995) Species similarities and differences in pharmacokinetics. Drug Metab. Dispos. 23, 1008–1021 [PubMed] [Google Scholar]
- 41.Richter W. F., Bhansali S. G., and Morris M. E. (2012) Mechanistic determinants of biotherapeutics absorption following s.c. administration. AAPS J. 14, 559–570 [DOI] [PMC free article] [PubMed] [Google Scholar]
- 42.Bass R. B., Miller A. S., Gloor S. L., and Falke J. J. (2007) The PICM chemical scanning method for identifying domain-domain and protein-protein interfaces: applications to the core signaling complex of E. coli chemotaxis. Methods Enzymol. 423, 3–24 [DOI] [PMC free article] [PubMed] [Google Scholar]
- 43.Cunningham B. C., and Wells J. A. (1989) High-resolution epitope mapping of hGH-receptor interactions by alanine-scanning mutagenesis. Science 244, 1081–1085 [DOI] [PubMed] [Google Scholar]
- 44.Mehan R. S., White N. C., and Falke J. J. (2003) Mapping out regions on the surface of the aspartate receptor that are essential for kinase activation. Biochemistry 42, 2952–2959 [DOI] [PMC free article] [PubMed] [Google Scholar]
- 45.Miller A. S., Kohout S. C., Gilman K. A., and Falke J. J. (2006) CheA kinase of bacterial chemotaxis: chemical mapping of four essential docking sites. Biochemistry 45, 8699–8711 [DOI] [PMC free article] [PubMed] [Google Scholar]
- 46.Sharp L. L., Zhou J., and Blair D. F. (1995) Features of MotA proton channel structure revealed by tryptophan-scanning mutagenesis. Proc. Natl. Acad. Sci. U.S.A. 92, 7946–7950 [DOI] [PMC free article] [PubMed] [Google Scholar]