

Background: Metabolic influences of defective mitochondrial respiration in hepatocytes remain elusive.
Results: Mutation of mitochondrion-encoded NADH dehydrogenase 1 enhanced the activity of AMP-activated protein kinase (AMPK) and decreased lactate turnover in differentiated hepatocytes.
Conclusion: Dysfunctional mitochondria in the hepatocytes may be responsible for lactic acidosis.
Significance: This study provides new insight on the role of AMPK in lactic acidosis caused by mitochondrial dysfunction.
Keywords: hepatocyte, induced pluripotent stem cell (iPS cell) (iPSC), liver, liver metabolism, mitochondrial disease, lactic acidosis
Abstract
A defective mitochondrial respiratory chain complex (DMRC) causes various metabolic disorders in humans. However, the pathophysiology of DMRC in the liver remains unclear. To understand DMRC pathophysiology in vitro, DMRC-induced pluripotent stem cells were generated from dermal fibroblasts of a DMRC patient who had a homoplasmic mutation (m.3398T→C) in the mitochondrion-encoded NADH dehydrogenase 1 (MTND1) gene and that differentiated into hepatocytes (DMRC hepatocytes) in vitro. DMRC hepatocytes showed abnormalities in mitochondrial characteristics, the NAD+/NADH ratio, the glycogen storage level, the lactate turnover rate, and AMPK activity. Intriguingly, low glycogen storage and transcription of lactate turnover-related genes in DMRC hepatocytes were recovered by inhibition of AMPK activity. Thus, AMPK activation led to metabolic changes in terms of glycogen storage and lactate turnover in DMRC hepatocytes. These data demonstrate for the first time that energy depletion may lead to lactic acidosis in the DMRC patient by reduction of lactate uptake via AMPK in liver.
Introduction
The mitochondrial respiratory chain complexes (MRCC)2 located on the mitochondrial inner membrane produce cellular energy through oxidative phosphorylation (OXPHOS). Impairment in mitochondrial respiratory activity causes various disorders throughout development and in multiple organs; these disorders include neonatal fatal lactic acidosis, cardiomyopathy, skeletal myopathy, hepatic failure in childhood, Leber hereditary optic neuropathy (LHON) in young adults, and even Parkinson disease in old age (1–5). Mitochondrial disorders depend on the mutation site and the heteroplasmy of the defective mitochondria (6). Most patients suffering from MRCC defects have mutations in complex I, the first MRCC complex (7). Complex I is composed of 44 subunits encoded by the mitochondrial and nuclear genomes. Complex I oxidizes NADH into NAD+ and transports protons to the intermembrane space across the inner membrane of mitochondria, thereby generating a proton gradient. The primary diseases caused by complex I defects are Leigh disease, LHON, and mitochondrial myopathy, encephalopathy, lactic acidosis, and stroke-like episodes (MELAS) syndrome (8–10).
Mitochondrially encoded NADH dehydrogenase 1 is a component of complex I. Mutations in the MTND1 gene cause various diseases that are categorized by complex I defects. Approximately 90% of LHON patients with blindness have m.3460G→A, m.11778G→A, or m.14484T→C mutation (11, 12). A patient with an m.3376G→A mutation showed both LHON and MELAS symptoms (13). One MELAS patient with both an m.3243A→G mutation in tRNALeu and an m.3398T→C mutation in the MTND1 gene had severe phenotypes, such as myopathy, lactic acidosis, and neurodegenerative symptoms (14). The m.3398T→C mutation was attributed to gestational diabetes or left ventricular noncompaction (15, 16), depending on heteroplasmy. Although an MTND1 mutation is predicted to contribute to energy depletion by OXPHOS dysfunction and subsequent metabolic changes, this hypothesis has not yet been tested at the molecular and biochemical levels because of limitations of disease modeling in humans.
Recent work has suggested that disease modeling using induced pluripotent stem cells (iPSCs) is a promising method to understand the pathophysiology of genetic diseases in humans (17–23). Mitochondrial structure, mtDNA copy number, and mitochondrial mass are recapitulated in the pluripotent state during cellular reprogramming of somatic cells (24). This reprogramming of mitochondria enables modeling of mitochondrial diseases in specialized cell types because iPSCs are able to differentiate into diverse cell types. Until now, only few mtDNA mutations have been investigated in iPSCs, and any mutation on MTND1 has not been studied in iPSCs (25–28). Here, we generated disease-specific iPSCs with defective mitochondrial respiratory complex (DMRC-iPSCs) by m.3398T→C mutation on the MTND1 gene and examined metabolic phenomena in hepatocytes derived from those DMRC-iPSCs. Our results suggest that enhanced AMPK activity caused by OXPHOS dysfunction leads to a decrement of lactate turnover capacity in hepatocytes and finally severe lactic acidosis in the patient.
Experimental Procedures
Generation and Maintenance of iPS Cells
Patient dermal fibroblasts were obtained from Asan Medical Center under a protocol approved by the institutional review board. To induce pluripotency, Yamanaka factors (OCT4, SOX2, c-MYC, and KLF4) were introduced into fibroblasts by retroviral infection. 5 days after infection, the fibroblasts were transferred onto a mitomycin C (A.G. Scientific, San Diego)-treated mouse embryo fibroblast feeder layer and cultured for ∼2–3 weeks until colonies formed. Single colonies were picked and separately cultured as individual cell lines. iPSCs were cultured in human embryonic stem cell medium at 37 °C, 5% CO2 in air. The human embryonic stem cell medium was composed of DMEM/F-12 (Life Technologies, Inc.) supplemented with 20% Knock-OutTM serum replacement (Life Technologies, Inc.), 1.2 g/liter sodium bicarbonate, 1 mm l-glutamine (Sigma), 1% non-essential amino acid, 1% penicillin/streptomycin (Life Technologies, Inc.), 0.1 mm β-mercaptoethanol (Sigma), and 10 ng/ml bFGF (R&D Systems, Minneapolis, MN). Every 5 days, single iPSC colonies were mechanically sliced into 10–15 sections and detached after incubation with 0.1 mg/ml collagenase type IV (Life Technologies, Inc.) for 4 min. The medium was changed daily. Wild-type iPSCs (WT-iPSCs) derived from dermal fibroblasts (29) were used as a control. To form embryoid bodies (EB), hiPSC clumps were suspended in DMEM/F-12 (Life Technologies, Inc.) containing 10% Knock-OutTM serum replacement in a low attachment dish for 7 days. Then, the EBs were attached to the cell culture dish, further cultured in DMEM (Welgene, Daegu, Korea) with 10% fetal bovine serum (FBS, Life Technologies, Inc.) for 7 days, and subjected to RT analysis to examine the expression of marker genes for the three germ layers.
RT-PCR
Commercial fetal and adult liver RNAs (Agilent Technologies, Santa Clara, CA) were purchased, reverse-transcribed, and used as positive controls. Total RNAs were extracted from cells using the Easy-BLUE reagent (Intron Biotechnology, Sungnam, Korea). Reverse transcription was performed using Moloney murine leukemia virus reverse transcriptase (Enzynomics, Daejeon, Korea) according to the manufacturer's protocol. RT-PCR was performed with Taq-Plus DNA polymerase (NanoHelix, Daejeon, Korea) on a GeneAmp® PCR System 9700 (Life Technologies, Inc.), and quantitative PCR amplification was performed with a pre-made 2× mixture on a CFX ConnectTM real time system (Bio-Rad). The 2× mixture consisted of 40 mm Tris, pH 8.4, 0.1 m KCl, 6 mm MgCl2, 2 mm dNTP, 0.2% fluorescein, 0.4% SYBR Green, and 10% DMSO. Information regarding the primers used in this study is provided in Table 1. The reaction conditions for real time RT-PCR analysis were as follows: 95 °C for 5 min, followed by 40 cycles of 95 °C for 10 s, 60 °C for 10 s, and 72 °C for 10 s, and a melting curve. For comparative analyses, the mRNA expression level of genes was normalized to that of GAPDH and then expressed as a fold-change relative to the expression level of the control. The ΔCt value was calculated as the difference between the GAPDH Ct and the target Ct. Fold changes in gene expression levels between the sample and control were determined using the formula 2−(SΔCt − CΔCt).
TABLE 1.
Primers used in PCR analysis
| Gene | Forward primer | Reverse primer | Product size |
|---|---|---|---|
| bp | |||
| GAPDH | gaaggtgaaggtcggagtc | gaagatggtgatgggatttc | 226 |
| OCT4 | tcggggtggagagcaact | gggtgatcctcttctgcttc | 177 |
| SOX2 | accagctcgcagacctacat | tggagtgggaggaagaggta | 154 |
| NANOG | tgatttgtgggcctgaaga | gttgtttgcctttgggactg | 150 |
| KLF4 | gaactgaccaggcactaccg | ttctggcagtgtgggtcata | 152 |
| c-MYC | aagaggacttgttgcggaaa | ctcagccaaggttgtgaggt | 179 |
| REX1 | aatgcgtcataaggggtgag | gaacattcaagggagcttgc | 136 |
| ECAT15 | ggagccgcctgccctggaaaattc | tttttcctgatattctattcccat | 371 |
| hTERT | tgtgcaccaacatctacaag | gcgttcttggctttcaggat | 166 |
| E-cadherin | cttgttctgagtaagtgtgttc | tcatagttccgctctgtct | 117 |
| AAT | gaagtcaaggacaccgagga | gctggcagaccttctgtctt | 261 |
| AFP | agcttggtggtggatgaa | tctgcaatgacagcctcaag | 182 |
| ALB | tgcacagaatccttggtgaa | ttcacgagctcaacaagtgc | 173 |
| G6Pase | gttcatcttggtgtccgtga | gcacggaagtgttgctgtag | 187 |
| GLUT2 | ttgaaaaggtagggtttgagga | aaggaaatgtcaaaggagacga | 163 |
| HNF4A | cgagcagatccagttcatca | cgttggttcccatatgttcc | 149 |
| PEPCK | cagccctaccaggttccg | gttaagccgcaggccagg | 199 |
| HMGCR | catccctgttggagtggcag | gcacctccaccaagacctatt | 132 |
| GK | cactgctgagatgctcttcg | ccacgacattgttcccttct | 197 |
| ACC1 | ttttaagcccagctcaggaa | cgaaagtcaccccgaataga | 210 |
| ACC2 | ttcgagttcatggagcagtg | cggcagattaacatcagcaa | 174 |
| ACLY | gaagttttactgggggcaca | cggatctgggcatagttcat | 159 |
| AGXT | gatgtactcccgcaagacga | gtgatggtacatcctgggct | 100 |
| FBP1 | ccccagataattcagctcctta | gttgcattcgtacagcagtctc | 149 |
| PAX6 | gtgtccaacggatgtgtgag | ctagccaggttgcgaagaac | 254 |
| ZIC1 | gcgctccgagaatttaaaga | cgtggaccttcatgtgtttg | 212 |
| T (brachyury) | aagtacgtgaacggggaatg | tggtgagcttgactttgctg | 142 |
| SOX17 | cagaatccagacctgcacaa | gcggccggtacttgtagtt | 154 |
| FOXA2 | atgcactcggcttccagtat | cacgtacgacgacatgttca | 225 |
Protein Analysis
For Western blot analysis, samples were lysed in Pro-PrepTM (Intron Biotechnology) supplemented with phosphatase inhibitors (5 mm NaF, 1 mm NaVO4, and 1 mm pyrophosphate) at 4 °C overnight. The lysed samples were centrifuged at 13,000 × g for 30 min to obtain the supernatant that contains protein. The protein concentrations of the cell lysates were measured using the Bradford method. Proteins were separated on a 7.5% Gradi-gelTM (Elpis Biotech, Daejeon, Korea), transferred to nitrocellulose membranes, and blocked with 5% bovine serum albumin (BSA, Sigma) or 4% skim milk. The samples were then incubated in blocking solution at 4 °C overnight with primary antibodies. The primary antibodies used in this study were as follows: p-AMPK (Cell Signaling Technologies, catalog no. 2531); AMPKα (Cell Signaling Technologies, catalog no. 2532); p-DRP1 (Cell Signaling Technologies, catalog no. 4494); DRP1 (dynamin-related protein 1) (Cell Signaling Technologies, catalog no. 5391); and actin-HRP (Santa Cruz Biotechnology, Dallas, TX, sc-1615 HRP). After washing with 0.1% Tween 20 in Tris-buffered saline (TBST), the membranes were incubated with horseradish peroxidase (HRP)-conjugated secondary antibodies (Santa Cruz Biotechnology, anti-rabbit, sc-2313; anti-mouse, sc-2314) in blocking solution for 1 h. Quantification of band densities was performed with the ECL chemiluminescence system (Millipore, Billerica, MA) and a Fujifilm LAS4000 CCD camera system (Fujifilm, Japan). The density of each protein band was quantified using ImageJ software (National Institutes of Health, Bethesda).
Hepatic Differentiation
Human iPSCs were differentiated into hepatocytes using protocols previously reported (30, 31), with some modifications. The overall procedures are described in Fig. 3A. In brief, hiPSCs were transferred to MatrigelTM (BD Biosciences)-coated 4-well or 35-mm dishes and cultured in conditioned medium for 2 days. To induce hepatic precursors via the definitive endoderm stage, hiPSCs were treated with 100 ng/ml activin A (PeproTech, Rocky Hill, NJ) in RPMI 1640 medium (HyClone, South Logan, UT) with 2% B27 supplement (Life Technologies, Inc.) for 5 days, followed by treatment with 10 ng/ml fibroblast growth factor 4 (FGF4) and 10 ng/ml hepatocyte growth factor (HGF, PeproTech) in RPMI 1640 medium for 4 days. Then, hiPSC derivatives were trypsinized, replated on MatrigelTM-coated 96-well plates, and cultured in hepatocyte culture medium (HCM, Lonza, Walkersville, MD) containing 1% insulin/transferrin/selenium (ITS, Sigma), 10 ng/ml FGF4, 10 ng/ml oncostatin M (PeproTech), and 100 nm dexamethasone (Sigma) for 5 days. In a final step, the hiPSC-derived hepatocytes were further cultured in HCM containing 0.5 mm dibutyryl-cAMP (Santa Cruz Biotechnology) for 5–10 days. The medium was changed every 2 days. To examine the effects of the AMPK inhibition, DMRC hepatocytes were cultured in HCM containing 25 μm compound C (A.G. Scientific) for 3 days.
FIGURE 3.

Differentiation of DMRC-iPSCs into hepatocytes. A, overall protocol for hepatic differentiation of hiPSCs. B, transcriptional expression of hepatic genes in DMRC hepatocytes. C, efficiency of hepatic differentiation. Hepatocytes differentiated from hiPSCs were analyzed by flow cytometry for albumin, a hepatic marker. D, expression of the hepatic marker albumin in WT and DMRC hepatocytes. Scale bar, 50 μm. E, albumin secretion in WT and DMRC hepatocytes. F, visualization of glycogen storage by PAS staining co-stained with α1-antitrypsin (AAT). Scale bar, 50 μm. G, decrease of the glycogen level in DMRC hepatocytes. ***, p < 0.001 (n = 3). HEP, hepatocytes; NC, negative control.
Complex I Activity Assay
The activity of complex I was measured with a Complex I Enzyme Activity Microplate Assay kit (Abcam, Cambridge, UK) according to the manufacturer's instructions. The optical density (OD) was measured at a wavelength of 450 nm in 30-s intervals for 30 min. Complex I activity in the patient's cells was described as the NADH degradation rate (OD/min) and is expressed as the fold-change relative to the rate of the control.
Characterization of hiPSC-derived Hepatocytes
hiPSC-derived hepatocytes were incubated in HCM for 24 h, and then the supernatant was harvested. The amount of secreted albumin was measured from the supernatant using a human albumin ELISA kit (Bethyl Laboratories, Montgomery, TX) according to the manufacturer's instructions. The OD was immediately read at a wavelength of 450 nm on a Wallac 1420 Victor2 microplate reader (PerkinElmer Life Sciences). The concentration of secreted albumin in each well was adjusted by normalizing to the whole cell lysate protein in each well.
A quantitative glycogen assay was performed with the EnzyChromTM glycogen assay kit (BioAssay Systems, Hayward, CA) according to the manufacturer's instructions. The stained cells were observed on an IX70 fluorescence microscope (Olympus, Tokyo, Japan).
Glucose and Lactate Uptake Assays Using Radioactive Isotopes
To measure glucose uptake using radioactive isotope (RI), fibroblasts and iPSC-derived hepatocytes were first starved in low glucose DMEM (5.5 mm glucose) containing 0.5% FBS for 4 h followed by incubation in low glucose DMEM containing 10% FBS for 12 h prior to the treatment of RI. Cells were incubated in PBS containing 0.5 mm glucose and 1 μCi of 2-deoxy-d-[1-14C]glucose (PerkinElmer Life Sciences) at 37 °C, 5% CO2 for 1 h. After washing with PBS, cells were harvested and lysed in RIPA buffer containing 1% Triton X-100. Cell lysates were mixed with ULTIMA-FLOTM AP scintillation mixture (PerkinElmer Life Sciences), and the amounts of RI were counted by Tri-Carb 2910 TR liquid scintillation analyzer (PerkinElmer Life Sciences) for 1 min. The amount of glucose taken was calculated from the counts/min (cpm) value.
To measure lactate uptake using RI, iPSC-derived hepatocytes were treated with uptake buffer (10 mm HEPES, 5 mm KCl, 150 mm NaCl, 1 mm CaCl2, 1 mm MgCl2, pH 7.5) containing 1 μCi of l-[U-14C]lactic acid (PerkinElmer Life Sciences) and 14 mm l-lactate at 37 °C, 5% CO2 for 30 min. The overall procedure for RI measurements was the same as glucose assay described above.
AMPK Activity Assay
Cyclex AMPK kinase assay kit (Cyclex, Japan) was used for the measurement of AMPK activity. All procedures followed the manufacturer's instruction. Briefly, cells were collected and lysed with RIPA buffer containing Triton X-100 and phosphatase inhibitors (5 mm NaF, 2 mm Na3VO4, and 2 mm β-glycophosphate). Cell lysates and Kinase Reaction Buffer were added to substrate-coated wells followed by incubation for 30 min at 30 °C. Anti-phospho-mouse IRS-1 S789 antibody was added to each well at room temperature for 30 min. Next, HRP-conjugated anti-mouse IgG was added to the washed well and incubated at room temperature for 30 min. Then substrate reagents were added to each well and incubated for 10 min followed by addition of Stop Solution. The OD in each sample was read on a Wallac 1420 Victor2 microplate reader. The concentrations were calculated from the OD value and finally determined by normalizing to the whole cell lysate protein in each sample. Wells were washed five times after each step.
Metabolic Assays
The NAD+/NADH ratio was determined in fibroblasts, hiPSCs, and hiPSC-derived hepatocytes using the EnzyChromTM NAD+/NADH assay kit (BioAssay Systems). Samples were homogenized in NAD+ and NADH extraction buffers. Each extract was heated at 60 °C for 5 min, neutralized with the opposite extraction buffer, and then centrifuged at 13,000 × g for 5 min. Forty microliters of each supernatant was mixed with working reagent and then incubated at room temperature for 15 min.
The lactate level was quantified from the medium cultured in fibroblasts, hiPSCs, and hiPSC-derived hepatocytes using the EnzyChromTM l-lactate assay kit (BioAssay Systems). The culture medium was harvested at 24 h after incubation to measure the lactate secretion level. The harvested sample and working reagent were mixed in a 96-well plate and then incubated for 20 min.
Cellular ATP levels were measured with an EnzyLightTM ATP assay kit (BioAssay Systems). Approximately 5,000 cells were replated to allow attachment to a 96-well plate for 6 h. After removing the medium, the working reagent was immediately added to the cell plate. After 1 min, the luciferase activity was measured.
ATP production rate in mitochondria was measured as described previously (32). Briefly, cells were permeabilized and suspended in Medium A (20 mm HEPES, 10 mm MgCl2, 250 mm sucrose, pH 7.3). Ninety microliters of the reaction buffer (0.15 mm Ap5A, 10 mm glutamate, 10 mm malate, 10 μm rotenone, 70 μm luciferin, and 0.05 μg/ml luciferase) was added to each sample (10 μl), and the luminescence was read. After that, 200 μm ADP was added, and luminescence was read for 2 min in kinetic mode.
Using the fluorometric method, glucose uptake was measured with an EnzyChromTM glucose assay kit (BioAssay Systems). The culture medium containing 25.5 mm glucose was harvested at 24 h after incubation to measure glucose levels. The harvested sample and working reagent were mixed in a 96-well plate and then incubated at room temperature for 30 min. The relative fluorescent unit was read at 530 nm for excitation and 585 nm for emission. Relative fluorescent unit was normalized to the whole cell lysate protein in each sample and expressed as a decrease in glucose in the medium per h. To determine the lactate turnover rate with the colorimetric method using EnzyChromTM l-lactate assay kit (BioAssay Systems), medium was collected at 1–3 h after the addition of sodium l-lactate (250 mm) to the culture medium supplemented with 1 mm cAMP. The harvested sample and working reagent were mixed in a 96-well plate and then incubated for 20 min.
The OD, fluorescence, and luminescence in each sample were read on a Wallac 1420 Victor2 microplate reader. The concentrations were calculated from the OD and luminescence values and finally determined by normalizing to the whole cell lysate protein in each sample.
mtDNA Copy Number Assay
Whole genomic DNA was extracted from cell samples with a G-DEXTM genomic DNA extraction kit (Intron Biotechnology). The mtDNA copy number was measured using a TaqMan® copy number assay (Life Technologies, Inc.) according to the manufacturer's instructions. Primers and probes for β-actin, a nuclear DNA (nDNA) target gene, and cytochrome c oxidase I, a mtDNA target gene, used for this assay were designed as described previously (33). The reaction mixture was prepared in a total volume of 20 μl by mixing 2× TaqMan® genotyping master mix, 20× TaqMan copy number assay working stock, 20× TaqMan® copy number reference assay RNase P (Life Technologies, Inc.), and 20 μg of genomic DNA. This assay was performed on a CFX ConnectTM real time system. The reaction conditions were 95 °C for 10 min followed by 40 cycles of 95 °C for 15 s and 60 °C for 60 s. For comparative analyses, the mtDNA copy number was normalized to the nDNA copy number and then expressed as a fold-change. The ΔCt value was calculated as the difference between the nDNA Ct and the mtDNA Ct. Fold changes in the copy number between the nDNA Ct and the mtDNA Ct were determined using the formula 2−(SΔCt − CΔCt).
Transmission Electron Microscopy
Cells were fixed in 3% glutaraldehyde in 0.1 m cacodylate buffer, pH 7.2, containing 0.1% CaCl2 for 2 h at room temperature. After washing five times with 0.1 m cacodylate buffer at 4 °C, the cells were postfixed in 1% OsO4 in 0.1 m cacodylate buffer containing 0.1% CaCl2 at 4 °C for 2 h. After rinsing with cold distilled water, the cells were dehydrated slowly in an ethanol series and propylene oxide at 4 °C. The samples were embedded in Embed-812 (EMS, Fort Washington, PA). After polymerization of the resin at 60 °C for 36 h, serial sections were cut with a diamond knife on an ULTRACUT UC7 ultramicrotome (Leica, Nussloch, Germany) and mounted on Formvar-coated slot grids. Sections were stained with 4% uranyl acetate for 10 min and lead citrate for 7 min. The sections were observed using a Tecnai G2 Spirit Twin transmission electron microscope (FEI Co., Hillsboro, OR).
AMPK Knockdown
The small interfering RNA (siRNA) duplexes against AMPK (Life Technologies, Inc., AM51331-769) were transfected into hepatocytes using Lipofectamine RNAiMAX reagents (Life Technologies, Inc.) according to the manufacturer's instructions. Briefly, hepatocytes were dissociated into single cells by serial treatment of collagenase I (Life Technologies, Inc.) and Accutase (Thermo Fisher Scientific, Waltham, MA) for 15 min, respectively. siRNA was mixed with Lipofectamine reagent in the Opti-MEM medium (Life Technologies, Inc.) and then added to culture media containing hepatocytes (250 cells/mm2) to be 10 nm at a final concentration. After 12 h, the medium was replaced with HCM, and cells were further cultured for 24 h.
Statistical Analysis
All data are presented as the mean ± S.E., and p values were evaluated by Student's t test using GraphPad Prism 5 (GraphPad Software, Inc., La Jolla, CA).
Results
Generation of DMRC-iPSCs
A male patient with DMRC was diagnosed with infantile metabolic acidosis (lactic acidosis) and liver failure (Table 2) and died at 5 months old. The patient had a point mutation in the mitochondrial genome (homoplasmic m.3398T→C)-encoded MTND1 gene (Fig. 1A) (29). Of the 20 iPSC lines established from the patient's fibroblasts, two lines (DMRC-iPSC 13 and DMRC-iPSC 15) were used in this study. The cell lines had the typical morphology of pluripotent stem cells and expressed pluripotency markers at the mRNA (Fig. 1B) and protein (Fig. 1C) levels. The promoter regions of the pluripotent marker genes OCT4, REX1, and NANOG were demethylated (Fig. 1D), representing epigenetic reprogramming. No karyotype abnormality was detected in the iPSC lines (Fig. 1E). EB formation was employed to test the differentiation potential of pluripotent stem cells because EB contains various cell types of three germ layers. Like WT-EBs, DMRC-EBs transcribed three germ layer-related genes (ectoderm, paired box 6 (PAX6), and Zic family member 1 (ZIC1); mesoderm, brachyury (T), and GATA-binding protein 2 (GATA2); endoderm, sex-determining regions Y-Box 17 (SOX17), and forkhead box protein A2 (FOXA2)) (Fig. 1F). In vivo differentiation potential of iPSCs is commonly evaluated by teratoma formation after subcutaneous injection of iPSCs into immunodeficient mice. Teratomas originated from DMRC-iPSCs contained various tissues of three germ layers (Fig. 1G).
TABLE 2.
Patient characteristics
The following abbreviations are used: AST, aspartate aminotransferase; ALT, alanine aminotransferase; INR, international normalized ratio; PTT, partial thromboplastin time.
| Patient | Normal range | |
|---|---|---|
| AST/AST, IU/liter | 202/70 | <40/<40 |
| Total bilirubin, mg/dl | 13.4 | 0.2–1.2 |
| Direct bilirubin, mg/dl | 8.3 | <0.5 |
| Serum albumin, g/dl | 2.3 | 3.3–5.2 |
| Prothrombin time, seconds (INR) | 27.0 (2.50) | 10–13 (0.8–1.3) |
| Activated PTT, seconds | 51.4 | 25–35 |
| Lactate, mm | 13.9 | 0.9–1.7 |
| Pyruvate, mm | 0.48 | 0.045–0.079 |
FIGURE 1.

Generation of DMRC-iPSCs. A, homoplasmic mutation in DMRC fibroblasts (FIB) and DMRC-iPSCs. B, transcriptional expression of pluripotency-associated genes in DMRC-iPSCs. C, expression of pluripotency-associated proteins in DMRC-iPSCs. Two DMRC-iPSC lines expressed pluripotency-associated markers, including OCT4, SOX2, NANOG, SSEA4, TRA-1–60, and TRA-1–81. Scale bar, 200 μm. D, reprogramming of DNA methylation in DMRC-iPSCs. The promoter regions of these genes were highly demethylated in DMRC-iPSCs compared with DMRC fibroblasts. E, normal karyotypes of DMRC-iPSCs. F, expression of marker genes of the three germ layers in DMRC-EBs. Marker genes of three germ layers were expressed in DMRC-EBs. G, teratomas derived from DMRC-iPSCs. The teratomas formed after subcutaneous injection of DMRC-iPSCs contained diverse tissues of three germ layers. Scale bar, 50 μm. FOXA2, forkhead box protein A2; GATA2, GATA-binding protein 2; PAX6, paired box 6; SOX17, sex-determining regions Y-BOX 17; T, brachyury.
Mitochondrial Physiology in hiPSCs
The mitochondrial morphology of DMRC fibroblasts and DMRC-iPSCs were observed with electron microscopy (EM) to assess whether a mutation in the MTND1 gene affected mitochondrial structure. Mitochondria in DMRC fibroblasts had a smaller and thinner size than normal fibroblasts, and their cristae were poorly developed (Fig. 2A). However, no difference was detected in the mitochondrial appearance between WT-iPSCs and DMRC-iPSCs (Fig. 2B). Phosphorylation of dynamin-related protein 1 (DRP1), which regulates mitochondrial fission (34, 35) was enhanced in DMRC fibroblasts compared with the control (Fig. 2C). An increase in p-DRP1 likely led to the smaller size and immature cristae in DMRC fibroblasts. The mtDNA copy number was significantly decreased in DMRC fibroblasts (Fig. 2D) but not in DMRC-iPSCs (Fig. 2E).
FIGURE 2.
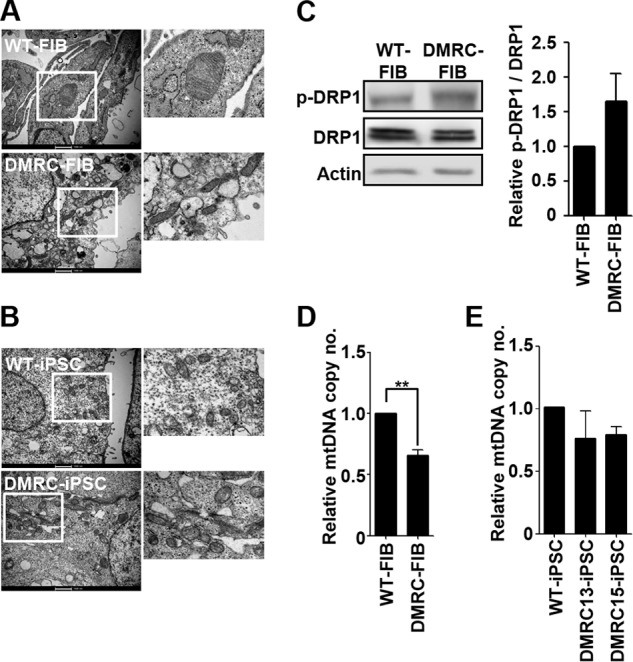
Mitochondrial physiology in DMRC fibroblasts and DMRC-iPSCs. A, mitochondrial morphology in WT and DMRC fibroblasts. Mitochondria of DMRC fibroblasts were smaller and poorly developed compared with WT fibroblasts. Scale bar, 1000 nm. B, mitochondrial morphology of WT- and DMRC-iPSCs. No differences were observed in the mitochondrial morphology between WT- and DMRC-iPSCs. Scale bar, 1000 nm. C, increment of p-DRP1 (Se-616) in DMRC fibroblasts. The ratio of p-DRP1/DRP1 was quantified (right, n = 3). D, mtDNA copy number of DMRC fibroblasts. mtDNA copy number decreased in DMRC fibroblasts. **, p < 0.01 (n = 3). E, mtDNA copy number of DMRC-iPSCs (n = 3). FIB, fibroblasts; mtDNA, mitochondrial DNA; EM, electron microscopy; DRP1, dynamin-related protein 1.
Hepatic Differentiation
The major symptoms of the DMRC patient were lactic acidosis and liver failure (Table 2). To elucidate the causes of liver failure in the patient in vitro, WT-iPSCs and DMRC-iPSCs were differentiated into hepatocytes. Like WT hepatocytes, hepatocytes derived from DMRC-iPSCs (DMRC hepatocytes) expressed hepatic marker genes (Fig. 3B). The differentiation efficiency to hepatocytes was high, over 90% of albumin-positive cells, in both WT- and DMRC-iPSCs (Fig. 3C). The expression and secretion levels of albumin in DMRC hepatocytes were similar to those of WT hepatocytes (Fig. 3, D and E). Intriguingly, DMRC hepatocytes showed a lower competence in glycogen storage than WT hepatocytes. Periodic acid-Schiff (PAS) stains were relatively weak in DMRC hepatocytes compared with WT hepatocytes (Fig. 3F). The levels of glycogen in DMRC hepatocytes were significantly lower than WT hepatocytes (Fig. 3G).
Dysfunction of Mitochondria in DMRC Hepatocytes
An EM analysis revealed abnormal mitochondrial structures in DMRC hepatocytes (Fig. 4A). Unlike WT hepatocytes, the mitochondria in DMRC hepatocytes were smaller and had a round shape. Consistent with the abnormal morphology, the level of phosphorylation on Ser-616 of DRP1 was enhanced in DMRC hepatocytes (Fig. 4B). Thus, mitochondrial fragmentation appears to occur in DMRC hepatocytes, thereby leading to the aberrant morphologies shown in Fig. 4A. Additionally, DMRC hepatocytes retained a lower mtDNA copy number than WT hepatocytes (Fig. 4C).
FIGURE 4.
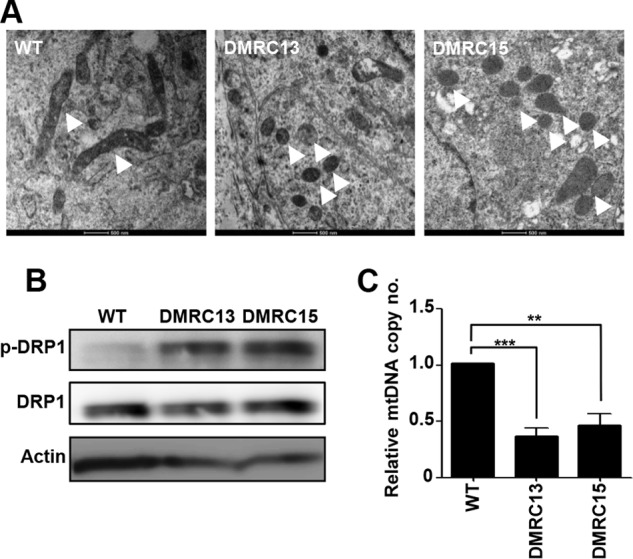
Mitochondrial physiology in DMRC hepatocytes. A, mitochondrial morphology in WT and DMRC hepatocytes. Mitochondria were fragmented in DMRC hepatocytes. Mitochondria were indicated by white arrowheads. Scale bar, 500 nm. B, increment of p-DRP1 in DMRC hepatocytes. C, reduction of mtDNA copy number in DMRC hepatocytes. **, p < 0.01; ***, p < 0.001 (n = 3).
Next, we examined OXPHOS-related mitochondrial metabolism in DMRC fibroblasts and DMRC derivatives. To determine whether a mutation in the MTND1 gene (m.3398T→C) influences the activity of complex I, the NADH degradation rate was measured in fibroblasts and hiPSC-derived hepatocytes. The activity of complex I was significantly decreased in DMRC fibroblasts (Fig. 5A) and DMRC hepatocytes (Fig. 5B) compared with WT cells. This lower activity of complex I consequently caused decreases of ATP production rate in both DMRC fibroblasts (Fig. 5C) and DMRC hepatocytes (Fig. 5D). Also, cellular ATP levels were reduced in both DMRC fibroblasts (Fig. 5E) and DMRC hepatocytes (Fig. 5F). The lower ATP levels led to enhanced AMPK phosphorylation in DMRC hepatocytes (Fig. 5G). Therefore, our data demonstrate that a mutation in complex I results in abnormal morphology and low production of cellular ATP in DMRC hepatocytes.
FIGURE 5.

Aberrant oxidative phosphorylation in DMRC hepatocytes. A, decrease of complex I activity in DMRC fibroblasts. **, p < 0.01 (n = 3). B, reduction of complex I activity in DMRC hepatocytes. *, p < 0.05 (n = 3). C, decreased ATP production rate in DMRC fibroblasts. **, p < 0.01 (n = 3). D, reduction of ATP production rate in DMRC hepatocytes. *, p < 0.05 (n = 3). E, decrease of cellular ATP levels in DMRC fibroblasts. *, p < 0.05 (n = 3). F, reduced cellular ATP levels in DMRC hepatocytes. *, p < 0.05 (n = 3). G, enhanced p-AMPK levels in DMRC hepatocytes.
Aberrant Metabolism in DMRC Hepatocytes
In general, complex I in mitochondria degrades NADH into NAD+, and the resultant electrons are transported to the next complex, thereby resulting in a proton gradient across the mitochondrial inner membrane. Thus, we can hypothesize that decreased complex I activity leads to a reduction in the NADH degradation rate. In fact, NAD+ levels were significantly reduced, whereas NADH levels were remarkably enhanced in DMRC fibroblasts compared with WT fibroblasts (Fig. 6A, left panel). Consequently, DMRC fibroblasts showed a lower NAD+/NADH ratio than WT fibroblasts (Fig. 6A, right panel). Additionally, DMRC hepatocytes had a lower NAD+/NADH ratio than WT hepatocytes (Fig. 6B). In contrast to those of differentiated cells, no difference was detected in the NAD+/NADH ratio between WT- and DMRC-iPSCs (data not shown). The secreted lactate level in DMRC fibroblasts increased up to 35% compared with that of WT fibroblasts (Fig. 6C, left histogram). However, no significant differences were observed in the secreted lactate level between WT- and DMRC-iPSCs (data not shown). Intriguingly, no difference was detected in the secreted lactate level between WT and DMRC hepatocytes (Fig. 6C, right histogram). Thus, the imbalance in NAD+ and NADH appears to be insufficient to stimulate lactate production in DMRC hepatocytes.
FIGURE 6.

Abnormal metabolism in DMRC hepatocytes. A, decrease of the NAD+/NADH ratio in DMRC fibroblasts. *, p < 0.05; **, p < 0.01; ***, p < 0.001 (n = 3). B, reduction of the NAD+/NADH ratio in DMRC hepatocytes. **, p < 0.01; ***, p < 0.001 (n = 3). C, lactate secretion in DMRC fibroblasts (left) and DMRC hepatocytes (right). Lactate secretion was increased in DMRC fibroblasts but not in DMRC hepatocytes. *, p < 0.05 (n = 3). D, glucose uptake in DMRC fibroblasts (left) and DMRC hepatocytes (right) using RI. Both DMRC fibroblasts and hepatocytes showed increased glucose uptake. **, p < 0.01; ***, p < 0.001 (n = 3). E, relative expression of lactate metabolism-associated genes in DMRC hepatocytes. Transcriptional expression of Glc-6-Pase, FBP1, PEPCK, and AGXT was significantly decreased in DMRC hepatocytes. *, p < 0.05; **, p < 0.01; ***, p < 0.001 (n = 4). F, lactate uptake in DMRC hepatocytes using RI. DMRC hepatocytes showed decreased lactate uptake. ***, p < 0.001 (n = 3). G6Pase, glucose-6-phosphatase; FBP1, fructose-1, 9-glyoxylate aminotransferase. PEPCK, phosphoenolpyruvate carboxykinase; AGXT, alanine-glyoxylate aminotransferase.
To estimate glucose consumption, glucose uptake was measured in DMRC fibroblasts and DMRC hepatocytes using [14C]glucose. Glucose uptake was increased in DMRC fibroblasts compared with WT fibroblasts (Fig. 6D, left histogram). DMRC hepatocytes also showed a higher glucose uptake than WT hepatocytes (Fig. 6D, right histogram). Fluorometric assay for glucose uptake represented the same results of RI experiments (data not shown). These results indicate compensation by glycolysis for the decrease in cellular ATP in DMRC fibroblasts and hepatocytes. Nonetheless, the transcription of lactate metabolism-related genes, such as alanine-glyoxylate aminotransferase (AGXT), glucose-6-phosphatase (Glc-6-Pase), phosphoenolpyruvate carboxykinase (PEPCK), and fructose-1,6-bisphosphatase (FBP1), was down-regulated in DMRC hepatocytes (Fig. 6E). In lactate uptake experiments using [14C]lactic acid, DMRC hepatocytes showed a lower lactate turnover rate than WT hepatocytes (Fig. 6F). Colorimetric assay also represented aberrant lactate turnover in DMRC hepatocytes (data not shown). Thus, OXPHOS dysfunction resulted in lactate overproduction and a paucity of lactate turnover in DMRC hepatocytes. Our findings suggest that lactate overproduction and reduced competence of lactate turnover into glucose may have caused lactic acidosis in the DMRC patient.
Effects of AMPK Inhibition on Glycogenesis and Lactate Uptake in DMRC Hepatocytes
To determine whether the reduced glycogen storage and lactate turnover rate in DMRC hepatocytes is associated with an enhanced AMPK level caused by a lower ATP level, AMPK inhibition experiments were performed in DMRC hepatocytes. As a result, AMPK inhibition effectively reduced phosphorylation of AMPK in DMRC hepatocytes (Fig. 7A). ELISA showed reduction of AMPK activity in DMRC hepatocytes, unlike in WT hepatocytes (Fig. 7B). Subsequently, glycogen storage levels were enhanced in DMRC hepatocytes by AMPK inhibition in terms of the phenotype and the quantity (Fig. 7, C and D, respectively). Thus, it is likely that low competence for glycogen storage is associated with activation of the AMPK pathway. Also, lactate metabolism-associated genes such as Glc-6-Pase, FBP1, PEPCK, and AGXT were transcriptionally increased in DMRC hepatocytes, not in WT hepatocytes, by AMPK inhibition (Fig. 7E). Furthermore, AMPK inhibition significantly enhanced the turnover rate of [14C]lactic acid in DMRC hepatocytes (Fig. 7F). These results indicate that enhanced phosphorylation of AMPK leads to lower glycogen storage and dysfunctional lactate turnover in DMRC hepatocytes.
FIGURE 7.

Effects of AMPK inhibition on the metabolism of DMRC hepatocytes. A, reduction of the AMPK phosphorylation level in WT and DMRC hepatocytes by treatment of 25 μm compound C. B, inhibitory effect of compound C on AMPK activity. ***, p < 0.001 (n = 3). C, visualization of glycogen storage after compound C treatment in DMRC hepatocytes. Scale bar, 200 μm. D, recovery of the glycogen level in DMRC hepatocytes following AMPK inhibition. *, p < 0.05; **, p < 0.01 (n = 3). E, activation of lactate metabolism-associated genes in DMRC hepatocytes after compound C treatment. *, p < 0.05; **, p < 0.01; ***, p < 0.001 (n = 3). F, enhanced lactate turnover rate in DMRC hepatocytes by compound C treatment. **, p < 0.01 (n = 3). CC, compound C.
Effects of AMPK Knockdown on Expression of Gluconeogenic Genes in DMRC Hepatocytes
To know whether down-regulation of AMPK influences expression of gluconeogenic genes, siRNA against AMPK was transfected into DMRC hepatocytes. Protein level of AMPK was decreased to ∼50% in DMRC hepatocytes by treatment with AMPK-siRNA (Fig. 8A). Transcripts of AMPK were significantly down-regulated in DMRC hepatocytes (Fig. 8B). Reduction of AMPK expression increased transcriptional expression of lactate metabolism-associated genes in DMRC hepatocytes (Fig. 8C). Taken together, our data solidify that AMPK inhibition may recover lactate uptake in DMRC hepatocytes.
FIGURE 8.

Effects of AMPK knockdown on the expression of gluconeogenic genes in DMRC hepatocytes. A, decreased AMPK protein by siRNA treatment in iPSC-derived hepatocytes. Quantification of band density is shown in the right histogram. AMPK protein level was decreased to ∼50% in iPSC-derived hepatocytes by transfection with AMPK siRNAs. B, reduction of AMPK mRNA level in iPSC-derived hepatocytes by siRNA treatment. *, p < 0.05; **, p < 0.01 (n = 3). C, increased expression of lactate metabolism-associated genes in siRNA-treated DMRC hepatocytes. *, p < 0.05; **, p < 0.01 (n = 3). D, model for lactic acidosis by MTND1 mutation in the DMRC patient. siRNA, small interfering RNA.
Discussion
Here, we demonstrate for the first time that a homoplasmic MTND1 mutation (m.3398T→C) results in suppression of both glycogenesis and gluconeogenesis in DMRC hepatocytes through AMPK signaling. Although it is conceivable that the mutation causes energy depletion by OXPHOS dysfunction and subsequent metabolic changes in hepatocytes, this idea has not yet been tested at molecular and biochemical levels.
Decreases in mitochondrial heteroplasmy in some clones of iPSCs have been observed during reprogramming and long term passaging in recent studies (25, 26). This phenomenon causes difficulties in the modeling of mitochondrial diseases with iPSCs. In our observation, the homoplasmy of the MTND1 mutation was maintained throughout long term cultivation of DMRC-iPSCs (Fig. 1A). Thus, homoplasmic mutations have an advantage in modeling mitochondrial diseases via cellular reprogramming.
The mitochondrial morphology of DMRC-iPSCs was similar to that of WT-iPSCs in appearance (Fig. 2B). This similarity in mitochondrial morphology is thought to be due to a paucity of mitochondrial function in the pluripotent state. In fact, mitochondrial respiration operates poorly in the pluripotent stage because the maturation and replication of mitochondria are suppressed in embryonic stages in mammals (36–40). Additionally, the in vitro and in vivo differentiation potentials of DMRC-iPSCs appeared to be normal, similar to WT-iPSCs (Fig. 1, E and F). Therefore, a defect in complex I caused by a homoplasmic MTND1 mutation does not influence cellular reprogramming and the differentiation competence of hiPSCs into specialized cell types. In contrast to the DMRC-iPSCs, the mitochondria of somatic cells such as DMRC fibroblasts and DMRC hepatocytes showed abnormalities in their morphologies (Figs. 2A and 4A, respectively) and biogenesis (Figs. 2D and 4C, respectively). Mitochondrial dysfunction is often associated with mitochondrial fragmentation by DRP1 phosphorylation (41, 42). Similarly, p-DRP1 was enhanced in DMRC fibroblasts and DMRC hepatocytes (Figs. 2C and 4B, respectively). In addition, the mtDNA copy number was significantly decreased in DMRC fibroblasts and DMRC hepatocytes (Figs. 2D and 4C). This decrease in mtDNA copy number is related to mitochondrial dysfunction (43). Our results demonstrate that a homoplasmic MTND1 mutation contributed to mitochondrial anomalies in morphology and biogenesis.
The pathogenicity of the homoplasmic m.3398T→C mutation on the MTND1 gene found in this patient was so far unknown. Here, we showed that this mutation caused the reduction of complex I activity in DMRC cells (Fig. 5, A and B). Moreover, a decrease of complex I activity led to down-regulation of ATP production in DMRC hepatocytes (Fig. 5D), thereby resulting in the reduction of cellular ATP and the increment of phospho-AMPK Thus, MTND1 mutation appears to be associated with enhanced AMPK activity in hepatocytes.
Lactate is an end product of lactic fermentation, which actively occurs to provide NAD+ to glycolysis by degrading NADH in anaerobic conditions. Because the NADH degradation rate of complex I was decreased in DMRC fibroblasts and DMRC hepatocytes (Fig. 5, A and B), the NAD+/NADH ratio was significantly reduced in DMRC fibroblasts and DMRC hepatocytes (Fig. 6, A and B). This imbalance of NAD+ and NADH may stimulate lactic fermentation (44). As expected, lactate secretion was increased in DMRC fibroblasts (Fig. 6C, left histogram). However, intriguingly, no difference was observed in the lactate secretion level between WT- and DMRC hepatocytes (Fig. 6C, right histogram). The differential lactate secretion levels between fibroblasts and hepatocytes can be explained by the different metabolic characteristics of the respective cell types. In this study, the levels of secreted lactate were different among cell types: more than 4 μmol/day/mg protein in hiPSCs (data not shown), 250–350 nmol/d/mg protein in fibroblasts, and ∼80 nmol/day/mg protein in hepatocytes. Based on these differential levels of secreted lactate, it is expectable that high energy-consuming cell types such as muscles and neurons in DMRC patients may produce much more lactate because of the aberrant NAD+/NADH ratio shown in this study. In fact, the patient subjected to this study represented a higher concentration (13.9 mm) of lactate in the blood as compared with the normal group (Table 2). To more clarify this expectation, differentiation of DMRC-iPSCs into muscle cells or neurons should be carried out.
Lactate molecules secreted from many tissues in the body are converted into glucose molecules in the liver, namely the Cori cycle. This fact indicates that the liver plays a key role in the control of lactate concentration in the bloodstream. Although it was predicted that a paucity of lactate turnover in the liver causes lactic acidosis (45), the molecular mechanisms to explain lactic acidosis remain elusive. In this study, we found decreases in glycogen storage, cellular ATP level, and lactate turnover rate in DMRC hepatocytes. These results provide the possibility that aberrant lactate turnover is attributed to mitochondrial dysfunction in hepatocytes. In general, glycogen storage and the expression of gluconeogenic genes are regulated by AMPK (46, 47). Interestingly, dysfunctions for glycogen storage and lactate turnover in DMRC hepatocytes were ameliorated by AMPK inhibition (Fig. 7). Also, AMPK knockdown increased the expression of glyconeogenic genes in DMRC hepatocytes (Fig. 8). Taken together, it is likely that the lactic acidosis caused by mitochondrial dysfunction results not only from excessive lactate production in energy-consuming cell types but also from reduced capacity of lactate turnover by enhanced AMPK activity in hepatocytes.
Although many drugs, including electron acceptors, antioxidants, and cofactors, such as coenzyme Q10, vitamins, succinate, carnitine, creatine monohydrate, and dichloroacetate, have been developed for the treatment of DMRC patients (48–57), any pharmacologic medication described to date is non-effective. To overcome this limitation for the recovery of mitochondrial respiration, genomic editing tools can be employed. A recent study suggested that heteroplasmy can be reduced below the phenotypic threshold using mitochondrion-targeted TALEN (58).
Here, we identified a mitochondrial defect that is attributed to anomalies in mitochondrial respiration, cellular ATP, and lactate turnover in hepatocytes via cellular reprogramming followed by differentiation. Based on our results, we propose a putative model for lactic acidosis in the DMRC patient (Fig. 8D). Lower ATP production due to MTND1 mutation enhances the AMPK activity. Increased AMPK activity down-regulates expression of gluconeogenic genes. Hence lactate molecules from the blood are not converted to glucose molecules in DMRC hepatocytes. In conclusion, reduced competence of lactate turnover in liver caused by AMPK activation may account for lactic acidosis in the patient.
Author Contributions
I. I. and Y. M. H. conceived and designed the study. I. I. performed the majority of the experimental work. M. J. J. helped iPSC generation and maintenance. S. H. L. carried out sampling and taking EM pictures in fibroblasts, iPSCs, and hepatocytes. J. H. C. and H. W. Y. provided DMRC fibroblasts and clinical diagnosis of DMRC patients. I. I., S. J. P., and S. K. worked for radioactive isotope experiments. I. I. and Y. M. H. wrote the manuscript.
Acknowledgment
We thank Sora Oh for helping maintenance of hiPSCs.
This work was supported by the National Research Foundation of Korea, Stem Cell Program Grants 2011-0019509 and 2012M3A9C7050175 funded by Ministry of Science, ICT, and Future Planning, and Grant A120275 from Korea Healthcare Technology R&D Project, Ministry of Health and Welfare, Republic of Korea. The authors declare that they have no conflicts of interest with the contents of this article.
- MRCC
- mitochondrial respiratory chain complex
- AGXT
- alanine-glyoxylate aminotransferase
- AMPK
- AMP-activated protein kinase
- DMRC
- defective mitochondrial respiratory chain complex
- Glc-6-Pase
- glucose-6-phosphatase
- iPSC
- induced pluripotent stem cell
- LHON
- Leber hereditary optic neuropathy
- MELAS
- mitochondrial myopathy, encephalopathy, lactic acidosis and stroke-like episodes
- OXPHOS
- oxidative phosphorylation
- PAS
- periodic acid-Schiff
- PEPCK
- phosphoenolpyruvate carboxykinase
- EB
- embryoid body
- hiPSC
- human iPSC
- RI
- radioactive isotope
- HCM
- hepatocyte culture medium
- Ap5A
- P1,P5-di(adenosine 5')-pentaphosphate.
References
- 1.Hoppel C. L., Kerr D. S., Dahms B., and Roessmann U. (1987) Deficiency of the reduced nicotinamide adenine dinucleotide dehydrogenase component of complex I of mitochondrial electron transport. Fatal infantile lactic acidosis and hypermetabolism with skeletal-cardiac myopathy and encephalopathy. J. Clin. Invest. 80, 71–77 [DOI] [PMC free article] [PubMed] [Google Scholar]
- 2.Loeffen J. L., Smeitink J. A., Trijbels J. M., Janssen A. J., Triepels R. H., Sengers R. C., and van den Heuvel L. P. (2000) Isolated complex I deficiency in children: clinical, biochemical and genetic aspects. Hum. Mutat. 15, 123–134 [DOI] [PubMed] [Google Scholar]
- 3.Triepels R. H., Van Den Heuvel L. P., Trijbels J. M., and Smeitink J. A. (2001) Respiratory chain complex I deficiency. Am. J. Med. Genet. 106, 37–45 [DOI] [PubMed] [Google Scholar]
- 4.Nussbaum R. L. (2005) Mining yeast in silico unearths a golden nugget for mitochondrial biology. J. Clin. Invest. 115, 2689–2691 [DOI] [PMC free article] [PubMed] [Google Scholar]
- 5.Wallace D. C., Singh G., Lott M. T., Hodge J. A., Schurr T. G., Lezza A. M., Elsas L. J. 2nd., and Nikoskelainen E. K. (1988) Mitochondrial DNA mutation associated with Leber's hereditary optic neuropathy. Science 242, 1427–1430 [DOI] [PubMed] [Google Scholar]
- 6.Taylor R. W., and Turnbull D. M. (2005) Mitochondrial DNA mutations in human disease. Nat. Rev. Genet. 6, 389–402 [DOI] [PMC free article] [PubMed] [Google Scholar]
- 7.von Kleist-Retzow J. C., Cormier-Daire V., de Lonlay P., Parfait B., Chretien D., Rustin P., Feingold J., Rötig A., and Munnich A. (1998) A high rate (20%-30%) of parental consanguinity in cytochrome-oxidase deficiency. Am. J. Hum. Genet. 63, 428–435 [DOI] [PMC free article] [PubMed] [Google Scholar]
- 8.Leigh D. (1951) Subacute necrotizing encephalomyelopathy in an infant. J. Neurol. Neurosurg. Psychiatry 14, 216–221 [DOI] [PMC free article] [PubMed] [Google Scholar]
- 9.Leber T. (1871) Ueber hereditaere und congenital angelegte sehnervenleiden. Graefes Arch. Clin. Exp. Ophthalmol. 17, 249–291 [Google Scholar]
- 10.Pavlakis S. G., Phillips P. C., DiMauro S., De Vivo D. C., and Rowland L. P. (1984) Mitochondrial myopathy, encephalopathy, lactic acidosis, and strokelike episodes: a distinctive clinical syndrome. Ann. Neurol. 16, 481–488 [DOI] [PubMed] [Google Scholar]
- 11.Valentino M. L., Barboni P., Ghelli A., Bucchi L., Rengo C., Achilli A., Torroni A., Lugaresi A., Lodi R., Barbiroli B., Dotti M., Federico A., Baruzzi A., and Carelli V. (2004) The ND1 gene of complex I is a mutational hot spot for Leber's hereditary optic neuropathy. Ann. Neurol. 56, 631–641 [DOI] [PubMed] [Google Scholar]
- 12.Carelli V., Rugolo M., Sgarbi G., Ghelli A., Zanna C., Baracca A., Lenaz G., Napoli E., Martinuzzi A., and Solaini G. (2004) Bioenergetics shapes cellular death pathways in Leber's hereditary optic neuropathy: a model of mitochondrial neurodegeneration. Biochim. Biophys. Acta 1658, 172–179 [DOI] [PubMed] [Google Scholar]
- 13.Blakely E. L., de Silva R., King A., Schwarzer V., Harrower T., Dawidek G., Turnbull D. M., and Taylor R. W. (2005) LHON/MELAS overlap syndrome associated with a mitochondrial MTND1 gene mutation. Eur. J. Hum. Genet. 13, 623–627 [DOI] [PubMed] [Google Scholar]
- 14.Jaksch M., Hofmann S., Kaufhold P., Obermaier-Kusser B., Zierz S., and Gerbitz K. D. (1996) A novel combination of mitochondrial tRNA and ND1 gene mutations in a syndrome with MELAS, cardiomyopathy, and diabetes mellitus. Hum. Mutat. 7, 358–360 [DOI] [PubMed] [Google Scholar]
- 15.Chen Y., Liao W. X., Roy A. C., Loganath A., and Ng S. C. (2000) Mitochondrial gene mutations in gestational diabetes mellitus. Diabetes Res. Clin. Pract. 48, 29–35 [DOI] [PubMed] [Google Scholar]
- 16.Tang S., Batra A., Zhang Y., Ebenroth E. S., and Huang T. (2010) Left ventricular noncompaction is associated with mutations in the mitochondrial genome. Mitochondrion 10, 350–357 [DOI] [PubMed] [Google Scholar]
- 17.Takahashi K., and Yamanaka S. (2006) Induction of pluripotent stem cells from mouse embryonic and adult fibroblast cultures by defined factors. Cell 126, 663–676 [DOI] [PubMed] [Google Scholar]
- 18.Takahashi K., Tanabe K., Ohnuki M., Narita M., Ichisaka T., Tomoda K., and Yamanaka S. (2007) Induction of pluripotent stem cells from adult human fibroblasts by defined factors. Cell 131, 861–872 [DOI] [PubMed] [Google Scholar]
- 19.Yu J., Vodyanik M. A., Smuga-Otto K., Antosiewicz-Bourget J., Frane J. L., Tian S., Nie J., Jonsdottir G. A., Ruotti V., Stewart R., Slukvin I. I., and Thomson J. A. (2007) Induced pluripotent stem cell lines derived from human somatic cells. Science 318, 1917–1920 [DOI] [PubMed] [Google Scholar]
- 20.Chamberlain S. J., Li X.-J., and Lalande M. (2008) Induced pluripotent stem (iPS) cells as in vitro models of human neurogenetic disorders. Neurogenetics 9, 227–235 [DOI] [PubMed] [Google Scholar]
- 21.Dimos J. T., Rodolfa K. T., Niakan K. K., Weisenthal L. M., Mitsumoto H., Chung W., Croft G. F., Saphier G., Leibel R., Goland R., Wichterle H., Henderson C. E., and Eggan K. (2008) Induced pluripotent stem cells generated from patients with ALS can be differentiated into motor neurons. Science 321, 1218–1221 [DOI] [PubMed] [Google Scholar]
- 22.Park I.-H., Arora N., Huo H., Maherali N., Ahfeldt T., Shimamura A., Lensch M. W., Cowan C., Hochedlinger K., and Daley G. Q. (2008) Disease-specific induced pluripotent stem cells. Cell 134, 877–886 [DOI] [PMC free article] [PubMed] [Google Scholar]
- 23.Park I.-H., Zhao R., West J. A., Yabuuchi A., Huo H., Ince T. A., Lerou P. H., Lensch M. W., and Daley G. Q. (2008) Reprogramming of human somatic cells to pluripotency with defined factors. Nature 451, 141–146 [DOI] [PubMed] [Google Scholar]
- 24.Suhr S. T., Chang E. A., Tjong J., Alcasid N., Perkins G. A., Goissis M. D., Ellisman M. H., Perez G. I., and Cibelli J. B. (2010) Mitochondrial rejuvenation after induced pluripotency. PLoS One 5, e14095. [DOI] [PMC free article] [PubMed] [Google Scholar]
- 25.Folmes C. D., Martinez-Fernandez A., Perales-Clemente E., Li X., McDonald A., Oglesbee D., Hrstka S. C., Perez-Terzic C., Terzic A., and Nelson T. J. (2013) Disease-causing mitochondrial heteroplasmy segregated within induced pluripotent stem cell clones derived from a patient with MELAS. Stem Cells 31, 1298–1308 [DOI] [PMC free article] [PubMed] [Google Scholar]
- 26.Cherry A. B., Gagne K. E., McLoughlin E. M., Baccei A., Gorman B., Hartung O., Miller J. D., Zhang J., Zon R. L., Ince T. A., Neufeld E. J., Lerou P. H., Fleming M. D., Daley G. Q., and Agarwal S. (2013) Induced pluripotent stem cells with a mitochondrial DNA deletion. Stem Cells 31, 1287–1297 [DOI] [PMC free article] [PubMed] [Google Scholar]
- 27.Hämäläinen R. H., Manninen T., Koivumäki H., Kislin M., Otonkoski T., and Suomalainen A. (2013) Tissue- and cell-type-specific manifestations of heteroplasmic mtDNA 3243A→G mutation in human induced pluripotent stem cell-derived disease model. Proc. Natl. Acad. Sci. U.S.A. 110, E3622–E3630 [DOI] [PMC free article] [PubMed] [Google Scholar]
- 28.Kodaira M., Hatakeyama H., Yuasa S., Seki T., Egashira T., Tohyama S., Kuroda Y., Tanaka A., Okata S., Hashimoto H., Kusumoto D., Kunitomi A., Takei M., Kashimura S., Suzuki T., et al. (2015) Impaired respiratory function in MELAS-induced pluripotent stem cells with high heteroplasmy levels. FEBS Open Bio 5, 219–225 [DOI] [PMC free article] [PubMed] [Google Scholar]
- 29.Park S. W., Kim J., Park J. L., Ko J. Y., Im I., Do H. S., Kim H., Tran N. T., Lee S. H., Kim Y. S., Cho Y. S., Lee D. R., and Han Y. M. (2014) Variable allelic expression of imprinted genes in human pluripotent stem cells during differentiation into specialized cell types in vitro. Biochem. Biophys. Res. Commun. 446, 493–498 [DOI] [PubMed] [Google Scholar]
- 30.Choi S. M., Kim Y., Shim J. S., Park J. T., Wang R.-H., Leach S. D., Liu J. O., Deng C., Ye Z., and Jang Y.-Y. (2013) Efficient drug screening and gene correction for treating liver disease using patient-specific stem cells. Hepatology 57, 2458–2468 [DOI] [PMC free article] [PubMed] [Google Scholar]
- 31.Ogawa S., Surapisitchat J., Virtanen C., Ogawa M., Niapour M., Sugamori K. S., Wang S., Tamblyn L., Guillemette C., Hoffmann E., Zhao B., Strom S., Laposa R. R., Tyndale R. F., Grant D. M., and Keller G. (2013) Three-dimensional culture and cAMP signaling promote the maturation of human pluripotent stem cell-derived hepatocytes. Development 140, 3285–3296 [DOI] [PMC free article] [PubMed] [Google Scholar]
- 32.Milakovic T., and Johnson G. V. (2005) Mitochondrial respiration and ATP production are significantly impaired in striatal cells expressing mutant huntingtin. J. Biol. Chem. 280, 30773–30782 [DOI] [PubMed] [Google Scholar]
- 33.Masayesva B. G., Mambo E., Taylor R. J., Goloubeva O. G., Zhou S., Cohen Y., Minhas K., Koch W., Sciubba J., Alberg A. J., Sidransky D., and Califano J. (2006) Mitochondrial DNA content increase in response to cigarette smoking. Cancer Epidemiol. Biomarkers Prev. 15, 19–24 [DOI] [PubMed] [Google Scholar]
- 34.Frank S., Gaume B., Bergmann-Leitner E. S., Leitner W. W., Robert E. G., Catez F., Smith C. L., and Youle R. J. (2001) The role of dynamin-related protein 1, a mediator of mitochondrial fission, in apoptosis. Dev. Cell 1, 515–525 [DOI] [PubMed] [Google Scholar]
- 35.Smirnova E., Griparic L., Shurland D. L., and van der Bliek A. M. (2001) Dynamin-related protein Drp1 is required for mitochondrial division in mammalian cells. Mol. Biol. Cell 12, 2245–2256 [DOI] [PMC free article] [PubMed] [Google Scholar]
- 36.Sathananthan H., Pera M., and Trounson A. (2002) The fine structure of human embryonic stem cells. Reprod. Biomed. Online 4, 56–61 [DOI] [PubMed] [Google Scholar]
- 37.Baharvand H., and Matthaei K. I. (2003) The ultrastructure of mouse embryonic stem cells. Reprod. Biomed. Online 7, 330–335 [DOI] [PubMed] [Google Scholar]
- 38.Oh S. K., Kim H. S., Ahn H. J., Seol H. W., Kim Y. Y., Park Y. B., Yoon C. J., Kim D. W., Kim S. H., and Moon S. Y. (2005) Derivation and characterization of new human embryonic stem cell lines: SNUhES1, SNUhES2, and SNUhES3. Stem Cells 23, 211–219 [DOI] [PubMed] [Google Scholar]
- 39.St John J. C., Ramalho-Santos J., Gray H. L., Petrosko P., Rawe V. Y., Navara C. S., Simerly C. R., and Schatten G. P. (2005) The expression of mitochondrial DNA transcription factors during early cardiomyocyte in vitro differentiation from human embryonic stem cells. Cloning Stem Cells 7, 141–153 [DOI] [PubMed] [Google Scholar]
- 40.Cho Y. M., Kwon S., Pak Y. K., Seol H. W., Choi Y. M., Park do J., Park K. S., and Lee H. K. (2006) Dynamic changes in mitochondrial biogenesis and antioxidant enzymes during the spontaneous differentiation of human embryonic stem cells. Biochem. Biophys. Res. Commun. 348, 1472–1478 [DOI] [PubMed] [Google Scholar]
- 41.Duvezin-Caubet S., Jagasia R., Wagener J., Hofmann S., Trifunovic A., Hansson A., Chomyn A., Bauer M. F., Attardi G., Larsson N. G., Neupert W., and Reichert A. S. (2006) Proteolytic processing of OPA1 links mitochondrial dysfunction to alterations in mitochondrial morphology. J. Biol. Chem. 281, 37972–37979 [DOI] [PubMed] [Google Scholar]
- 42.Guillery O., Malka F., Frachon P., Milea D., Rojo M., and Lombès A. (2008) Modulation of mitochondrial morphology by bioenergetics defects in primary human fibroblasts. Neuromuscul. Disord. 18, 319–330 [DOI] [PubMed] [Google Scholar]
- 43.Clay Montier L. L., Deng J. J., and Bai Y. (2009) Number matters: control of mammalian mitochondrial DNA copy number. J. Genet. Genomics 36, 125–131 [DOI] [PMC free article] [PubMed] [Google Scholar]
- 44.Luft F. C. (2001) Lactic acidosis update for critical care clinicians. J. Am. Soc. Nephrol. 12, S15–S19 [PubMed] [Google Scholar]
- 45.Stacpoole P. W. (1993) Lactic acidosis. Endocrinol. Metab. Clin. North Am. 22, 221–245 [PubMed] [Google Scholar]
- 46.Berasi S. P., Huard C., Li D., Shih H. H., Sun Y., Zhong W., Paulsen J. E., Brown E. L., Gimeno R. E., and Martinez R. V. (2006) Inhibition of gluconeogenesis through transcriptional activation of EGR1 and DUSP4 by AMP-activated kinase. J. Biol. Chem. 281, 27167–27177 [DOI] [PubMed] [Google Scholar]
- 47.Carling D., and Hardie D. G. (1989) The substrate and sequence specificity of the AMP-activated protein kinase. Phosphorylation of glycogen synthase and phosphorylase kinase. Biochim. Biophys. Acta 1012, 81–86 [DOI] [PubMed] [Google Scholar]
- 48.Eleff S., Kennaway N. G., Buist N. R., Darley-Usmar V. M., Capaldi R. A., Bank W. J., and Chance B. (1984) 31P NMR study of improvement in oxidative phosphorylation by vitamins K3 and C in a patient with a defect in electron transport at complex III in skeletal muscle. Proc. Natl. Acad. Sci. U.S.A. 81, 3529–3533 [DOI] [PMC free article] [PubMed] [Google Scholar]
- 49.Frei B., Kim M. C., and Ames B. N. (1990) Ubiquinol-10 is an effective lipid-soluble antioxidant at physiological concentrations. Proc. Natl. Acad. Sci. U.S.A. 87, 4879–4883 [DOI] [PMC free article] [PubMed] [Google Scholar]
- 50.Chen R. S., Huang C. C., and Chu N. S. (1997) Coenzyme Q10 treatment in mitochondrial encephalomyopathies. Short-term double-blind, crossover study. Eur. Neurol. 37, 212–218 [DOI] [PubMed] [Google Scholar]
- 51.Mowat D., Kirby D. M., Kamath K. R., Kan A., Thorburn D. R., and Christodoulou J. (1999) Respiratory chain complex III [correction of complex] in deficiency with pruritus: a novel vitamin responsive clinical feature. J. Pediatr. 134, 352–354 [DOI] [PubMed] [Google Scholar]
- 52.Di Rocco M., Lamba L. D., Minniti G., Caruso U., and Naito E. (2000) Outcome of thiamine treatment in a child with Leigh disease due to thiamine-responsive pyruvate dehydrogenase deficiency. Eur. J. Paediatr. Neurol. 4, 115–117 [DOI] [PubMed] [Google Scholar]
- 53.Oguro H., Iijima K., Takahashi K., Nagai A., Bokura H., Yamaguchi S., and Kobayashi S. (2004) Successful treatment with succinate in a patient with MELAS. Intern. Med. 43, 427–431 [DOI] [PubMed] [Google Scholar]
- 54.Hart P. E., Lodi R., Rajagopalan B., Bradley J. L., Crilley J. G., Turner C., Blamire A. M., Manners D., Styles P., Schapira A. H., and Cooper J. M. (2005) Antioxidant treatment of patients with Friedreich ataxia: four-year follow-up. Arch. Neurol. 62, 621–626 [DOI] [PubMed] [Google Scholar]
- 55.Kornblum C., Schröder R., Müller K., Vorgerd M., Eggers J., Bogdanow M., Papassotiropoulos A., Fabian K., Klockgether T., and Zange J. (2005) Creatine has no beneficial effect on skeletal muscle energy metabolism in patients with single mitochondrial DNA deletions: a placebo-controlled, double-blind 31P-MRS crossover study. Eur. J. Neurol. 12, 300–309 [DOI] [PubMed] [Google Scholar]
- 56.Stacpoole P. W., Kerr D. S., Barnes C., Bunch S. T., Carney P. R., Fennell E. M., Felitsyn N. M., Gilmore R. L., Greer M., Henderson G. N., Hutson A. D., Neiberger R. E., O'Brien R. G., Perkins L. A., Quisling R. G., et al. (2006) Controlled clinical trial of dichloroacetate for treatment of congenital lactic acidosis in children. Pediatrics 117, 1519–1531 [DOI] [PubMed] [Google Scholar]
- 57.Lee W. S., and Sokol R. J. (2007) Liver disease in mitochondrial disorders. Semin. Liver Dis. 27, 259–273 [DOI] [PMC free article] [PubMed] [Google Scholar]
- 58.Bacman S. R., Williams S. L., Pinto M., Peralta S., and Moraes C. T. (2013) Specific elimination of mutant mitochondrial genomes in patient-derived cells by mitoTALENs. Nat. Med. 19, 1111–1113 [DOI] [PMC free article] [PubMed] [Google Scholar]