

Abstract
Aging is the largest risk factor for Alzheimer’s disease (AD). Patients with Down syndrome (DS) develop symptoms consistent with early-onset AD, suggesting that overexpression of chromosome 21 genes such as Regulator of Calcineurin 1 (RCAN1) plays a role in AD pathogenesis. RCAN1 levels are increased in the brain of DS and AD patients but also in the human brain with normal aging. RCAN1 has been implicated in several neuronal functions, but whether its increased expression is correlative or causal in the aging-related progression of AD remains elusive. We show that brain-specific overexpression of the human RCAN1.1S isoform in mice promotes early age-dependent memory and synaptic plasticity deficits, tau pathology, and dysregulation of dynamin-related protein 1 (DRP1) activity associated with mitochondrial dysfunction and oxidative stress, reproducing key AD features. Based on these findings, we propose that chronic RCAN1 overexpression during aging alters DRP1-mediated mitochondrial fission and thus acts to promote AD-related progressive neurodegeneration.
Keywords: RCAN1, DRP1, Mitochondria, Fission, Calcineurin, Aging
Introduction
The overwhelming cases of Alzheimer’s disease (AD) occur sporadically, with age as the most significant identified risk factor, afflicting 5 % of adults aged 65 and ~50 % aged 85 years and older [17]. Down syndrome (DS) patients develop accelerated AD, exhibiting symptoms by age 50 [32], which suggests factors involved in DS may also play a role in AD onset. DS is caused by trisomy of chromosome 21, leading to overexpression of genes in this region. RCAN1 is one such gene, found chronically overexpressed in the brain of DS patients as well as sporadic AD patients [56, 61]. RCAN1 expression has been found also to increase normally with age in the human brain [7]. Because RCAN1 is critical for synaptic plasticity and memory [18, 39], the increased RCAN1 levels may contribute to the development of cognitive impairments in normal aging [4] that is exacerbated in AD-related dementia [42]. However, a causal role for RCAN1 overexpression in the age-dependent progression of AD is unknown.
Cumulative damage from elevated levels of cellular reactive oxygen species (ROS) causing oxidative stress has been proposed to underlie the progressive decline of neuronal function in aging [3] and AD [38]. Mitochondria are vital in producing energy for neurons but are also the major source of ROS [50]. Mitochondrial defects associated with increased ROS levels are hallmarks of the aging and AD brain [3, 10, 27, 35]. Normal mitochondrial function requires the tightly coordinated process of fission/fusion to control distribution of mitochondria, mitochondrial integrity, and ROS effects [59]. In AD, fragmented mitochondrial morphology and dysregulation of the mitochondrial fission mediator dynamin-related protein 1 (DRP1) have been observed, indicating disrupted fission/fusion dynamics [36, 37, 58, 59]. DRP1 is regulated by the calcium/calmodulin-dependent phosphatase calcineurin (CaN) [5, 8], which in turn is regulated by RCAN1 [52]. RCAN1 overexpression may, therefore, alter DRP1-mediated mitochondrial fission, leading to the mitochondrial defects seen in aging and AD. Interestingly, RCAN1 overexpression has been linked to oxidative stress and mitochondrial dysfunction [6, 13, 61], but the ability of RCAN1 signaling to regulate mitochondrial activity in vivo in the mammalian brain and whether its dysregulation is a pathogenic mechanism in the age onset of AD have not been explored.
RCAN1 encodes seven exons that can be alternatively spliced and translated to produce at least three protein isoforms in humans: RCAN1.1L, RCAN1.1S, and RCAN1.4 [16, 61]. RCAN1.1L and RCAN1.1S are both translated from RCAN1.1 mRNA, which is transcribed from a glucocorticoid-responsive promoter preceding exon 1 [56]. The long (RCAN1.1L) and short (RCAN1.1S) protein isoforms are produced from upstream and downstream start codons in the mRNA transcript, respectively [61]. In contrast, RCAN1.4 protein is translated from RCAN1.4 mRNA that is transcribed from a CaN-regulated promoter preceding exon 4 [63]. The RCAN1.1L isoform specifically has been found overexpressed in AD and DS brain tissue [16, 56, 61]. RCAN1.1S levels have not been characterized, but overexpression of this isoform in cell culture models has been reported to induce several AD-like pathological features [33, 48, 61]. These findings implicate RCAN1.1S overexpression as a causal factor in AD, but its contribution to AD-related neurodegeneration in an aging mammalian model remains to be demonstrated. Little effort has been focused on examining RCAN1 overexpression in the context of the aging brain, but this is important because AD is age-dependent and clinically defined by dementia, which is a function of impaired brain circuits. Herein, we have addressed these important unresolved questions.
We hypothesized that RCAN1.1S overexpression promotes age-dependent mitochondrial dysfunction leading to synaptic and cognitive impairments related to the progressive neurodegeneration in AD. To test this, we generated a transgenic mouse model with brain-specific overexpression of the human RCAN1.1S isoform. Using this model, we find that chronically increased RCAN1.1S levels cause age-dependent synaptic plasticity and memory impairments, consistent with the age-dependent onset of dementia in AD. Additionally, we find that RCAN1.1S promotes the development of early stage tau pathology, a histological indicator of AD-associated neurodegeneration. Finally, we find that aged RCAN1.1S-overexpressing mice display elevated ROS levels and mitochondrial abnormalities as observed in human AD brains. Collectively, these data support the idea that chronic RCAN1.1S overexpression plays a causal role in the progression of AD-related neurodegeneration.
Materials and methods
Animals
RCAN1 TG mice with brain-specific RCAN1.1S over-expression were generated with a “flox-ON” human RCAN1.1S transgene [20] driven by Camk2α-Cre [57]. Littermates carrying RCAN1.1S but lacking the Cre transgene were used as controls and referred to as WT. Two age groups were tested: “young” adult mice 3–5 months old and “aged” mice 12–14 months old. All experiments were performed using male age-matched TG and WT littermates over 2–3 independent cohorts.
Behavioral assays
Mice were tested for hippocampus-dependent memory using the novel object recognition, Morris water maze (MWM), and associative fear conditioning assays adapted from procedures described previously [18, 19].
Field electrophysiology
E-LTP and L-LTP recordings in the CA3-CA1 circuit of acute 400-μm transverse hippocampal slices were performed as previously described [18, 19]. For MitoQ treatment, slices were incubated with 500 nM MitoQ10 methanesulfonate (gift from Dr. Michael Murphy) for 70 min total, beginning 30 min before L-LTP induction to 40 min after the first HFS, followed by drug washout until the end of the recording. For antimycin treatment, slices were incubated with 2.5 μM antimycin-A (Sigma) for 20 min, followed by E-LTP induction and drug washout for 60 min post-HFS. Vehicle-control slices for each drug condition were treated similarly with an equal volume of DMSO.
Western blotting
Hippocampal tissue from the mouse brain or postmortem cortical samples from AD patients and controls provided by the Brain and Body Donation Program (BBDP) at Banner Sun Health Research Institute in Sun City, AZ (see Supplementary Table S1 for patient demographics) were prepared as whole lysates, mitochondria-enriched fractions, or immunoprecipitates for western blotting using procedures adapted from previous studies [18, 20]. Proteins were resolved using either 18 % Tris–Glycine (RCAN1) or 4–12 % Bis–Tris gradient gels (all others), then blotted and detected using standard techniques [20]. To detect carbonylated proteins, blots were treated using the OxiSelect Protein Carbonyl Immunoblot Kit (Cell Biolabs). Immunoreactive signals were quantified as previously described [20].
Confocal microscopy
Immunohistochemistry of fixed hippocampal slices for fluorescence imaging was adapted from procedures described previously [28]. Oxidative stress in the hippocampus was assessed as previously described using in vivo DHE detection of cellular ROS [22] and MitoSOX detection of mitochondria-derived ROS [34], followed by fixation with 4 % paraformaldehyde. DHE and MitoSOX fluorescence in fixed hippocampal slices were imaged and quantified as pixel intensity per 8000-μm2 area through the CA1 stratum pyramidale or DG granule cell layer. Mitochondrial membrane potential was measured in acute hippocampal slices using the mitochondrial potential-sensitive fluorescent dye JC-1 (Life Technologies), followed by fixation and quantification of the red-to-green JC-1 fluorescence ratio in acquired images [64]. To assess DRP1 localization and mitochondria size, DRP1 and ANT1 staining in fixed hippocampal slices were quantified as pixel intensity or pixel size in predefined areas in CA1.
Real-time PCR
RNA from hippocampi of young and aged TG mice was extracted using TRIzol (Life Technologies) and reverse transcribed into cDNA using the Omniscript RT Kit (Qiagen). Real-time PCR of the cDNA to quantify mRNA levels of the RCAN1.1S transgene normalized to Gapdh mRNA levels was performed on the StepOnePlus real-time PCR system (Applied Biosystems) using TaqMan gene expression assays.
Data analysis
All data are presented as mean values ±SEM. Data were statistically evaluated using SPSS software. Student’s t test or ANOVA was applied as appropriate. Outliers were excluded using Grubb’s method. Significant effects were followed by Tukey’s post hoc testing. For the correlational analyses, Pearson’s correlation coefficient test was used. All statistical tests were two tailed with p < .05 as statistically significant.
Results
RCAN1.1S overexpression in the brain
To establish the relevance of RCAN1.1S overexpression in AD, we examined RCAN1 levels in postmortem AD brain tissue with western blotting. Using protein expressed from plasmid vectors encoding each human RCAN1 isoform to identify observed bands [61], we confirmed previous findings of RCAN1.1L overexpression in AD brains [16, 61] but discovered that RCAN1.1S also was overexpressed compared with age-matched controls (Fig. 1a). Because RCAN1 was reported to accumulate with age in the human brain [7] and aging is the major risk factor for AD [17], we further analyzed the relationship between RCAN1 isoform expression and age. We found that both RCAN1.1L and RCAN1.1S levels positively correlated with age in the control group but not in the AD group (Fig. 1b). While RCAN1.1S shows lower expression than the larger RCAN1.1L isoform, it still represents a significant fraction (~20 %) of total RCAN1.1 levels in the brain (Supplemental Fig. 1a) and, importantly, is elevated in AD and aging.
Fig. 1.

RCAN1.1S overexpression in the brain. a Western blot analysis of RCAN1 isoform expression in the brain of Alzheimer’s disease (AD) patients and age-matched controls (CTRL). RCAN1.1 proteins were elevated in AD vs. CTRL brains (RCAN1.1L t(21) = 9.954, p = .005; RCAN1.1S t(21) = 7.892, p = .011). N = 12 CTRL, 11 AD. b Correlational analyses showing human RCAN1.1L and RCAN1.1S levels increased with age in the CTRL group (RCAN1.1L r(10) = .736, p = .006; RCAN1.1S r(10) = .650, p = .022) but not in the AD group (RCAN1.1L r(9) = .309, p = .152; RCAN1.1S r(9) = −.235, p = .486). c Generation of RCAN1 transgenic (TG) mice with a floxed human RCAN1.1S transgene driven by Cre recombinase under the T-29 Camk2α promoter. d Representative western blot confirming RCAN1.1S overexpression in the hippocampus of Cre+/−; RCAN1Tg1a+/− (TG) mice compared with “wild-type” (WT) Cre−/−; RCAN1Tg1a+/− mice. e Representative western blot showing forebrain-specific RCAN1.1S overexpression in TG mice. OLF olfactory bulb, PFC prefrontal cortex, CTX cortex, HIP hippocampus, CER cerebellum, STR striatum. f Western blot analysis of age-related RCAN1 isoform expression in the mouse hippocampus. Exogenous human RCAN1.1S and endogenous murine RCAN1.1L protein levels increased from young (3–5 months old) to aged mice (12–14 months old). RCAN1.1S t(14) = −3.571, p = .003; RCAN1.1L F(3,28) = 11.429, p < .001; post hoc comparisons: all p < .05 except young TG vs. young WT (p = .503) and aged TG vs. aged WT (p = .955). N = 6–10 mice/group. Signal specificity confirmed using brain lysate from Rcan1 knockout (KO) mice. Normalized to β-actin. *p < .05
To investigate a causal link between chronic RCAN1.1S overexpression and AD progression, we selectively over-expressed human RCAN1.1S in the mouse brain using the Cre/lox system (Fig. 1c). Mice were generated with a floxed human RCAN1.1S transgene driven by Cre recombinase under a Camk2α promoter to overexpress RCAN1.1S late in development specifically in neurons [19, 20]. Western blotting showed RCAN1.1S overexpression in the hippocampus and throughout the forebrain of RCAN1 transgenic (TG) mice carrying both RCAN1.1S and Cre transgenes compared with “wild-type” (WT) littermate controls carrying RCAN1.1S but lacking Cre (Fig. 1d, e). We did not detect endogenous RCAN1.1S in the mouse brain, but the expression of a murine RCAN1.1S homolog cannot be definitively excluded with current reagents available. Because the transgenic human RCAN1.1S was tagged with a FLAG epitope, we were able to confirm expression of the RCAN1.1S transgene in TG mice [20]. Quantification of RCAN1.1S expression showed that transgenic RCAN1.1S represented ~30 % of RCAN1.1 levels in the mouse hippocampus (Supplemental Fig. 1b). We then examined if RCAN1 levels increased with age in TG mice like in the human brain (Fig. 1b). We found that transgenic RCAN1.1S levels increased markedly in the hippocampus of aged (12–14 months old) compared with young (3–5 months old) TG mice (Fig. 1f). This increase was not due to changes in RCAN1.1S mRNA levels during aging (Supplemental Fig. 1c). We also found higher levels of the endogenous murine RCAN1.1L isoform in aged TG mice (Fig. 1f). Therefore, the ratio of RCAN1.1 isoforms expressed in the hippocampus of TG mice did not change significantly with age (Supplemental Fig. 1b). Hippocampal RCAN1.1L levels also were higher in aged WT than in young WT mice (Fig. 1f), suggesting that RCAN1 proteins accumulate during aging. A similar pattern of increased RCAN1 levels was observed in other brain regions of aged compared with young animals (Supplemental Fig. 1d). Supporting these results, immunohistochemical staining for RCAN1 in the hippocampus showed signal throughout the somatic and dendritic compartments of CA1 neurons, which increased with transgenic RCAN1.1S expression and with age (Supplemental Fig. 1e). Combined, these data demonstrate that brain-specific RCAN1.1S overexpression in RCAN1 TG mice models the upregulation observed in AD and aging human brains.
RCAN1.1S overexpression leads to age-dependent memory impairments
Early in AD progression around middle age, subtle cognition and memory difficulties manifest during a stage called mild cognitive impairment (MCI) [45]. To determine if RCAN1.1S overexpression promotes MCI, we tested RCAN1 TG mice for MCI-like memory deficits in several hippocampus-dependent behavioral tasks. Using two age groups, we first tested mice in the novel object recognition (NOR) task. Young TG mice performed as well as WT littermates distinguishing a novel from familiar object, but performance was impaired in aged TG mice (Fig. 2a). This effect was not due to differences in total object exploration time (Fig. 2a) or movement (data not shown), indicating impaired object recognition memory in aged TG mice. Next, we tested mice in the MWM. No acquisition latency differences were detected between the genotypes in both age groups during training to locate a hidden escape platform, indicating normal spatial learning in RCAN1 TG mice (Fig. 2b). During the probe test when the platform was removed, young TG mice also showed no difference from WT littermates for spatial memory of the platform location, as measured by preferential time spent and number of platform crossings in the target quadrant (Fig. 2c, d). While aged WT mice also occupied the target quadrant and crossed the target platform location preferentially more than in all other quadrants, indicating intact spatial memory, aged TG mice failed to perform similarly (Fig. 2c, d). These results were not due to differences in vision (Fig. 2b) or distance traveled and swim speed (Fig. 2e), indicating impaired spatial memory in aged TG mice. Finally, we tested contextual and cued fear memory following associative fear conditioning. As with NOR and MWM, young TG mice displayed normal fear learning and long-term memory (LTM) compared to WT litter-mates (Fig. 2f). Although aged TG mice also acquired fear normally compared to WT littermates during training, contextual fear LTM was impaired (Fig. 2f). Interestingly, no difference in cued fear LTM was detected between aged TG and WT mice (Fig. 2f). Taken together, RCAN1.1S overexpression impaired hippocampus-dependent memory in mice at 12–14 months of age, corresponding to middle age in mice [15], when the WT littermates still exhibited normal memory compared to the young group. These results suggest that RCAN1.1S overexpression accelerates the age onset of memory deficits reminiscent of what is observed in DS-related AD [25] and early-onset familial AD [49].
Fig. 2.

RCAN1.1S overexpression leads to age-dependent memory impairments. a Young TG mice displayed normal object recognition memory, measured as a preference index of significantly greater percent time spent exploring the novel object than familiar object (young WT t(32) = −4.063, p < .0001; young TG t(32) = −2.226, p = .033). Aged TG mice failed to show this preference while aged WT mice did (aged WT t(34) = −6.249, p < .0001; aged TG t(22) = .059, p = .954). These effects were not due to differences in total object exploration time (young t(32) = −.459, p = .649; aged t(29) = .074, p = .942), indicating impaired memory in aged TG mice. N = 13–18 mice/group. b Both young and aged TG mice displayed normal spatial learning and intact vision in the MWM (RM-ANOVA between-subjects, training day escape latency: main effect of genotype F(1,45) = .616, p = .437; main effect of age F(1,45) = .578, p = .451; main effect of interaction F(1,45) = .034, p = .855; visible platform day escape latency: F(1,45) = .211, p = .648). Young TG mice also displayed normal spatial memory assessed with the probe test, whereas aged TG mice were impaired, failing to display significantly more, c time spent and d platform crossings in the target vs. all other (L, opp, R) quadrants. Quadrant occupancy time: young WT F(3,32) = 5.509, p = .004; young TG F(3,44) = 12.085, p < .001; aged WT F(3,56) = 18.086, p < .001; aged TG F(3,48) = 9.886, p < .001; post hoc comparisons: all p < .05 except target vs. L in aged TG group (p = .822). Platform crossing frequency: young WT F(3,32) = 5.368, p = .004; young TG F(3,44) = 7.226, p = .001; aged WT F(3,56) = 11.659, p < .001; aged TG F(3,48) = 1.248, p = .309; post hoc comparisons only in young WT, young TG, and aged WT groups: all p < .05. N = 12–14 mice/group. e MWM probe test results were not due to differences in distance traveled (F(3,45) = 1.773, p = .166) or swim speed (F(3,45) = .961, p = .419). f Aged, but not young, TG mice displayed impaired contextual fear LTM, while fear acquisition and cued fear LTM were normal compared to WT littermates. Young TG vs. young WT: training F(1,20) = .323, p = .576; context LTM F(1,20) = .585, p = .453; cued LTM F(1,20) = .032, p = .861. Aged TG vs. aged WT: training F(1,22) = .029, p = .866; context LTM F(1,22) = 5.433, p = .029; cued LTM F(1,22) = .491, p = .491. N = 11–14 mice/group. *p < .05; ns not significant.
RCAN1.1S overexpression leads to age-dependent impairments in synaptic plasticity
We then investigated if synaptic abnormalities might underlie the memory deficits in aged TG mice. Because synaptic plasticity is widely considered a cellular substrate of memory, we assessed early-phase long-term potentiation (E-LTP), a transient form of synaptic plasticity evoked by high frequency stimulation (HFS) in the CA3-CA1 circuit of ex vivo hippocampal slices [18]. E-LTP was indistinguishable between TG and WT slices from both age groups (Fig. 3a). To determine if RCAN1.1S overexpression influences long-lasting forms of synaptic plasticity, which are more mechanistically similar to long-term memory, we next assessed late-phase LTP (L-LTP) evoked by four HFS tetani [19]. Congruent with our behavioral data, L-LTP was comparable between hippocampal slices from young TG and WT littermates (Fig. 3b) but impaired in aged TG vs. WT control slices (Fig. 3c). This effect was not due to genotype differences in basal synaptic transmission or presynaptic function (data not shown). To determine a molecular mechanism for this effect, we examined the regulation of several proteins important for synaptic plasticity that may be altered by excessive RCAN1.1S signaling, including glutamate receptor subunit GluA1, N-methyl-d-aspartate receptor subunit 2B (NR2B), postsynaptic density protein 95 (PSD95), synaptophysin, calcium/calmodulin-dependent kinase II (CaMKII), and extracellular signal-regulated kinase (ERK) [1, 11, 21, 44, 55]. Western blotting of hippocampal lysates from aged TG and WT littermates revealed no differences in these proteins (Fig. 3d). Although not exhaustive, these findings suggest that the L-LTP deficit in aged TG mice was not derived from dysregulation of several major signaling pathways for synaptic plasticity. Taken together, these results show an age-dependent deterioration of long-lasting synaptic plasticity in RCAN1 TG mice, providing further support that RCAN1.1S overexpression may contribute to progressive neurodegeneration in AD.
Fig. 3.

RCAN1.1S overexpression leads to age-dependent impairments in synaptic plasticity. a One train of HFS (100 Hz) evoked similar levels of E-LTP in hippocampal area CA1 of young and aged TG mice compared to WT littermates (young F(1,16) = .233, p = .636; aged F(1,37) = .899, p = .349). n = 8–20 slices/group, 5–7 mice/group. b Four trains of HFS evoked similar L-LTP levels between young WT and TG mice (F(1,14) = .067, p = .799). n = 7–9 slices/group, 5–7 mice/group. c L-LTP was significantly impaired in aged TG mice compared with WT littermates (F(1,30) = .612, p = .019). n = 14–18 slices/group, 5–7 mice/group. Representative fEPSP recordings before (1 gray trace) and after LTP induction (2 black trace) at the top in a–c. d Western blot analysis of candidate RCAN1-regulated proteins important for synaptic plasticity in the aged mouse hippocampus. Impaired L-LTP in aged TG mice was not due to altered levels of phosphorylated GluA1 (p-GluA1) at S845 (t(19) = .037, p = .971) or S831 (t(19) = −.722, p = .479); total GluA1 (t(19) = .374, p = .713); NR2B phosphorylated at Y1472 (p-NR2B t(12) = .703, p = .495); total NR2B (t(12) = .832, p = .422); PSD95 (t(12) = 1.889, p = .083); synaptophysin (t(12) = .011, p = .991); CaMKII phosphorylated at T286 (p-CaMKII t(19) = .001, p = 1.00); or phosphorylated ERK at T202/Y204 (p-ERK1 t(19) = .143, p = .888; p-ERK2 t(19) = −.322, p = .751) in the hippocampus of aged TG mice compared to WT littermates. Phosphorylation signals normalized to the respective total protein levels; GluA1, NR2B, PSD95, and synaptophysin normalized to GAPDH. N = 6–12 mice/group. *p < .05
RCAN1.1S overexpression promotes AD-related pathology in the brain
To complement our behavioral and electrophysiological data, we next examined AD-related neuropathological markers in RCAN1 TG mice. A classic marker of AD is neurofibrillary tangles containing hyperphosphorylated tau. Using western blotting, we analyzed expression of the early pathological tau phosphorylation markers AT8 and AT180 [41] in hippocampal lysates from young and aged TG mice (Fig. 4). Supporting the idea that RCAN1.1S overexpression promotes the onset of AD neuropathology, AT8 and AT180 levels were increased in young TG mice compared with WT littermates. In contrast with our behavioral and L-LTP results, we detected no difference in levels for either marker between aged TG and WT littermates. Compared with young WT mice, however, TG and WT mice in the aged group both showed increased AT8 and AT180 levels, similar to young TG mice. Consistent with these results, immunohistochemical staining for AT8 in area CA1 of the hippocampus showed a similar pattern of increased signal in young TG mice and the aged groups (Supplemental Fig. 2). These results were not due to changes in total tau protein levels (Fig. 4), indicating that RCAN1.1S overexpression in the brain induces early expression of tau pathology found in AD.
Fig. 4.

RCAN1.1S overexpression promotes early tau pathology in the hippocampus. Western blot analysis of early pathological tau phosphorylation in the hippocampus. Tau pathology detected with AT8 and AT180 antibodies were significantly increased in young TG vs. WT mice. No differences for these markers were detected between aged TG and WT mice. However, compared with young WT mice, AT8 and AT180 expression were increased in both aged TG and WT mice to similarly high levels in young TG mice, indicating RCAN1.1S overexpression accelerated the onset of early tau pathology in the hippocampus. AT8 F(3,19) = 3.765, p = .028; AT180 F(3,19) = 3.352, p = .041; post hoc comparisons: young TG vs. young WT: AT8 p = .031, AT180 p = .025; aged TG vs. aged WT: AT8 p = 1.000, AT180 p = .999; aged WT vs. young WT: AT8 p = .007, AT180 p = .009; aged TG vs. young WT: AT8 p = .032, AT180 p = .038. These results were not due to changes in total tau protein levels (summed ~50–53 kD signals; F(3,19) = 2.197, p = .122). AT8 and AT180 immunoreactivity normalized to total tau levels and total tau to GAPDH. N = 4–8 mice/group. *p < .05
Another key biochemical feature of AD is elevated oxidative stress. To test if RCAN1.1S overexpression in the brain also induces oxidative stress, we used in vivo dihydroethidium (DHE) staining of superoxide [22], the predominant species of cellular ROS [50], in the hippocampus of TG and WT mice from both age groups. DHE staining revealed equally low ROS levels between young TG and WT littermates in area CA1 and dentate gyrus (DG) of the hippocampus (Fig. 5a). Aged WT mice also showed low hippocampal ROS levels, comparable to young WT mice (Fig. 5a). However, we found striking ROS increases in the hippocampus of aged TG mice (Fig. 5a). Because DHE provides a general readout of cellular ROS, we then tested if the excess ROS originated from mitochondria. To do this, we treated ex vivo hippocampal slices from aged TG and WT littermates with MitoSOX, a mitochondrial ROS dye selective for superoxide in mitochondria [34]. Consistent with our DHE results, MitoSOX fluorescence representing mitochondria-derived ROS was greater in the CA1 and DG of aged TG mice than in WT controls (Fig. 5b). To examine the consequence of this ROS increase, we evaluated protein carbonyl levels in mitochondria-enriched hippocampal lysates from aged TG and WT littermates as a measure of protein oxidation. In agreement with our ROS data, significantly more protein carbonylation, indicating greater oxidative damage, was found in aged TG mice (Fig. 5c). To determine if this resulted from differences in overall mitochondrial protein expression, we quantified expression levels of the mitochondrial marker voltage-dependent anion channel 1 (VDAC1) in whole hippocampal lysates from aged TG and WT mice. VDAC1 levels were indistinguishable between the genotypes (Fig. 5d), suggesting that protein carbonyl levels were specifically increased in aged TG mice. Together with the increased early pathological tau expression, the increased oxidative stress in RCAN1 TG mice supports a causal role for RCAN1.1S overexpression in AD neuropathology.
Fig. 5.

RCAN1.1S overexpression promotes mitochondria-derived oxidative stress in the brain. a Endogenous ROS detected with DHE in the CA1 and DG of hippocampal slices were equally low in young TG and WT littermates and aged WT mice. By contrast, aged TG mice showed robust cellular ROS levels in the hippocampus. CA1 F(3,32) = 14.738, p < .001; DG F(3,32) = 8.139, p < .001; post hoc comparisons: young WT vs. young TG: CA1 p = 1.000, DG p = .980; aged WT vs. young WT: CA1 p = .967, DG p = .975; aged TG vs. aged WT: CA1 p < .0001, DG p = .006. N = 3 mice/group, 3 slices/mouse. Scale bar 50 μm. b Mitochondria-derived ROS detected with MitoSOX were significantly elevated in the CA1 and DG of hippocampal slices from aged TG mice (CA1 t(38) = 2.113, p = .041; DG t(38) = 3.153, p = .003). Hoechst nuclear stain. N = 5 mice/group, 4 slices/mouse. Scale bar 50 μm. c Western blot analysis of protein carbonyl levels as a marker of protein oxidation in mitochondria-enriched hippocampal lysates from aged TG and WT mice. Aged TG mice exhibited significantly greater protein carbonylation, indicating greater oxidative stress, than aged WT mice (t(19) = −2.272, p = .035). Protein carbonyl levels were quantified as immunoreactivity of carbonylated proteins between 10 and 260 kD normalized to VDAC1 levels per lane. N = 9–12 mice/group. d Western blot analysis showing no difference in total VDAC1 levels that could explain the increased protein carbonylation in aged TG mice (t(13) = −.066, p = .948). Normalized to GAPDH. N = 9–12 mice/group. *p < .05
RCAN1.1S overexpression promotes age-dependent mitochondrial dysfunction
Given the increased mitochondrial ROS associated with oxidative damage in aged TG mice (Fig. 5), we reasoned that reducing ROS levels and therefore its damaging effects might restore L-LTP in these mice. To test this, we used the mitochondrial ROS scavenger MitoQ [54] in an attempt to rescue the L-LTP impairment in aged TG mice (Fig. 3c). We examined L-LTP in hippocampal slices following 70-min incubation with either MitoQ or the vehicle control. Confirming our earlier result, L-LTP was lower in vehicle-treated aged TG slices compared with similarly treated WT slices (Fig. 6a). Using a subthreshold concentration of MitoQ (500 nM) that does not affect LTP in WT slices but effectively reduces mitochondrial ROS levels [34], we found that the acute MitoQ treatment did not normalize L-LTP in aged TG slices (Fig. 6a). These data suggest that synaptic plasticity and memory deficits in aged TG mice are not mediated by acute elevation of mitochondrial ROS but result more likely from mitochondrial dysfunction leading to cumulative ROS damage.
Fig. 6.

RCAN1 TG mice exhibit aging-related mitochondrial dysfunction. a Acute MitoQ treatment of hippocampal slices did not restore L-LTP in aged TG mice to WT levels (F(3,52) = 3.183, p = .031; main effect of genotype F(1,56) = 8.973, p = .004; main effect of treatment F(1,56) = .001, p = .975; main effect of interaction F(3,52) = .048, p = .827). n = 11–18 slices/group, 5 mice/genotype. b Disrupting mitochondrial function with antimycin (ant) treatment of hippocampal slices impaired E-LTP significantly more in aged TG than in WT littermates compared with vehicle (veh) treatment, revealing increased age-dependent mitochondrial dysfunction when RCAN1.1S is overexpressed (F(3,71) = 31.089, p < .001; main effect of genotype F(1,71) = 4.111, p = .046; main effect of treatment F(1,71) = 80.609, p < .0001; main effect of interaction F(3,71) = 4.685, p = .034; post hoc aged TG + ant vs. aged WT + ant: p = .026). n = 17–21 slices/group, 5–7 mice/genotype. Representative fEPSP recordings before (1 gray trace) and after LTP induction (2 black trace) at the top in a and b. Mean fEPSP slopes recorded during last 20 min post-LTP induction at the right in a and b. c Mitochondrial membrane potential measured with JC-1 was abnormally hyperpolarized in hippocampal area CA1 of aged TG mice compared with WT littermates, indicating mitochondrial dysfunction (t(34) = −2.919, p = .006). JC-1 fluorescence intensity was quantified and normalized as a ratio of red (em590) to green (em530) fluorescence. Scale bar 10 μm. *p < .05
To test the idea that RCAN1 TG mice display mitochondrial dysfunction, we first assessed LTP in hippocampal slices pretreated for 20 min with antimycin-A (2.5 μM) to disrupt mitochondrial function. We reasoned that if RCAN1.1S overexpression compromised mitochondrial integrity, then TG mice would be more susceptible to antimycin and display more pronounced synaptic impairment. As expected, antimycin impaired LTP in aged WT slices and to a greater extent in aged TG slices compared with vehicle treatment (Fig. 6b). Consistent with our data showing no behavioral, synaptic, or ROS differences in the young group, antimycin impaired LTP similarly in young TG and WT slices (Supplemental Fig. 3). Thus, RCAN1 TG mice exhibited age-dependent mitochondrial dysfunction in the hippocampus. To complement these results, we also measured mitochondrial membrane potential in ex vivo hippocampal slices using the mitochondrial potential-sensitive fluorescent dye JC-1 [64]. JC-1 shifts from green fluorescence in monomeric form to red in aggregate form as it accumulates inside polarized mitochondria. We found a significant increase in the red-to-green JC-1 fluorescence ratio in the hippocampus of aged TG mice compared with WT littermates (Fig. 6c), indicating that mitochondria were abnormally hyperpolarized under steady-state conditions in aged TG mice. Because mitochondrial activities such as generating energy and regulating cell death signals depend on proper mitochondrial membrane potential [14, 60], this result provides further support that mitochondrial function is compromised in aged TG mice. Combined, these data suggest that RCAN1.1S overexpression might augment aging-related mitochondrial dysfunction in the brain to promote neurodegeneration in AD.
RCAN1.1S overexpression shifts mitochondria toward fission in the brain
Crucial to mitochondrial function in neurons are the normal fission and fusion of mitochondria [29, 51]. Mitochondrial fission requires DRP1 activity, which is regulated by CaN [5, 8]. CaN dephosphorylation of DRP1 at serine 637 (S637) translocates cytoplasmic DRP1 to mitochondria where it stimulates fission. Because RCAN1 potently regulates CaN [30, 52], RCAN1.1S overexpression may alter DRP1 activity and mitochondrial fission in the brain, thereby impacting mitochondrial function and providing a mechanistic link to the ROS increase and synaptic deficits found in aged RCAN1 TG mice. Supporting this idea, western blotting showed greatly reduced levels of S637-phosphorylated DRP1 (p-DRP1) in the hippocampus of aged TG mice (Fig. 7a; Supplemental Fig. 4a), which suggests upregulated DRP1 fission activity. Using immunohistochemistry, we also found more diffusely distributed DRP1 in the hippocampus of aged TG mice compared with WT littermates (Fig. 7b). To quantify this observation, we measured the frequency of DRP1 pixel intensities in predefined areas and found significantly higher median pixel intensity in the CA1 stratum pyramidale and stratum radiatum of aged TG mice, denoting more diffuse DRP1 signal (Fig. 7b). Then, we examined mitochondria size to determine if this diffuse DRP1 organization in the aged TG hippocampus corresponded to more cytoplasmic localization or more association with a greater incidence of fragmented mitochondria. We stained fixed hippocampal slices for the inner mitochondrial membrane protein adenine nucleotide translocase 1 (ANT1) and quantified the pixel areas of perinuclear mitochondria marked by ANT1 staining (Fig. 8a). Consistent with reduced p-DRP1 levels (Fig. 7a), we found more numerous small mitochondria (0–200 μm2) in the CA1 of aged TG mice than in WT littermates (Fig. 8b). Total mitochondria area was unchanged between the genotypes (Fig. 8c), indicating that the greater frequency of small mitochondria likely reflects unbalanced fission in aged TG mice. As another control, western blotting confirmed no difference in total hippocampal levels of DRP1 (Fig. 7a) and ANT1 (Fig. 8d) between aged TG and WT mice that may drive these effects. Combined, these data show that RCAN1.1S signaling can regulate mitochondrial fission in the brain through DRP1 activity and suggest that RCAN1.1S overexpression may contribute to the mitochondrial dysfunction in aging and AD through this pathway. Young TG mice did not differ from WT littermates and aged WT mice in DRP1 regulation (Supplemental Fig. 4b, c) or mitochondrial morphology (Fig. 8), further showing that RCAN1.1S overexpression promotes age-dependent mitochondrial dysfunction.
Fig. 7.
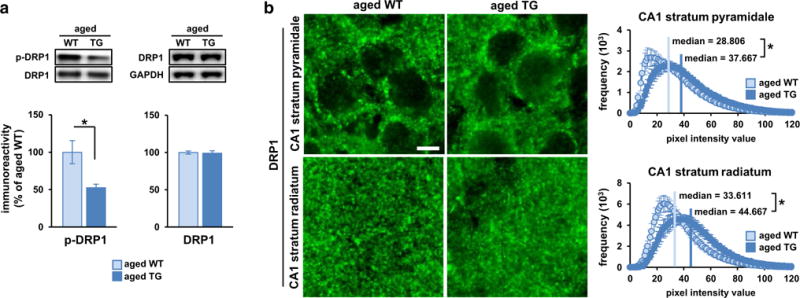
RCAN1.1S overexpression during aging alters dynamin-related protein 1 (DRP1) activity. a Western blot analysis showing reduced DRP1 phosphorylation at S637 (p-DRP1), normalized to DRP1 levels, in the hippocampus of aged TG vs. WT littermates (t(8) = −2.927, p = .019). N = 5 mice/group. This reduction was not due to a difference in total DRP1 levels, normalized to GAPDH, between the genotypes (t(13) = −.264, p = .796). N = 6–9 mice/group. b Reduced p-DRP1 levels corresponded to more diffuse sub-cellular localization of DRP1 in both the CA1 stratum pyramidale and stratum radiatum of aged TG vs. WT littermates. The median DRP1 pixel intensity value was significantly higher for aged TG mice than WT controls, indicating more diffuse DRP1 signal in the aged TG hippocampus (CA1-SP t(34) = −2.147, p = .039; CA1-SR t(34) = −2.508, p = .017). N = 6 mice/group, 3 slices/mouse. Scale bar 5 μm. *p < .05
Fig. 8.

RCAN1.1S overexpression during aging shifts mitochondria toward fission in the brain. a Representative images of mitochondria in the CA1 stratum pyramidale stained by the inner mitochondrial membrane marker ANT1. Insets highly fragmented perinuclear mitochondria in aged RCAN1 TG mice compared with WT littermates and the young group. Hoechst nuclear stain. Scale bar 5 μm. b Quantification of mitochondria sizes by measuring the pixel areas of ANT1 signal confirmed that aged WT mice and the young group were similar while aged TG mice had significantly more small (0–200 μm2) mitochondria in the hippocampus (F(3,24 = 5.287, p = .006; post hoc comparisons: aged TG vs. aged WT: p = .031; aged TG vs. young WT: p = .015; aged TG vs. young TG: p = .008 young WT vs. young TG: p = .990; young WT vs. aged WT: p = .999; aged WT vs. young TG: p = .977). N = 3–4 mice/group, 2 slices/mouse. c No significant differences in total mitochondria area measured as the sum pixel area of ANT1 signal were detected between any groups, indicating that the higher frequency of small mitochondria in aged TG mice likely resulted from increased fission (F(3,24 = .238, p = .869). d Western blot analysis showing that altered mitochondrial morphology in the hippocampus of aged TG mice was not due to a difference in total ANT1 levels compared to WT littermates and the young group (F(3,19 = .785, p = .517). Normalized to GAPDH. N = 4–9 mice/group. *p < .05
Discussion
Improved understanding of the mechanisms underlying AD progression is necessary to advance therapies for treating and potentially preventing this neurodegenerative disease. The majority of AD cases are sporadic, occurring with unknown etiology except that the incidence increases with age. Because DS patients almost universally develop early-onset AD, genes overexpressed by trisomy 21 provide a promising window into the pathogenesis of both DS-related AD and sporadic AD. An obvious mechanism may be overexpression of Amyloid Precursor Protein (APP) on chromosome 21, leading to increased Aβ production and plaque deposition, a classic neuropathological feature of AD. However, the Ts1Cje mouse model of DS does not include an extra copy of App yet develops AD-like pathology and cognitive deficits [53]. Furthermore, the failure of Aβ-directed clearance therapies to halt the progression of dementia [26] and the emergence of synaptic deficits before significant plaque deposition [43] suggest other mechanisms may promote neurodegeneration in AD.
An attractive candidate mechanism is overexpression of RCAN1 on chromosome 21. RCAN1 has been found overexpressed in fetal and postmortem DS brains [47, 56, 61], postmortem AD brains at various stages [7, 61], and lymphocytes from pre-symptomatic adults carrying the APOE ε4 genetic risk factor for AD [31]. Together with the report that RCAN1 levels increase in the human brain with normal aging [7], these findings suggest a role for chronic RCAN1 overexpression in the age-related progression of AD. RCAN1.1L is the predominant isoform in the brain, and it is overexpression of this isoform in AD and DS brains that has been reported and shown recently to promote AD-like pathophysiology [12, 13, 39, 46, 61]. Interestingly, however, RCAN1.1L overexpression was shown to protect cells initially but facilitated apoptosis after long-term overexpression, whereas both short- and long-term overexpression of the RCAN1.1S isoform facilitated apoptosis [61], suggesting RCAN1.1S may be particularly toxic. Such findings point to differential isoform effects. While it is possible that overexpression of any or all RCAN1 isoforms may promote AD, studying isoform-specific contributions may enable more specialized biomarker and therapeutic strategies for AD. In the present study, we provide strong converging behavioral, electrophysiological and biochemical evidence that overexpression of the RCAN1.1S isoform is a causal factor in early age-dependent neurodegeneration related to AD.
This study is the first examination of RCAN1.1S-specific overexpression in AD pathogenesis using an aging in vivo mammalian model. Although cell culture studies support a causal role for RCAN1.1S overexpression in several AD-related features [33, 48, 61], age is the largest risk factor for AD [17] and difficult to reproduce in vitro. Dementia similarly, central to AD, is impossible to examine in cell culture but can be modeled by mouse behavior and circuit-level synaptic physiology in the mouse brain. Three prior studies reportedly examined RCAN1 isoform-specific overexpression mouse models in vivo, but two did not consider the importance of aging [9, 39], and the third overexpressed RCAN1.4, finding no age-dependent memory effects [2]. These studies also overexpressed RCAN1 globally from early development, which models DS but does not distinguish neuronal abnormalities arising from developmental defects or aging-related insults. To understand how AD may progress, we generated RCAN1 TG mice overexpressing human RCAN1.1S selectively in the brain and tested them for AD-like neurodegeneration at two early time points: young (3–5 months old) and aged (12–14 months old). Importantly, we observed synaptic and memory phenotypes in aged TG mice, corresponding roughly to middle age in humans when mild cognitive impairments would occur as an early indicator of AD. These findings suggest an early role for RCAN1 overexpression in the neurodegenerative processes of AD, before the onset of extensive cell death, which is consistent with the notion that AD-related loss of function occurs prior to neuronal loss. Our data are the first to demonstrate that chronic RCAN1.1S overexpression promotes age-dependent memory and synaptic plasticity deficits associated with early tau pathology, oxidative stress, and mitochondrial dysfunction in the adult mouse hippocampus, mirroring key AD features. Because we activated RCAN1.1S overexpression late in development, our data also show that AD-associated neurodegeneration can occur with aging as in sporadic AD, independent of RCAN1 overexpression effects during fetal development in DS.
Our study also provides the first analysis of RCAN1.1S levels in the AD and normally aging brain, showing that RCAN1.1S protein, like RCAN1.1L, is overexpressed in AD and increases with normal aging in both humans and RCAN1 TG mice. Because we did not observe a change in RCAN1.1S mRNA levels during aging (Supplemental Fig. 1c), one possibility for the increased level of RCAN1.1 proteins is that their degradation may be impaired, consistent with the impaired protein degradation reported in AD and aging [23, 24] and the appearance of protein aggregates with RCAN1 overexpression in cell culture [33]. We did not observe RCAN1 aggregates in the hippocampus of young or aged TG mice, but they may emerge at a later pathological stage. Given the glucocorticoid-responsive promoter of RCAN1.1 [56], another possibility why RCAN1.1 protein levels are increased is their excessive induction by physiological stress over the course of aging. Chronic exposure to stressors may cause a buildup of RCAN1.1 protein that triggers mitochondrial dysfunction and oxidative stress in the brain, eventually leading to cognitive decline in normal aging. In AD, these events may be accelerated by interactions between normal age-related changes and risk factors that upregulate or compound RCAN1.1 signaling, thereby leading to pathology and dementia. Several stressors, including psychological stress, Aβ, oxidative stress, and genetic sources such as trisomy 21 have been shown to increase RCAN1.1 levels [12, 56]. Signaling through RCAN1.1 may then represent a central node for these stressors to promote neurodegeneration in AD (Fig. 9). In future studies, it would be interesting to examine the effects of stress manipulations during aging on RCAN1.1 degradation and translation and the progression of AD-like neurodegeneration in RCAN1 TG mice.
Fig. 9.
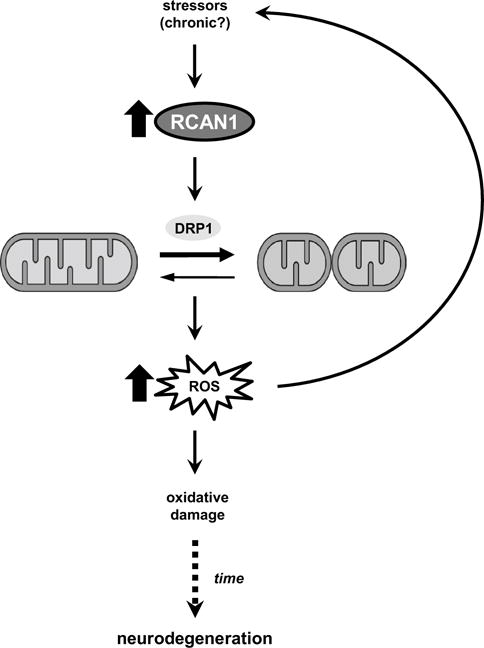
Schematic model of RCAN1 signaling in AD-related progressive neurodegeneration. Exposure to chronic stressors during aging may cause RCAN1 protein to accumulate in the brain and promote mitochondrial dysfunction and excessive ROS levels. Oxidative damage from excess ROS over time may then trigger AD-related neurodegeneration.
Consistent with this idea of cumulative long-term effects in aging and AD, acute MitoQ treatment was unable to restore hippocampal L-LTP in aged RCAN1 TG mice. Previous studies have associated RCAN1 with mitochondrial function and oxidative stress, but here we demonstrate that chronic RCAN1.1S overexpression promotes age-dependent mitochondrial defects associated with greater oxidative stress in the mouse brain, recapitulating what is seen in AD [35]. Additionally, we uncovered a signaling pathway between RCAN1.1S and DRP1 regulation of mitochondrial fission that may mediate the mitochondrial dysfunction in AD. Whether RCAN1.1L is involved in this pathway remains to be determined. These data strongly support a causal mechanistic link between RCAN1.1S overexpression and progressive neurodegeneration in AD through cumulative mitochondrial dysfunction and oxidative damage, leading to impaired synaptic plasticity and memory (Fig. 9). Consequently, chronic MitoQ treatment to scavenge mitochondria-derived ROS during aging or other long-term therapies may be more effective at restoring L-LTP in aged TG mice. Future studies testing this mechanism will be important to determine if RCAN1 signaling may be targeted to prevent AD onset or lessen the severity of AD.
RCAN1 has been reported to both inhibit and facilitate CaN activity [30, 52], which has made the regulatory relationship between RCAN1 and CaN challenging to understand. In this study, for example, we found increased early pathological tau phosphorylation (Fig. 4) but also decreased DRP1 phosphorylation (Fig. 7a) in the hippocampus of RCAN1 TG mice, suggesting RCAN1.1S overexpression inhibited as well as facilitated CaN activity. Previous studies have shown that RCAN1 affects CaN activity differently depending on the concentration and phosphorylation of RCAN1 [18, 30] and the localization and substrates of CaN [20, 40, 62]. As a result, future studies will be required to better understand how RCAN1 regulates CaN activity in the brain of RCAN1 TG mice. Identifying the cellular contexts in which RCAN1 inhibits or facilitates CaN activity will improve how RCAN1/CaN signaling can be exploited as a therapeutic avenue for AD.
In summary, this study provides valuable new insights into the molecular basis of progressive neurodegeneration in AD. The results strongly support overexpression of the DS-associated gene RCAN1 and particularly the RCAN1.1S isoform during aging as a pathogenic mechanism in both DS-related AD and sporadic AD. Therefore, RCAN1 represents an attractive therapeutic target for treating this devastating neurodegenerative disease.
Supplementary Material
Acknowledgments
For technical assistance, resources, and funding, we thank Yoon Choi, Areum Kang, Pavan Krishnamurthy, Michael Murphy, Chris Link, BBDP tissue bank, CU Boulder BioFrontiers Microscopy Core, Alzheimer’s Association MNIRGDP-12-258900 (CAH), NARSAD 21069 (CAH), NIH F31 NS083277 (HW), NIH T32 MH019524 (HW), Simons Foundation SFARI 27444 (CAH), Sie Foundation (JL).
Footnotes
Electronic supplementary material The online version of this article (doi:10.1007/s00401-015-1499-8) contains supplementary material, which is available to authorized users.
References
- 1.Barria A, Muller D, Derkach V, Griffith LC, Soderling TR. Regulatory phosphorylation of AMPA-type glutamate receptors by CaM-KII during long-term potentiation. Science. 1997;276:2042–2045. doi: 10.1126/science.276.5321.2042. [DOI] [PubMed] [Google Scholar]
- 2.Bhoiwala DL, Koleilat I, Qian J, Beyer B, Hushmendy SF, Mathew A, Bhoiwala DL, Ferland RJ, Crawford DR. Overexpression of RCAN1 isoform 4 in mouse neurons leads to a moderate behavioral impairment. Neurol Res. 2013;35:79–89. doi: 10.1179/1743132812Y.0000000117. [DOI] [PubMed] [Google Scholar]
- 3.Bishop NA, Lu T, Yankner BA. Neural mechanisms of ageing and cognitive decline. Nature. 2010;464:529–535. doi: 10.1038/nature08983. [DOI] [PMC free article] [PubMed] [Google Scholar]
- 4.Burke SN, Barnes CA. Neural plasticity in the ageing brain. Nat Rev Neurosci. 2006;7:30–40. doi: 10.1038/nrn1809. [DOI] [PubMed] [Google Scholar]
- 5.Cereghetti GM, Stangherlin A, Martins de Brito O, Chang CR, Blackstone C, Bernardi P, Scorrano L. Dephosphorylation by calcineurin regulates translocation of Drp1 to mitochondria. Proc Natl Acad Sci USA. 2008;105:15803–15808. doi: 10.1073/pnas.0808249105. [DOI] [PMC free article] [PubMed] [Google Scholar]
- 6.Chang KT, Min KT. Drosophila melanogaster homolog of Down syndrome critical region 1 is critical for mitochondrial function. Nat Neurosci. 2005;8:1577–1585. doi: 10.1038/nn1564. [DOI] [PubMed] [Google Scholar]
- 7.Cook CN, Hejna MJ, Magnuson DJ, Lee JM. Expression of calcipressin1, an inhibitor of the phosphatase calcineurin, is altered with aging and Alzheimer’s disease. J Alzheimers Dis JAD. 2005;8:63–73. doi: 10.3233/jad-2005-8108. [DOI] [PubMed] [Google Scholar]
- 8.Cribbs JT, Strack S. Reversible phosphorylation of Drp1 by cyclic AMP-dependent protein kinase and calcineurin regulates mitochondrial fission and cell death. EMBO Rep. 2007;8:939–944. doi: 10.1038/sj.embor.7401062. [DOI] [PMC free article] [PubMed] [Google Scholar]
- 9.Dierssen M, Arque G, McDonald J, Andreu N, Martinez-Cue C, Florez J, Fillat C. Behavioral characterization of a mouse model overexpressing DSCR1/RCAN1. PLoS One. 2011;6:e17010. doi: 10.1371/journal.pone.0017010. [DOI] [PMC free article] [PubMed] [Google Scholar]
- 10.Eckert GP, Renner K, Eckert SH, Eckmann J, Hagl S, Abdel-Kader RM, Kurz C, Leuner K, Muller WE. Mitochondrial dysfunction—a pharmacological target in Alzheimer’s disease. Mol Neurobiol. 2012;46:136–150. doi: 10.1007/s12035-012-8271-z. [DOI] [PubMed] [Google Scholar]
- 11.English JD, Sweatt JD. A requirement for the mitogen-activated protein kinase cascade in hippocampal long term potentiation. J Biol Chem. 1997;272:19103–19106. doi: 10.1074/jbc.272.31.19103. [DOI] [PubMed] [Google Scholar]
- 12.Ermak G, Pritchard MA, Dronjak S, Niu B, Davies KJ. Do RCAN1 proteins link chronic stress with neurodegeneration? FASEB J. 2011;25:3306–3311. doi: 10.1096/fj.11-185728. [DOI] [PMC free article] [PubMed] [Google Scholar]
- 13.Ermak G, Sojitra S, Yin F, Cadenas E, Cuervo AM, Davies KJ. Chronic expression of RCAN1-1L protein induces mitochondrial autophagy and metabolic shift from oxidative phosphorylation to glycolysis in neuronal cells. J Biol Chem. 2012;287:14088–14098. doi: 10.1074/jbc.M111.305342. [DOI] [PMC free article] [PubMed] [Google Scholar]
- 14.Giovannini C, Matarrese P, Scazzocchio B, Sanchez M, Masella R, Malorni W. Mitochondria hyperpolarization is an early event in oxidized low-density lipoprotein-induced apoptosis in Caco-2 intestinal cells. FEBS Lett. 2002;523:200–206. doi: 10.1016/s0014-5793(02)02972-1. [DOI] [PubMed] [Google Scholar]
- 15.Gower AJ, Lamberty Y. The aged mouse as a model of cognitive decline with special emphasis on studies in NMRI mice. Behav Brain Res. 1993;57:163–173. doi: 10.1016/0166-4328(93)90132-a. [DOI] [PubMed] [Google Scholar]
- 16.Harris CD, Ermak G, Davies KJ. RCAN1-1L is over-expressed in neurons of Alzheimer’s disease patients. FEBS J. 2007;274:1715–1724. doi: 10.1111/j.1742-4658.2007.05717.x. [DOI] [PubMed] [Google Scholar]
- 17.Hebert LE, Weuve J, Scherr PA, Evans DA. Alzheimer disease in the United States (2010–2050) estimated using the 2010 census. Neurology. 2013;80:1778–1783. doi: 10.1212/WNL.0b013e31828726f5. [DOI] [PMC free article] [PubMed] [Google Scholar]
- 18.Hoeffer CA, Dey A, Sachan N, Wong H, Patterson RJ, Shelton JM, Richardson JA, Klann E, Rothermel BA. The Down syndrome critical region protein RCAN1 regulates long-term potentiation and memory via inhibition of phosphatase signaling. J Neurosci. 2007;27:13161–13172. doi: 10.1523/JNEUROSCI.3974-07.2007. [DOI] [PMC free article] [PubMed] [Google Scholar]
- 19.Hoeffer CA, Tang W, Wong H, Santillan A, Patterson RJ, Martinez LA, Tejada-Simon MV, Paylor R, Hamilton SL, Klann E. Removal of FKBP12 enhances mTOR-Raptor interactions, LTP, memory, and perseverative/repetitive behavior. Neuron. 2008;60:832–845. doi: 10.1016/j.neuron.2008.09.037. [DOI] [PMC free article] [PubMed] [Google Scholar]
- 20.Hoeffer CA, Wong H, Cain P, Levenga J, Cowansage KK, Choi Y, Davy C, Majmundar N, McMillan DR, Rothermel BA, et al. Regulator of calcineurin 1 modulates expression of innate anxiety and anxiogenic responses to selective serotonin reuptake inhibitor treatment. J Neurosci. 2013;33:16930–16944. doi: 10.1523/JNEUROSCI.3513-12.2013. [DOI] [PMC free article] [PubMed] [Google Scholar]
- 21.Horne EA, Dell’Acqua ML. Phospholipase C is required for changes in postsynaptic structure and function associated with NMDA receptor-dependent long-term depression. J Neurosci. 2007;27:3523–3534. doi: 10.1523/JNEUROSCI.4340-06.2007. [DOI] [PMC free article] [PubMed] [Google Scholar]
- 22.Hu D, Serrano F, Oury TD, Klann E. Aging-dependent alterations in synaptic plasticity and memory in mice that overexpress extracellular superoxide dismutase. J Neurosci. 2006;26:3933–3941. doi: 10.1523/JNEUROSCI.5566-05.2006. [DOI] [PMC free article] [PubMed] [Google Scholar]
- 23.Keck S, Nitsch R, Grune T, Ullrich O. Proteasome inhibition by paired helical filament-tau in brains of patients with Alzheimer’s disease. J Neurochem. 2003;85:115–122. doi: 10.1046/j.1471-4159.2003.01642.x. [DOI] [PubMed] [Google Scholar]
- 24.Keller JN, Hanni KB, Markesbery WR. Possible involvement of proteasome inhibition in aging: implications for oxidative stress. Mech Ageing Dev. 2000;113:61–70. doi: 10.1016/s0047-6374(99)00101-3. [DOI] [PubMed] [Google Scholar]
- 25.Krinsky-McHale SJ, Devenny DA, Kittler P, Silverman W. Selective attention deficits associated with mild cognitive impairment and early stage Alzheimer’s disease in adults with Down syndrome. Am J Ment Retard AJMR. 2008;113:369–386. doi: 10.1352/2008.113:369-386. [DOI] [PubMed] [Google Scholar]
- 26.Lemere CA, Masliah E. Can Alzheimer disease be prevented by amyloid-beta immunotherapy? Nat Rev Neurol. 2010;6:108–119. doi: 10.1038/nrneurol.2009.219. [DOI] [PMC free article] [PubMed] [Google Scholar]
- 27.Leuner K, Hauptmann S, Abdel-Kader R, Scherping I, Keil U, Strosznajder JB, Eckert A, Muller WE. Mitochondrial dysfunction: the first domino in brain aging and Alzheimer’s disease? Antioxid Redox Signal. 2007;9:1659–1675. doi: 10.1089/ars.2007.1763. [DOI] [PubMed] [Google Scholar]
- 28.Levenga J, Krishnamurthy P, Rajamohamedsait H, Wong H, Franke TF, Cain P, Sigurdsson EM, Hoeffer CA. Tau pathology induces loss of GABAergic interneurons leading to altered synaptic plasticity and behavioral impairments. Acta Neuropathol Commun. 2013;1:34. doi: 10.1186/2051-5960-1-34. [DOI] [PMC free article] [PubMed] [Google Scholar]
- 29.Li Z, Okamoto K, Hayashi Y, Sheng M. The importance of dendritic mitochondria in the morphogenesis and plasticity of spines and synapses. Cell. 2004;119:873–887. doi: 10.1016/j.cell.2004.11.003. [DOI] [PubMed] [Google Scholar]
- 30.Liu Q, Busby JC, Molkentin JD. Interaction between TAK1-TAB 1-TAB 2 and RCAN1-calcineurin defines a signalling nodal control point. Nat Cell Biol. 2009;11:154–161. doi: 10.1038/ncb1823. [DOI] [PMC free article] [PubMed] [Google Scholar]
- 31.Lloret A, Badia MC, Giraldo E, Ermak G, Alonso MD, Pallardo FV, Davies KJ, Vina J. Amyloid-beta toxicity and tau hyperphosphorylation are linked via RCAN1 in Alzheimer’s disease. J Alzheimers Dis JAD. 2011;27:701–709. doi: 10.3233/JAD-2011-110890. [DOI] [PMC free article] [PubMed] [Google Scholar]
- 32.Lott IT, Head E. Down syndrome and Alzheimer’s disease: a link between development and aging. Ment Retard Dev Disabil Res Rev. 2001;7:172–178. doi: 10.1002/mrdd.1025. [DOI] [PubMed] [Google Scholar]
- 33.Ma H, Xiong H, Liu T, Zhang L, Godzik A, Zhang Z. Aggregate formation and synaptic abnormality induced by DSCR1. J Neurochem. 2004;88:1485–1496. doi: 10.1046/j.1471-4159.2003.02294.x. [DOI] [PubMed] [Google Scholar]
- 34.Ma T, Hoeffer CA, Wong H, Massaad CA, Zhou P, Iadecola C, Murphy MP, Pautler RG, Klann E. Amyloid beta-induced impairments in hippocampal synaptic plasticity are rescued by decreasing mitochondrial superoxide. J Neurosci. 2011;31:5589–5595. doi: 10.1523/JNEUROSCI.6566-10.2011. [DOI] [PMC free article] [PubMed] [Google Scholar]
- 35.Maccioni RB, Munoz JP, Barbeito L. The molecular bases of Alzheimer’s disease and other neurodegenerative disorders. Arch Med Res. 2001;32:367–381. doi: 10.1016/s0188-4409(01)00316-2. [DOI] [PubMed] [Google Scholar]
- 36.Manczak M, Calkins MJ, Reddy PH. Impaired mitochondrial dynamics and abnormal interaction of amyloid beta with mitochondrial protein Drp1 in neurons from patients with Alzheimer’s disease: implications for neuronal damage. Hum Mol Genet. 2011;20:2495–2509. doi: 10.1093/hmg/ddr139. [DOI] [PMC free article] [PubMed] [Google Scholar]
- 37.Manczak M, Reddy PH. Abnormal interaction between the mitochondrial fission protein Drp1 and hyperphosphorylated tau in Alzheimer’s disease neurons: implications for mitochondrial dysfunction and neuronal damage. Hum Mol Genet. 2012;21:2538–2547. doi: 10.1093/hmg/dds072. [DOI] [PMC free article] [PubMed] [Google Scholar]
- 38.Markesbery WR. Oxidative stress hypothesis in Alzheimer’s disease. Free Radic Biol Med. 1997;23:134–147. doi: 10.1016/s0891-5849(96)00629-6. [DOI] [PubMed] [Google Scholar]
- 39.Martin KR, Corlett A, Dubach D, Mustafa T, Coleman HA, Parkington HC, Merson TD, Bourne JA, Porta S, Arbones ML, et al. Overexpression of RCAN1 causes Down syndrome-like hippocampal deficits that alter learning and memory. Hum Mol Genet. 2012;21:3025–3041. doi: 10.1093/hmg/dds134. [DOI] [PubMed] [Google Scholar]
- 40.Martinez-Martinez S, Genesca L, Rodriguez A, Raya A, Salichs E, Were F, Lopez-Maderuelo MD, Redondo JM, de la Luna S. The RCAN carboxyl end mediates calcineurin docking-dependent inhibition via a site that dictates binding to substrates and regulators. Proc Natl Acad Sci USA. 2009;106:6117–6122. doi: 10.1073/pnas.0812544106. [DOI] [PMC free article] [PubMed] [Google Scholar]
- 41.Mawal-Dewan M, Henley J, Van de Voorde A, Trojanowski JQ, Lee VM. The phosphorylation state of tau in the developing rat brain is regulated by phosphoprotein phosphatases. J Biol Chem. 1994;269:30981–30987. [PubMed] [Google Scholar]
- 42.Nelson PT, Alafuzoff I, Bigio EH, Bouras C, Braak H, Cairns NJ, Castellani RJ, Crain BJ, Davies P, Del Tredici K, et al. Correlation of Alzheimer disease neuropathologic changes with cognitive status: a review of the literature. J Neuropathol Exp Neurol. 2012;71:362–381. doi: 10.1097/NEN.0b013e31825018f7. [DOI] [PMC free article] [PubMed] [Google Scholar]
- 43.Oddo S, Caccamo A, Shepherd JD, Murphy MP, Golde TE, Kayed R, Metherate R, Mattson MP, Akbari Y, LaFerla FM. Triple-transgenic model of Alzheimer’s disease with plaques and tangles: intracellular Abeta and synaptic dysfunction. Neuron. 2003;39:409–421. doi: 10.1016/s0896-6273(03)00434-3. [DOI] [PubMed] [Google Scholar]
- 44.Okazawa M, Abe H, Katsukawa M, Iijima K, Kiwada T, Nakanishi S. Role of calcineurin signaling in membrane potential-regulated maturation of cerebellar granule cells. J Neurosci. 2009;29:2938–2947. doi: 10.1523/JNEUROSCI.5932-08.2009. [DOI] [PMC free article] [PubMed] [Google Scholar]
- 45.Pater C. Mild cognitive impairment (MCI)—the novel trend of targeting Alzheimer’s disease in its early stages—methodological considerations. Curr Alzheimer Res. 2011;8:798–807. doi: 10.2174/156720511797633250. [DOI] [PubMed] [Google Scholar]
- 46.Peiris H, Dubach D, Jessup CF, Unterweger P, Raghupathi R, Muyderman H, Zanin MP, Mackenzie K, Pritchard MA, Keating DJ. RCAN1 regulates mitochondrial function and increases susceptibility to oxidative stress in mammalian cells. Oxid Med Cell Longev. 2014;2014:520316. doi: 10.1155/2014/520316. [DOI] [PMC free article] [PubMed] [Google Scholar]
- 47.Perluigi M, Di Domenico F, Buttterfield DA. Unraveling the complexity of neurodegeneration in brains of subjects with Down syndrome: insights from proteomics. Proteomics Clin Appl. 2014;8:73–85. doi: 10.1002/prca.201300066. [DOI] [PMC free article] [PubMed] [Google Scholar]
- 48.Poppek D, Keck S, Ermak G, Jung T, Stolzing A, Ullrich O, Davies KJ, Grune T. Phosphorylation inhibits turnover of the tau protein by the proteasome: influence of RCAN1 and oxidative stress. Biochem J. 2006;400:511–520. doi: 10.1042/BJ20060463. [DOI] [PMC free article] [PubMed] [Google Scholar]
- 49.Rainero I, Bergamini L, Bruni AC, Ferini-Strambi L, Foncin JF, Gei G, Macciardi F, Montesi MP, Pinessi L, Vaula G. A new Italian pedigree with early-onset Alzheimer’s disease. J Geriatr Psychiatry Neurol. 1994;7:28–32. [PubMed] [Google Scholar]
- 50.Reddy PH, Beal MF. Are mitochondria critical in the pathogenesis of Alzheimer’s disease? Brain Res Brain Res Rev. 2005;49:618–632. doi: 10.1016/j.brainresrev.2005.03.004. [DOI] [PubMed] [Google Scholar]
- 51.Reddy PH, Tripathi R, Troung Q, Tirumala K, Reddy TP, Anekonda V, Shirendeb UP, Calkins MJ, Reddy AP, Mao P, et al. Abnormal mitochondrial dynamics and synaptic degeneration as early events in Alzheimer’s disease: implications to mitochondria-targeted antioxidant therapeutics. Biochim Biophys Acta. 2012;1822:639–649. doi: 10.1016/j.bbadis.2011.10.011. [DOI] [PMC free article] [PubMed] [Google Scholar]
- 52.Rothermel B, Vega RB, Yang J, Wu H, Bassel-Duby R, Williams RS. A protein encoded within the Down syndrome critical region is enriched in striated muscles and inhibits calcineurin signaling. J Biol Chem. 2000;275:8719–8725. doi: 10.1074/jbc.275.12.8719. [DOI] [PubMed] [Google Scholar]
- 53.Shukkur EA, Shimohata A, Akagi T, Yu W, Yamaguchi M, Murayama M, Chui D, Takeuchi T, Amano K, Subramhanya KH, et al. Mitochondrial dysfunction and tau hyperphosphorylation in Ts1Cje, a mouse model for Down syndrome. Hum Mol Genet. 2006;15:2752–2762. doi: 10.1093/hmg/ddl211. [DOI] [PubMed] [Google Scholar]
- 54.Smith RA, Murphy MP. Animal and human studies with the mitochondria-targeted antioxidant MitoQ. Ann N Y Acad Sci. 2010;1201:96–103. doi: 10.1111/j.1749-6632.2010.05627.x. [DOI] [PubMed] [Google Scholar]
- 55.Snyder EM, Nong Y, Almeida CG, Paul S, Moran T, Choi EY, Nairn AC, Salter MW, Lombroso PJ, Gouras GK, et al. Regulation of NMDA receptor trafficking by amyloid-beta. Nat Neurosci. 2005;8:1051–1058. doi: 10.1038/nn1503. [DOI] [PubMed] [Google Scholar]
- 56.Sun X, Wu Y, Chen B, Zhang Z, Zhou W, Tong Y, Yuan J, Xia K, Gronemeyer H, Flavell RA, et al. Regulator of calcineurin 1 (RCAN1) facilitates neuronal apoptosis through caspase-3 activation. J Biol Chem. 2011;286:9049–9062. doi: 10.1074/jbc.M110.177519. [DOI] [PMC free article] [PubMed] [Google Scholar]
- 57.Tsien JZ, Chen DF, Gerber D, Tom C, Mercer EH, Anderson DJ, Mayford M, Kandel ER, Tonegawa S. Subregionand cell type-restricted gene knockout in mouse brain. Cell. 1996;87:1317–1326. doi: 10.1016/s0092-8674(00)81826-7. [DOI] [PubMed] [Google Scholar]
- 58.Wang X, Su B, Lee HG, Li X, Perry G, Smith MA, Zhu X. Impaired balance of mitochondrial fission and fusion in Alzheimer’s disease. J Neurosci. 2009;29:9090–9103. doi: 10.1523/JNEUROSCI.1357-09.2009. [DOI] [PMC free article] [PubMed] [Google Scholar]
- 59.Wang X, Su B, Zheng L, Perry G, Smith MA, Zhu X. The role of abnormal mitochondrial dynamics in the pathogenesis of Alzheimer’s disease. J Neurochem. 2009;109(Suppl 1):153–159. doi: 10.1111/j.1471-4159.2009.05867.x. [DOI] [PMC free article] [PubMed] [Google Scholar]
- 60.Ward MW, Huber HJ, Weisova P, Dussmann H, Nicholls DG, Prehn JH. Mitochondrial and plasma membrane potential of cultured cerebellar neurons during glutamate-induced necrosis, apoptosis, and tolerance. J Neurosci. 2007;27:8238–8249. doi: 10.1523/JNEUROSCI.1984-07.2007. [DOI] [PMC free article] [PubMed] [Google Scholar]
- 61.Wu Y, Song W. Regulation of RCAN1 translation and its role in oxidative stress-induced apoptosis. FASEB J. 2013;27:208–221. doi: 10.1096/fj.12-213124. [DOI] [PubMed] [Google Scholar]
- 62.Xing L, Salas M, Zhang H, Gittler J, Ludwig T, Lin CS, Murty VV, Silverman W, Arancio O, Tycko B. Creation and characterization of BAC-transgenic mice with physiological overexpression of epitope-tagged RCAN1 (DSCR1) Mamm Genome. 2013;24:30–43. doi: 10.1007/s00335-012-9436-9. [DOI] [PMC free article] [PubMed] [Google Scholar]
- 63.Yang J, Rothermel B, Vega RB, Frey N, McKinsey TA, Olson EN, Bassel-Duby R, Williams RS. Independent signals control expression of the calcineurin inhibitory proteins MCIP1 and MCIP2 in striated muscles. Circ Res. 2000;87:E61–E68. doi: 10.1161/01.res.87.12.e61. [DOI] [PubMed] [Google Scholar]
- 64.Zhou C, Tu J, Zhang Q, Lu D, Zhu Y, Zhang W, Yang F, Brann DW, Wang R. Delayed ischemic postconditioning protects hippocampal CA1 neurons by preserving mitochondrial integrity via Akt/GSK3beta signaling. Neurochem Int. 2011;59:749–758. doi: 10.1016/j.neuint.2011.08.008. [DOI] [PubMed] [Google Scholar]
Associated Data
This section collects any data citations, data availability statements, or supplementary materials included in this article.