

Abstract
Introduction
Nebivolol, a third-generation β-blocker, is subject to extensive first-pass metabolism and produces active β-blocking hydroxylated metabolites, like 4-OH-nebivolol. It is primarily a substrate of CYP2D6, a metabolic pathway that is under polymorphic genetic regulation. The objective of this study was to assess the metabolizer phenotype and to evaluate the interphenotype bioavailability and metabolism of nebivolol.
Material and methods
Forty-three healthy volunteers were included in this open-label, non-randomized clinical trial and each volunteer received a single dose of 5 mg nebivolol. Non-compartmental pharmacokinetic analysis was performed to determine the pharmacokinetic parameters of nebivolol and its active metabolite. The phenotypic distribution was assessed based on the AUC (aria under the curve) metabolic ratio of nebivolol/4-OH-nebivolol and statistical analysis. An interphenotype comparison of nebivolol metabolism and bioavailability was performed based on the pharmacokinetic parameters of nebivolol and its active metabolite.
Results
Nebivolol/4-OH-nebivolol AUC metabolic ratios were not characterized by a standard normal distribution. The unique distribution emphasized the existence of two groups and the 43 healthy volunteers were classified as follows: poor metabolizers (PMs)=3, extensive metabolizers (EMs)=40. The phenotype had a marked impact on nebivolol metabolism. The exposure to nebivolol was 15-fold greater for PMs in comparison to EMs.
Conclusion
40 EMs and 3 PMs were differentiated by using the pharmacokinetic parameters of nebivolol and its active metabolite. The study highlighted the existence of interphenotype differences regarding nebivolol metabolism and bioavailability.
Keywords: nebivolol, pharmacokinetics, CYP2D6, phenotype
Introduction
Nebivolol is a cardioselective third-generation β–blocker widely used for the treatment of hypertension [1,2]. In Europe, nevibolol is also indicated for stable mild and moderate chronic heart failure in combination with standard drug therapies in patients aged 70 years and over [2]. This beta-blocker has a dual mechanism of action, namely it is both highly β1-selective and promotes endothelium-dependent vasodilation [3,4]. Nebivolol is marketed as a racemic mixture of d- and l-enantiomers. Although d-nebivolol is responsible for the selective β1-adrenergic receptor antagonism and l-nebivolol for the vasodilatory effect [5], the combination appears to have greater antihypertensive activity than either enantiomer alone [6].
This beta-blocker is rapidly absorbed after oral administration and its absorption is not affected by food [1,2,7]. Peak plasma concentrations are achieved 1 hour after healthy volunteers receive a single dose of 5 mg nebivolol. It is primarily metabolized hepatically by CYP2D6, a metabolic pathway that is under polymorphic genetic regulation [8–11]. The mechanisms involved include the following: N-dealkylation, hydroxylation, oxidation and glucuronidation [8,9]. Both aromatic hydroxylated and alicyclic oxidized molecules are pharmacologically active metabolites, similar to the parent drug [11,12], whereas the N-dealkylated metabolite and glucuronides are inactive metabolites [11]. The oral bioavailability is 12 % in extensive metabolizers (EMs) and 96 % in poor metabolizers (PMs) [9,12]. The half-life of nebivolol is approximately 10 hours in EMs, but can be prolonged up to 30–50 hours in PMs [10]. When given orally to EMs, approximately 38% is excreted in the urine and 44% in the feces, but when given to PMs, the primary route of elimination is the urine followed by feces, 67 versus 13%, respectively [8].
CYP2D6 is a member of the the cytochrome P450 (CYPs) enzyme superfamily that is involved in the metabolism of a large number of drugs. Although it accounts for only a small percentage of all hepatic CYPs (2–4 %), it is involved in the metabolism of approximately 25 % of currently used drugs [13]. Typical substrates for CYP2D6 include antidepressants, antipsychotics, antiarrhytmics, antiemetics, beta-blockers, tamoxifen and opioids [13,14].
Four metabolizer phenotypes are used to characterize drug metabolism via CYP2D6 in vivo: ultra-rapid metabolizers (UM), extensive metabolizers (EMs), intermediate metabolizers (IMs) and poor metabolizers (PMs) [15].
The objective of this study was to identify the metabolizer phenotype based on the pharmacokinetic parameters of nebivolol and its active metabolite (4-OH-nebivolol) and to assess whether the phenotype has an impact on nebivolol bioavailability and metabolism.
Material and methods
The study was conducted in full conformity with the Declaration of Helsinki (1964) and its amendments (Tokyo 1975, Venice 1983, Hong Kong 1989) and Good Clinical Practice (GCP) rules. The clinical protocol was reviewed and approved by the Ethics Committee of the Iuliu Hatieganu University of Medicine and Pharmacy and all volunteers gave their written informed consent prior to any study procedure.
Subjects
Subjects were considered eligible for inclusion in the study if they were healthy, non-smoking, Caucasian males or females aged between 18 and 55 years and who had a body mass index ranged between 19 and 25 kg/m2. The assessment was based on detailed medical history, general physical examination, electrocardiogram (ECG), vital signs and laboratory investigations.
The subjects were excluded if any clinically relevant abnormality was identified at the physical examination or clinical laboratory tests. A significant medical history that can alter drug response, the use of any medication within 14 days before the drug administration and the unwillingness to follow the study requirements were also considered exclusion criteria.
Study sample
Forty-three subjects were included in the study.
Study design
The study was designed as an open-label, non-randomized clinical trial and each subject received a single oral dose of 5 mg nebivolol. The drug was administered in the morning, after overnight fasting (12 h) and with at least 150 mL water.
Venous blood (5 ml) was drawn into heparinized tube before dosing and at the following times: 0.5, 1, 1.5, 2, 2.5, 3, 4, 6, 8, 10, 12, 24, 36 and 48 hours after drug administration. The separated plasma was stored frozen (−20°C) until analysis.
The pharmaceutical product used was Nebilet (5 mg nebivolol, tablets, producer Berlin-Chemie AG (Menarini Group), Germany).
Bioanalytical methods
The plasma concentrations of nebivolol and its corresponding hydroxylated metabolite (4-OH-nebivolol) were analyzed by a validated high-throughput liquid chromatography-mass spectrometry method. The HPLC system was an Agilent 1100 series (binary pump, autosampler, thermostat) (Agilent Technologies, USA) and was coupled with an Brucker Ion Trap SL (Brucker Daltonics GmbH, Germany). A Zorbax SB-C18 chromatographic column (100 mm × 3.0 mm i.d., 3.5 μm) (Agilent Technologies) was used. The mobile phase consisted of 64:36 (v/v) 0.2%(V/V) formic acid in water: methanol. The flow rate was 1 ml/min and the thermostat temperature set at 45 °C. The mass spectrometry detection was in multiple reaction monitoring mode, positive ions, using an electrospray ionization source. The ion transitions monitored were m/z 406 for nebivolol and m/z 404 from m/z 422 for its hydroxylated metabolite.
Pharmacokinetic analysis
Non-compartmental pharmacokinetic (PK) analysis was employed to determine the pharmacokinetic parameters of nebivolol and its hydroxylated active metabolite (4-OH-nebivolol). The analytical method for nebivolol determination was not enantioselective. The maximum plasma concentration (Cmax, ng/ml) and the time to reach the peak concentration (tmax, h) were obtained directly by visual inspection of each subject’s plasma concentration-time profile. The area under the concentration-time curve (AUC0-t) was estimated by integration using the trapezoidal rule from time zero to the last measurable concentration at time t. The area was extrapolated to infinity (AUC0-∞) by addition of Ct/kel to AUC0-t where Ct is the last quantifiable drug concentration and kel is the elimination rate constant. The pharmacokinetic analysis was carried out using Phoenix WinNonlin 6.1 (Pharsight, USA).
Statistical analysis
The phenotypic distribution was assessed based on the AUC0-∞ metabolic ratio (R_AUC nebivolol/4-OH-nebivolol). The metabolic ratio was determined for each subject and the lower values were associated with the extensive metabolizer (EM) phenotype, meanwhile the higher values were attributed to the poor metabolizer (PM) phenotype. Histograms were also used to represent the intersubject variability concerning the AUC metabolic ratios.
The normal distribution of the AUC metabolic ratios (R_AUC nebivolol/4-OH-nebivolol) was evaluated by using the Shapiro-Wilk test. The statistical analysis was performed using SPSS 21.0 (SPSS Inc., USA) software. A p value less than 0.05 was considered to be statistically significant.
After the identification of poor metabolizers (PMs) and extensive metabolizers (EMs), the differences between nebivolol bioavailability and metabolism were evaluated for each phenotype by using the AUC and Cmax mean values.
Results
Demographics
The main characteristics (mean±SD) of the subjects included in the study and identified as EMs or PMs are presented in Table I.
Table I.
Demographic data.
| Patient characteristics | EMs (n=40) | PMs (n=3) |
|---|---|---|
| Age (years) | 25.08 ± 2.70 | 29.67 ± 9.24 |
| Height (cm) | 1.76 ± 0.09 | 1.74 ± 0.03 |
| Weight (kg) | 72.33 ± 13.44 | 73.33 ± 6.66 |
| Body mass index (kg/m2) | 23.29 ± 2.98 | 24.17 ± 1.17 |
Assessment of the phenotypic distribution
The pharmacokinetic results, respectively the AUC values for nebivolol and its active metabolite, as well as the AUC metabolic ratios (R_AUC nebivolol/4-OH-nebivolol) for each subject are summarized in Table II.
Table II.
AUC and R_AUC individual values.
| Subject | AUC_nebivolol (h*ng/ml) | AUC_4-OH-nebivolol (h*ng/ml) | R_AUC nebivolol/4-OH-nebivolol |
|---|---|---|---|
| 1 | 18.12 | 15.27 | 0.84 |
| 2 | 48.47 | 36.11 | 0.74 |
| 3 | 4.32 | 9.59 | 2.22 |
| 4 | 3.16 | 6.08 | 1.92 |
| 5 | 26.25 | 239.47 | 9.12 |
| 6 | 15.3 | 6.68 | 0.44 |
| 7 | 35.46 | 19.27 | 0.54 |
| 8 | 6.63 | 13.51 | 2.04 |
| 9 | 22.18 | 4.63 | 0.21 |
| 10 | 5.68 | 7.68 | 1.35 |
| 11 | 6.37 | 4.98 | 0.78 |
| 12 | 3.24 | 8.06 | 2.49 |
| 13 | 9.8 | 3.54 | 0.36 |
| 14 | 13.12 | 10.6 | 0.81 |
| 15 | 3.21 | 4.85 | 1.51 |
| 16 | 34.23 | 232.43 | 6.79 |
| 17 | 4.38 | 3.43 | 0.78 |
| 18 | 33.71 | 16.84 | 0.50 |
| 19 | 78.35 | 42.46 | 0.54 |
| 20 | 5.48 | 4.28 | 0.78 |
| 21 | 13.5 | 11.59 | 0.86 |
| 22 | 32.47 | 29.74 | 0.92 |
| 23 | 6.12 | 3.48 | 0.57 |
| 24 | 4.14 | 2.41 | 0.58 |
| 25 | 14.42 | 5.69 | 0.39 |
| 26 | 21.39 | 7.3 | 0.34 |
| 27 | 3.28 | 5.18 | 1.58 |
| 28 | 7.98 | 9.29 | 1.16 |
| 29 | 6.35 | 2.56 | 0.40 |
| 30 | 41.69 | 26.31 | 0.63 |
| 31 | 13.8 | 19.29 | 1.40 |
| 32 | 11.44 | 5.75 | 0.50 |
| 33 | 3.81 | 3.88 | 1.02 |
| 34 | 3.64 | 1.44 | 0.40 |
| 35 | 4.72 | 2.64 | 0.56 |
| 36 | 25.1 | 7.26 | 0.29 |
| 37 | 4.79 | 7.01 | 1.46 |
| 38 | 30.47 | 211.77 | 6.95 |
| 39 | 27.71 | 15.43 | 0.56 |
| 40 | 3.78 | 6.12 | 1.62 |
| 41 | 1.7 | 2.09 | 1.23 |
| 42 | 6.39 | 5.12 | 0.80 |
| 43 | 10.91 | 5.64 | 0.52 |
AUC_nebivolol - area under the plasma concentration–time curve from time 0 to infinity for nebivolol; AUC_4-OH-nebivolol - area under the plasma concentration–time curve from time 0 to infinity for nebivolol hydroxylated active metabolite (4-OH-nebivolol); R_AUC nebivolol/4-OH-nebivolol – metabolic ratio (AUC_nebivolol/AUC_4-OH-nebivolol)
The histogram analysis of the R_AUC values for nebivolol/4-OH nebivolol is presented in Figure 1.
Figure 1.
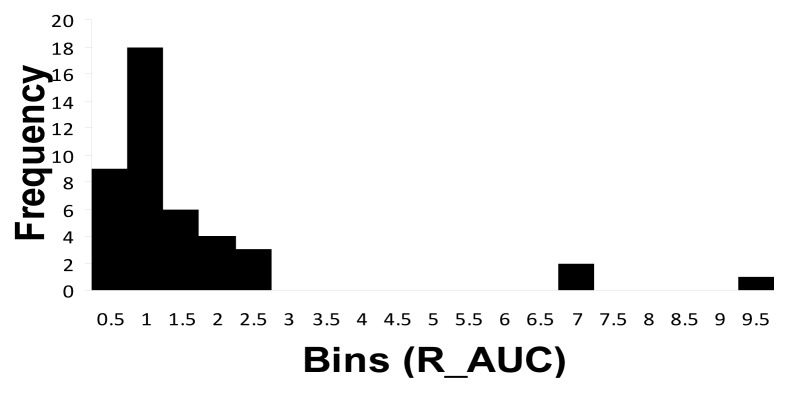
R_AUC metabolic ratio as histogram representation.
Table III presents the result of the statistical analysis test used to investigate the normality of distribution for the R_AUC values.
Table III.
Statistical data for normality of distribution.
| Shapiro-Wilk | |||
|---|---|---|---|
| R_AUC nebivolol/4-OH-nebivolol | Statistic | df | p-value* |
| 0.500 | 43 | 0.000 | |
AUC - area under the plasma concentration–time curve from time zero to infinity;
R_AUC – metabolic ratio (AUC nebivolol/4-OH-nebivolol)
p<0.05 – statistically significant
Phenotypic differences in nebivolol bioavailability and metabolism
The mean plasma concentration–time curve of nebivolol and its corresponding hydroxylated active metabolite for each phenotype (mean values ±SD), are illustrated in Figure 2 (nebivolol), Figure 3 (4-OH-nebivolol) and Figure 4 (nebivolol + 4-OH-nebivolol, sum of molar concentrations).
Figure 2.

Mean ± SD plasma concentration–time curves of nebivolol for extensive metabolizers (EMs) and poor metabolizers (PMs).
Figure 3.

Mean ± SD plasma concentration–time curves of 4-OH-nebivolol for extensive metabolizers (EMs) and poor metabolizers (PMs).
Figure 4.

Mean ± SD plasma concentration–time curves of nebivolol + 4-OH-nebivolol (sum) for extensive metabolizers (EMs) and poor metabolizers (PMs).
The median values for the pharmacokinetic parameters (AUC0-∞ and Cmax) of nebivolol and its active hydroxylated metabolite are presented in Table IV, depending on the phenotype (EMs or PMs).
Table IV.
Median AUC and Cmax values for nebivolol and 4-OH-nebivolol according to each phenotype (EMs and PMs) and the corresponding interphenotype comparison (PMs/EMs).
| Pharmacokinetic parameters (mean ±SD) | PMs (n=3) | EMs (n=40) | PM/EMs (%) |
|---|---|---|---|
| AUC_nebivolol (h*ng/ml) | 139.22 ± 20.80 | 9.19 ± 8.91 | 1514.9 |
| AUC_4-OH-nebivolol (h*ng/ml) | 13.54 ± 1.33 | 9.34 ± 7.98 | 144.9 |
| Cmax _nebivolol (ng/ml) | 5.24 ± 0.48 | 1.66 ± 0.86 | 315.6 |
| Cmax _4-OH-nebivolol (ng/ml) | 0.43 ± 0.06 | 0.63 ± 0.22 | 68.2 |
Cmax - maximum plasma concentration; AUC - area under the plasma concentration–time curve from time zero to infinity; EMs – extensive metabolizers; PMs – poor metabolizers
Discussion
Phenotyping consists of the administration of a probe drug metabolised by an individual specific CYP. A particular metabolic profile ca be defined based on the assessment of different pharmacokinetic parameters of the probe drug and its metabolites or the determination of a metabolic ratio between the drug and its metabolite [14]. Although several drugs, like debrisoquine, sparteine and dextromethorphan have been used as CYP2D6 phenotyping probes [14], the present study used nebivolol as a probe drug. This was possible considering that nebivolol undergoes extensive hepatic metabolism through the cytochrome P450 2D6 (CYP2D6) [8–11]. CYP2D6 is considered to be the most studied polymorphically expressed drug metabolising enzyme in humans [16]. Two major phenotypes exist, extensive metabolizers (EMs) and poor metabolizers (PMs), together with the two less studied phenotypes of ultrarapid metabolizers (UMs) and intermediate metabolizers (IMs) [17]. EMs have normal enzymatic activity and represent 60–85 % of the Caucasian population [14]. The poor metabolizer status (PM) is an autosomal recessive trait produced by mutation and (or) deletion of both alleles for phenotypic expression. This phenotype is characterized by a deficiency in forming the relevant metabolite(s) of affected substrate due to the much slower biotransformation rate and is associated with accumulation of specific drug substrates [18]. Phenotypically, the CYP2D6 PMs compose approximately 5–10% of the Caucasian population [13,14].
In the present study, after performing the metabolic ratio (R_AUC) analysis of nebivolol/4-OH-nebivolol (its active hydroxylated metabolite) for each individual (Table 2), three subjects, subject number 5, 16 and 38 respectively, were outlined from the rest of the group. In comparison to the other participants, these subjects presented higher R_AUC metabolic ratios, thus suggesting the existence of two different phenotypes in the study sample. The presence of two distinct groups was also demonstrated by using the histogram analysis (Fig. 1) that emphasized the existence of extreme R_AUC values for the three subjects mentioned above. Furthermore, the statistical test which verified the normality of distribution (Table 3) showed that the analyzed data (R_AUC values) was not normally distributed, which indicated that the group is heterogeneous. Consequently, the forty-three subjects included in the study can be separated as follows: one group of 40 subjects with lower values for R_AUC and a second group consisting of 3 subjects with higher R_AUC values. More precisely, the metabolic ratio (R_AUC) of nebivolol/4-OH- nebivolol and the statistical analysis clearly demonstrated the existence of two different phenotypic groups: PMs (3 subjects, respectively number 5, 16 and 38) and EMs (the other 40 subjects).
After the phenotypic analysis, the pharmacokinetic parameters of nebivolol and its active metabolite were further used to evaluate the interphenotype bioavailability and metabolism of nebivolol. Fig. 2 illustrated the mean plasma concentrations of nebivolol for each phenotype (EMs and PMs) and underlined that nebivolol plasma concentrations were greater for the PMs in comparison to EMs. Additionally, when the sum of the molar concentrations of nebivolol and its metabolite was depicted in Fig. 4, it was established that the PMs were associated with notable higher concentrations in comparison to EMs. As for the hydroxylated metabolite, it was expected that for the PM phenotype, the mean plasma concentrations to be much lower than for the EM phenotype, but that was not the case in the present study. The mean plasma concentration-time profile for 4-OH-nebivolol presented in Fig. 3 revealed that the interphenotype differences were not marked.
Considering each metabolizer phenotype (EMs or PMs), the median values for the pharmacokinetic parameters (AUC0-∞ and Cmax) of nebivolol and 4-OH-nebivolol were described in Table 4. By analyzing these values, it was established that depending on the phenotype, there were significant differences between the AUC and Cmax values for nebivolol, but not for its active metabolite. A comparative analysis of the parameters presented in Table 4 emphasized that for the PMs, nebivolol bioavailability was 15-fold greater (AUC) and the maximum plasma concentration 3-fold greater (Cmax) than for the EMs. Therefore, PM phenotype was associated with an increased exposure to nebivolol due to the much slower metabolism of the drug. For the same phenotype (PMs), even though the mean peak plasma concentration (Cmax) proved to be higher for the EMs (0.63 ± 0.22 vs 0.43 ± 0.06 ng/ml), the exposure to 4-OH-nebivolol was 1.4-fold greater (AUC) than the levels determined for the EMs, thus suggesting that the active metabolite is further metabolized via CYP2D6 and is also directly influenced by the CYP2D6 phenotype. Therefore, a possible explanation to this result is that, although for the PMs the biotransformation from nebivolol to 4-OH-nebivolol is much slower, this process is balanced by the clearance of the metabolite that is also reduced considering the CYP2D6 poor metabolizer phenotype.
Similar studies that investigated the impact of CYP2D6 phenotype upon metoprolol metabolism showed that the AUCs of metoprolol were 4- to 6-fold higher in PMs than in EMs after a single dose and 3- to 4-fold higher after repeated dosing [13]. Hence, in the present study, the phenotype impact on nebivolol metabolism (15-fold increased exposure to nebivolol for the PMs) was much greater than for metoprolol and underlines the need of additional studies that evaluate the clinical relevance of this result.
PMs imply a decreased metabolism of drugs and require lower dosages to avoid toxic effects. The status of poor metabolizer is more frequently associated with adverse effects due to elevated drug plasma levels if the metabolism of the drug depends on CYP2D6 [19]. The clinical significance of impaired elimination of β-blockers is considered to be controversial, and most studies suffer from small numbers of CYP2D6 PMs [20]. For example, the impact of CYP2D6 polymorphisms on metoprolol clinical response is still a subject of debate due to conflicting results presented in various studies. Several studies reported increased metoprolol plasma concentrations which result in greater reductions in heart rate and blood pressure and an increased risk of adverse drug reactions [15,20,21], meanwhile other studies showed no increased risk of side effects or an increased antihypertensive response to metoprolol [22,23]. As for nebivolol, Lefebvre et al investigated the influence of CYP2D6 phenotype on the clinical response of nebivolol in patients with essential hypertension and concluded that CYP2D6 phenotype significantly influenced the metabolism of nebivolol, but not its antihypertensive efficacy and tolerability. A possible explanation for the similar clinical response in EMs and PMs was attributed to the existence of active hydroxylated metabolites of nebivolol that may contribute to the overall antihypertensive effect in EMs [24]. Nonetheless, the clinical relevance of CYP2D6 phenotype on nebivolol therapy needs further investigation.
Phenotyping is also an important step before initiating pharmacokinetic drug-drug interaction studies. Substrates with a high affinity bind strongly to CYP2D6 and become enzymatic inhibitors of the metabolism of other compounds which have lower affinity. This drug interaction would be visible in EMs, but not in PMs as they do not have CYP2D6 enzymes to compete for [19]. Therefore, without phenotyping or genotyping, the presence of PMs can interfere with the outcome of the study.
Two potential limitations of this study are the lack of CYP2D6 genotype data for the subjects and the relative small number of subjects included, emphasizing the fact that CYP2D6 genotyping is necessary in order to accurately establish the phenotype status and to validate the results presented in this study.
Conclusion
The AUC metabolic ratios of nebivolol and its active metabolite and the statistical analysis highlighted the existence of two groups of subjects (PMs and EMs). Nebivolol bioavailability was greater for the PMs in comparison with EMs, suggesting the potential need for individualized treatment strategies in order to manage nebivolol therapy for PMs.
Acknowledgement
This work was supported by CNCS Romania – project PN-II-IDPCE-2011-3-0731.
PhD student acknowledges financial support from a POSDRU grant, no. 159/1.5/S/136893 with title: “Inter-university strategic partnership in order to improve the quality of medical research in by granting doctoral and postdoctoral scholarships - DocMed.Net_2.0”.
References
- 1.Hilas O, Ezzo D. Nebivolol (Bystolic), a novel beta-blocker for hypertension. P T. 2009;34(4):188–192. [PMC free article] [PubMed] [Google Scholar]
- 2.Baldwin CM, Keam SJ. Nebivolol in the treatment of hypertension in the US. Am J Cardiovasc Drugs. 2009;9(4):253–260. doi: 10.2165/1120274-000000000-00000. [DOI] [PubMed] [Google Scholar]
- 3.Moen MD, Wagstaff AJ. Nebivolol: A Review of its use in the management of hypertension and chronic heart failure. Drugs. 2006;66(10):1389–1409. doi: 10.2165/00003495-200666100-00007. [DOI] [PubMed] [Google Scholar]
- 4.Cockcroft J. A review of the safety and efficacy of nebivolol in the mildly hypertensive patient. Vasc Health Risk Manag. 2007;3(6):909–917. [PMC free article] [PubMed] [Google Scholar]
- 5.Zanchetti A. Clinical pharmacodynamics of nebivolol: new evidence of nitric oxide-mediated vasodilating activity and peculiar haemodynamic properties in hypertensive patients. Blood Press Suppl. 2004;1:17–32. doi: 10.1080/08038020410016548. [DOI] [PubMed] [Google Scholar]
- 6.Weber MA. The role of the new β-Blockers in treating cardiovascular disease. Am J Hypertens. 2005;18:169S–176S. doi: 10.1016/j.amjhyper.2005.09.009. [DOI] [PubMed] [Google Scholar]
- 7.Gielen W, Cleophas TJ, Agrawal R. Nebivolol: a review of its clinical and pharmacological characteristics. Int J Clin Pharmacol Ther. 2006;44(8):344–357. doi: 10.5414/cpp44344. [DOI] [PubMed] [Google Scholar]
- 8.Wojciechowski D, Papademetriou V. β-blockers in the management of hypertension: focus on nebivolol. Expert Rev Cardiovasc Ther. 2008;6(4):471–479. doi: 10.1586/14779072.6.4.471. [DOI] [PubMed] [Google Scholar]
- 9.Gray CL, Ndefo UA. Nebivolol: A new antihypertensive agent. Am J Health-Syst Pharm. 2008;65:1125–1133. doi: 10.2146/ajhp070459. [DOI] [PubMed] [Google Scholar]
- 10.Veverka A, Salinas JL. Nebivolol in the treatment of chronic heart failure. Vasc Health Risk Manag. 2007;3(5):647–654. [PMC free article] [PubMed] [Google Scholar]
- 11.Cheng JW. Nebivolol: A third -generation β-blocker for hypertension. Clin Ther. 2009;31(3):447–462. doi: 10.1016/j.clinthera.2009.03.007. [DOI] [PubMed] [Google Scholar]
- 12.Dery AS, Hamilton LA, Starr JA. Nebivolol for the treatment of heart failure. Am J Health Syst Pharm. 2011;68(10):879–886. doi: 10.2146/ajhp100309. [DOI] [PubMed] [Google Scholar]
- 13.Zhou SF. Polymorphism of Human Cytochrome P450 2D6 and its clinical significance: Part I. Clin Pharmacokinet. 2009;48(11):689–723. doi: 10.2165/11318030-000000000-00000. [DOI] [PubMed] [Google Scholar]
- 14.Samer CF, Ing Lorenzini K, Rollason V, Daali Y, Desmeules JA. Applications of CYP450 testing in the clinical setting. Mol Diagn Ther. 2013;17:165–184. doi: 10.1007/s40291-013-0028-5. [DOI] [PMC free article] [PubMed] [Google Scholar]
- 15.Blake CM, Kharasch ED, Schwab M, Nagele P. A meta-analysis of CYP2D6 metabolizer phenotype and metoprolol pharmacokinetics. Clin Pharmacol Ther. 2013;94(3):394–399. doi: 10.1038/clpt.2013.96. [DOI] [PMC free article] [PubMed] [Google Scholar]
- 16.Ingelman–Sundberg M. Genetic polymorphisms of cytochrome P450 2D6 (CYP2D6): clinical consequences, evolutionary aspects and functional diversity. Pharmacogenomics J. 2005;5:6–13. doi: 10.1038/sj.tpj.6500285. [DOI] [PubMed] [Google Scholar]
- 17.Beyoglu D, Idle JR. A history and overview of phenotypic variability in CYP2D6 activity. In: Baumann P, editor. CYP2D6: Genetics, Pharmacology and Clinical Relevance. London: Future Medicine Ltd; 2014. pp. 8–27. [Google Scholar]
- 18.Abraham BK, Adithan C. Genetic polymorphism of CYP2D6. Indian J Pharmacol. 2001;33:147–169. doi: 10.1007/s002280000231. [DOI] [PubMed] [Google Scholar]
- 19.Teh LK, Bertilsson L. Pharmacogenomics of CYP2D6: molecular genetics, interethnic differences and clinical importance. Drug Metab Pharmacokinet. 2012;27(1):55–67. doi: 10.2133/dmpk.dmpk-11-rv-121. [DOI] [PubMed] [Google Scholar]
- 20.Bijl MJ, Visser LE, Van Schaik RHN, Kors JA, Witteman JCM, Hofman A, et al. Genetic variation in the CYP2D6 gene is associated with a lower heart rate and blood pressure in β-Blocker users. Clin Pharmacol Ther. 2009;85(1):45–50. doi: 10.1038/clpt.2008.172. [DOI] [PubMed] [Google Scholar]
- 21.Wuttke H, Rau T, Heide R, Bergmann K, Bohm M, Weil J, et al. Increased frequency of cytochrome P450 2D6 poor metabolizers among patients with metoprolol-associated adverse effects. Clin Pharmacol Ther. 2002;72:429–437. doi: 10.1067/mcp.2002.127111. [DOI] [PubMed] [Google Scholar]
- 22.Hamadeh IS, Langaee TY, Dwivedi R, Garcia S, Burkley BM, Skaar TC, et al. Impact of CYP2D6 polymorphisms on clinical efficacy and tolerability of metoprolol tartrate. Clin Pharmacol Ther. 2014;96(2):175–181. doi: 10.1038/clpt.2014.62. [DOI] [PMC free article] [PubMed] [Google Scholar]
- 23.Zineh I, Beitelshees AL, Gaedigk A, Walker JR, Pauly DF, Eberst K, et al. Pharmacokinetics and CYP2D6 genotypes do not predict metoprolol adverse events or efficacy in hypertension. Clin Pharmacol Ther. 2004;76(6):536–544. doi: 10.1016/j.clpt.2004.08.020. [DOI] [PubMed] [Google Scholar]
- 24.Lefebvre J, Poirier L, Poirier P, Turgeon J, Lacourciere Y. The influence of CYP2D6 phenotype on the clinical response of nebivolol in patients with essential hypertension. Br J Clin Pharmacol. 2007;63(5):575–582. doi: 10.1111/j.1365-2125.2006.02796.x. [DOI] [PMC free article] [PubMed] [Google Scholar]