

Abstract
Background:
Mild traumatic brain injury (TBI) is a common public health issue that may contribute to chronic degenerative disorders. Membrane lipids play a key role in tissue responses to injury, both as cell signals and as components of membrane structure and cell signaling. This study demonstrates the ability of high resolution mass spectrometry imaging (MSI) to assess sequences of responses of lipid species in a rat controlled cortical impact model for concussion.
New method:
A matrix of implanted silver nanoparticles was implanted superficially in brain sections for matrix-assisted laser desorption (MALDI) imaging of 50 μm diameter microdomains across unfixed cryostat sections of rat brain. Ion-mobility time-of-flight MS was used to analyze and map changes over time in brain lipid composition in a rats after Controlled Cortical Impact (CCI) TBI.
Results:
Brain MS images showed changes in sphingolipids near the CCI site, including increased ceramides and decreased sphingomyelins, accompanied by changes in glycerophospholipids and cholesterol derivatives. The kinetics differed for each lipid class; for example ceramides increased as early as 1 day after the injury whereas other lipids changes occurred between 3 and 7 days post injury.
Comparison with existing method(s):
Silver nanoparticles MALDI matrix is a sensitive new tool for revealing previously undetectable cellular injury response and remodeling in neural, glial and vascular structure of the brain.
Conclusions:
Lipid biochemical and structural changes after TBI could help highlighting molecules that can be used to determine the severity of such injuries as well as to evaluate the efficacy of potential treatments.
Keywords: Traumatic brain injury, Controlled cortical impact, Mass spectrometry imaging, Silver nanoparticles implantation, Lipids
Graphical abstract

1. Introduction
Traumatic brain injury (TBI) is damage to the brain that temporarily or permanently impairs brain structure and functions. It is a serious public health problem and results in many permanent disabilities. The CDC reported that over 1.7 million people sustain TBI every year in the United States, which accounts for about a third (30.5%) of all injury-related deaths (Faul et al., 2010). Even non-lethal TBI causes a wide range of short and long term functional changes including sensory and cognitive impairments involving memory, movement, vision, hearing, as well as emotional dysfunctions, personality changes and depression (Rao and Lyketsos, 2000; Kushner, 1998). Moreover TBI increases risks of epilepsy (Agrawal et al., 2006) and other brain disorders with symptoms resembling Alzheimer’s and Parkinson’s diseases (National Institute of Neurological Disorders and Stroke, 2002). The pathophysiology of TBI involves two stages: (1) the primary injury occurring at impact resulting in direct tissue damage and impairment of cerebral blood flow and metabolism (Hardman and Manoukian, 2002), and (2) the secondary injury resulting from biochemical and pathological processes initiated by the mechanical damage (Hardman and Manoukian, 2002). Secondary injuries such as cerebral ischemia, intracranial hypertension, inflammation and edema are the leading causes of hospital deaths from a TBI etiology (Marshall et al., 1991).
When studying the brain, lipids are of particular interest because they account for more than 50% of its dry weight, are the major components of cell membranes, are repositories of chemical energy and play key roles in cell signaling and signal transduction (Fernandis and Wenk, 2007; Piomelli, 2005; Piomelli et al., 2007). The crucial role of lipids in brain physiology and cell signaling was demonstrated in neurologic disorders and several neurodegenerative diseases such as Alzheimer’s, Parkinson’s, and Niemann–Pick disease, in which the lipid metabolic pathways are disrupted (Sturley et al., 2004; Sharon et al., 2003; Cutler et al., 2004; Wenk, 2005). We previously studied a mild blast TBI model (Woods et al., 2013) and discovered a regionally specific accumulation of the ganglioside GM2 which plays a major role in cell recognition and signaling in the hippocampus, thalamus and hypothalamus. These changes were accompanied by depletion of ceramides, suggesting that lipids participate in both function and structure of neural membranes, and that disruption of lipid metabolism might be a key event in the pathophysiology of TBI (Adibhatla et al., 2006).
Driven by advances in mass spectrometry, the field of lipidomics has grown rapidly in the last two decades (Wenk, 2005, 2010). Direct tissue analysis/mass spectrometry imaging (MSI) allows both the characterization of lipid species and the mapping of their distribution in tissue (Jackson et al., 2005; Colsch and Woods, 2010; Delvolve et al., 2011). Matrix-assisted laser desorption/ionization mass spectrometry (MALDI-MS) is the most commonly used mass spectrometric technique for MSI (Woods and Jackson, 2006; Fernandez et al., 2011). Since MSI is an in situ method, there is no pre-analysis separation step needed before mass analysis. Although simple in concept, proper sample preparation is a key prerequisite for detecting analytes of interest by MSI. Recently, we developed a highly accurate and reproducible method for implanting silver nanoparticles (AgNPs) in tissue sections (Jackson et al., 2014). Stable and homogenous AgNPs matrix layers results in highly reproducible tissue implantation, thus yielding high quality images of the regional distribution of several lipid species in both heart and kidney tissue as well as in a mouse model of chronic alcohol abuse (Jackson et al., 2014; Muller et al., 2015; Roux et al., 2014). In the current study, a controlled cortical impact (CCI) injury model (Romine et al., 2014) in adult male rats were used to study the progression of the pathology resulting from TBI up to 7 days post injury. MSI with AgNPs was used to locate, analyze and study the changes in brain lipid composition at different time points.
2. Material and methods
2.1. Animals
All procedures were performed under protocols approved by the Uniformed Services University Animal Care and Use Committee. Adult male Sprague-Dawley rats, weighing 225–250 g at the start of the study, were kept in a 12/12 h light/dark cycle with access to food and water ad libitum. Animals were divided in 2 groups, controls (Sham) and Injured (CCI). The CCI group was subdivided into 3 sub-groups, reflecting the time elapsed after trauma before the animals were sacrifice (at day 1, 3 and 7). All groups, including Sham, contained 4 animals.
2.2. Controlled cortical impact
This method uses a rigid impactor to deliver mechanical energy to intact dura, exposed following a craniotomy (Romine et al., 2014) in rats anesthetized with isoflurane. The impact was centered 2.04 mm posterior to bregma and 3.0 mm left of the midline (Fig. 1) [−2.04 mm, Fig. 50 in Paxinos and Watson (2007) rat brain atlas]. The impactor had a 3 mm diameter flat tip and the parameters used for the impact were a depth of 2.0 mm, a velocity of 5 m/s and a latency of 2 ms. Control animals received no cortical impact strike, but otherwise received the same treatment as the CCI animals, including a craniotomy under isoflurane anesthesia. The animals were euthanized 1, 3 or 7 day post injury. Under ketamine/xylazine (100 mg/kg; 10 mg/kg) anesthesia, the chest of each rat was opened and the head perfused through a catheter placed in the ascending aorta with 50 to100 ml of phosphate buffered saline at room temperature, allowing blood to flush from the head through an opening in the superior vena cava. When the perfusate was largely clear of blood, the skull was carefully opened and the brain dissected. After removing meninges, each brain was rapidly frozen in a small beaker containing about 30 ml of cold isopentane pre-cooled by immersion of the beaker in solid CO2, then removed, wrapped individually in aluminum foil and stored at −80 ° C until sectioned. Coronal 18 μm sections through the area of the injury were cut using a cryostat (Leica Microsystems CM3050S, Bannockburn, IL) The specific location of individual sections was identified by comparisons of the morphology of major structures in relation to the Paxinos and Watson (2007)rat brain atlas.
Fig. 1.

Location of the Controlled cortical Impact in the Adult male Sprague-Dawley rat brains.
2.3. Tissue implantation and imaging
Tissue sections were implanted with silver nanoparticles (AgNP) 6 nm in diameter, using a nanoparticle implanter (Ionwerks, Houston, TX). A Thermo Scientific MALDI LTQ-XL-Orbitrap (Thermo Fisher Scientific, San Jose, CA) and Xcalibur software were used for MALDI mass spectrometry imaging (MSI) data acquisition. MS images of coronal sections near the level of bregma −2.04 mm were collected in positive and negative ion mode. The mass resolution was set to 60,000 for positive ion mode and 30,000 for negative ion mode and the mass ranges were 630–950 Da and 650–1000 Da respectively. The raster step size was 50 μm for both the X and Y directions. Imaging data were further analyzed with ImageWerks software (Ionwerks, Houston, TX). Images for a specific lipid are displayed using the same linear color scale to allow a visual comparison of intensities between samples. Intensities in positive ion mode were not normalized, but intensities in negative ion were normalized using the intensity of all ions in the spectrum to compensate for instrumental analytical variability (samples in negative ion mode were analyzed over a longer period of time). MS/MS was performed to confirm each lipid structure using CID energy between 15 and 40% but not all MS/MS were conclusive (Table 2).
Table 2.
Summary of all lipids imaged and statistical results of intensity comparison between Sham, CCI 1, 3 and 7 days post injury (ANOVA and Bonferroni post-test).
| Name | m/z | Ion | ANOVA | Bonferroni’s multiple comparison test | ||||||||
|---|---|---|---|---|---|---|---|---|---|---|---|---|
| p-Value | Sham vs 1D | Sham vs 3D | Sham vs 7D | 1D vs 3D | 1D vs 7D | 3D vs 7D | ||||||
| CERC16:0/d18:1† | 644.4171 | [M + Ag107]+ | 0.0036** | >0.05 | <0.01** | ↑ | >0.05 | <0.05* | >0.05 | >0.05 | ||
| CERC18:1/d18:1† | 670.4328 | [M + Ag107]+ | 0.0006*** | <0.001*** | ↑ | <0.05* | ↑ | >0.05 | >0.05 | >0.05 | >0.05 | |
| CERC18:0/d18:1† [Ag109] | 674.4481 | [M + Ag109]+ | 0.045** | <0.01** | ↑ | <0.05* | ↑ | >0.05 | >0.05 | >0.05 | >0.05 | |
| CER C20:0/d18:1† | 700.4797 | [M + Ag107]+ | 0.0139* | <0.05* | ↑ | <0.05* | ↑ | >0.05 | >0.05 | >0.05 | >0.05 | |
| SMC16:0/d18:1† | 687.5446 | [M – H—CH2]− | 0.0032** | >0.05 | <0.01** | ↑ | >0.05 | <0.01** | >0.05 | <0.05* | ||
| SMC18:1/d18:1† | 713.5603 | [M – H—CH2]− | 0.0059** | >0.05 | >0.05 | >0.05 | >0.05 | <0.05* | <0.01** | |||
| SMC18:0/d18:1† | 715.5759 | [M – H—CH2]− | 0.055 | >0.05 | >0.05 | >0.05 | >0.05 | >0.05 | >0.05 | |||
| SM C20:1/d18:1 or C20:0/d18:2 | 741.5916 | [M – H—CH2]− | Na | na | na | na | na | na | na | |||
| SM C20:0/d18:1 | 743.6072 | [M – H—CH2]− | 0.0285* | >0.05 | >0.05 | >0.05 | >0.05 | >0.05 | >0.05 | |||
| SM C22:1/d18:1 or C22:0/d18:2 | 769.6229 | [M – H—CH2]− | na | na | na | na | na | na | na | |||
| SM C22:0/d18:1 | 771.6385 | [M – H—CH2]− | 0.2166 | >0.05 | >0.05 | >0.05 | >0.05 | >0.05 | >0.05 | |||
| SM C24:1/d18:1 or C24:0/d18:2 | 797.6542 | [M – H—CH2]− | 0.0404* | >0.05 | >0.05 | >0.05 | >0.05 | >0.05 | >0.05 | |||
| GalCER C18:0/d18:1† | 834.5013 | [M +Ag107]+ | 0.6186 | >0.05 | >0.05 | >0.05 | >0.05 | >0.05 | >0.05 | |||
| GalCER C20:0/d18:1† | 862.5326 | [M + Ag107]+ | 0.8651 | >0.05 | >0.05 | >0.05 | >0.05 | >0.05 | >0.05 | |||
| GalCER C20:0/d18:1(OH)† | 878.5275 | [M + Ag107]+ | 0.7091 | >0.05 | >0.05 | >0.05 | >0.05 | >0.05 | >0.05 | |||
| GalCER C22:1/d18:1† | 888.5482 | [M + Ag107]+ | 0.2249 | >0.05 | >0.05 | >0.05 | >0.05 | >0.05 | >0.05 | |||
| GalCER C22:0/d18:1† [Ag109] | 892.5635 | [M + Ag109]+ | 0.1710 | >0.05 | >0.05 | >0.05 | >0.05 | >0.05 | >0.05 | |||
| GalCER C22:1/d18:1(OH)† | 904.5431 | [M + Ag107]+ | 0.1048 | >0.05 | >0.05 | >0.05 | >0.05 | >0.05 | >0.05 | |||
| GalCER C22:0/d18:1(OH)† [Ag109] | 908.5584 | [M + Ag109]+ | 0.0413* | >0.05 | >0.05 | >0.05 | >0.05 | >0.05 | >0.05 | |||
| GalCER C24:1/d18:2 & C24:2/d18:1† | 914.5639 | [M + Ag107]+ | 0.2463 | >0.05 | >0.05 | >0.05 | >0.05 | >0.05 | >0.05 | |||
| GalCER C24:1/d18:1† | 916.5795 | [M + Ag107]+ | 0.087 | >0.05 | >0.05 | >0.05 | >0.05 | >0.05 | >0.05 | |||
| GalCER C23:0/d18:1(OH)† [Ag109] | 922.5741 | [M + Ag109]+ | 0.2445 | >0.05 | >0.05 | >0.05 | >0.05 | >0.05 | >0.05 | |||
| GalCER C24:1/d18:2(OH)† | 930.5588 | [M + Ag107]+ | 0.5032 | >0.05 | >0.05 | >0.05 | >0.05 | >0.05 | >0.05 | |||
| GalCER C24:1/d18:1(OH)† | 932.5744 | [M +Ag107]+ | 0.1812 | >0.05 | >0.05 | >0.05 | >0.05 | >0.05 | >0.05 | |||
| GalCER C24:0/d18:1(OH)† [Ag109] | 936.5897 | [M + Ag109]+ | 0.0533 | >0.05 | >0.05 | >0.05 | >0.05 | >0.05 | >0.05 | |||
| ST C16:1/d18:1 or C16:0/d18:2 | 776.4988 | [M−H]− | 0.1704 | >0.05 | >0.05 | >0.05 | >0.05 | >0.05 | >0.05 | |||
| ST C18:1/d18:2 | 802.5145 | [M−H]− | 0.1642 | >0.05 | >0.05 | >0.05 | >0.05 | >0.05 | >0.05 | |||
| ST C18:1/d18:1 or C18:0/d18:2 | 804.5301 | [M−H]− | 0.7272 | >0.05 | >0.05 | >0.05 | >0.05 | >0.05 | >0.05 | |||
| ST C18:0/d18:1 | 806.5458 | [M−H]− | 0.3758 | >0.05 | >0.05 | >0.05 | >0.05 | >0.05 | >0.05 | |||
| ST C18:1/d18:1 or C18:0/d18:2(OH) | 820.5250 | [M−H]− | 0.3899 | >0.05 | >0.05 | >0.05 | >0.05 | >0.05 | >0.05 | |||
| ST C18:0/d18:1(OH)† | 822.5407 | [M−H]− | 0.1296 | >0.05 | >0.05 | >0.05 | >0.05 | >0.05 | >0.05 | |||
| ST C20:1/d18:1 or C20:0/d18:2 | 832.5614 | [M−H]− | 0.9619 | >0.05 | >0.05 | >0.05 | >0.05 | >0.05 | >0.05 | |||
| ST C20:0/d18:1 | 834.5771 | [M−H]− | 0.8750 | >0.05 | >0.05 | >0.05 | >0.05 | >0.05 | >0.05 | |||
| ST C20:1/d18:1 or C20:0/d18:2(OH) | 848.5563 | [M−H]− | 0.9047 | >0.05 | >0.05 | >0.05 | >0.05 | >0.05 | >0.05 | |||
| ST C20:0/d18:1(OH) | 850.5720 | [M−H]− | 0.6148 | >0.05 | >0.05 | >0.05 | >0.05 | >0.05 | >0.05 | |||
| ST C22:1/d18:1 or C22:0/d18:2 | 860.5927 | [M−H]− | 0.8938 | >0.05 | >0.05 | >0.05 | >0.05 | >0.05 | >0.05 | |||
| ST C22:0/d18:1† | 862.6084 | [M−H]− | 0.3535 | >0.05 | >0.05 | >0.05 | >0.05 | >0.05 | >0.05 | |||
| ST C22:0/d18:1(OH)† | 878.6033 | [M−H]− | 0.5479 | >0.05 | >0.05 | >0.05 | >0.05 | >0.05 | >0.05 | |||
| ST C24:1/d18:2 | 886.6084 | [M−H]− | 0.5351 | >0.05 | >0.05 | >0.05 | >0.05 | >0.05 | >0.05 | |||
| ST C24:1/d18:1† | 888.6240 | [M−H]− | 0.0209* | >0.05 | >0.05 | <0.05* | ↓ | >0.05 | >0.05 | >0.05 | ||
| ST C24:1/d18:1† | 890.6397 | [M−H]− | 0.2542 | >0.05 | >0.05 | >0.05 | >0.05 | >0.05 | >0.05 | |||
| ST C24:0/d18:1† | 902.6033 | [M−H]− | 0.9884 | >0.05 | >0.05 | >0.05 | >0.05 | >0.05 | >0.05 | |||
| ST C24:1/d18:2(OH)† | 904.6189 | [M−H]− | 0.2126 | >0.05 | >0.05 | >0.05 | >0.05 | >0.05 | >0.05 | |||
| ST C24:1/d18:1(OH)† | 906.6346 | [M−H]− | 0.4702 | >0.05 | >0.05 | >0.05 | >0.05 | >0.05 | >0.05 | |||
| ST C26:1/d18:1 or C26:0/d18:2 | 916.6553 | [M−H]− | 0.7257 | >0.05 | >0.05 | >0.05 | >0.05 | >0.05 | >0.05 | |||
| ST C25:0/d18:1(OH)† | 920.6502 | [M−H]− | 0.1958 | >0.05 | >0.05 | >0.05 | >0.05 | >0.05 | >0.05 | |||
| ST C26:1/d18:1 or C26:0/d18:2(OH) | 932.6502 | [M−H]− | 0.4993 | >0.05 | >0.05 | >0.05 | >0.05 | >0.05 | >0.05 | |||
| ST C26:0/d18:1(OH) | 934.6659 | [M−H]− | 0.3846 | >0.05 | >0.05 | >0.05 | >0.05 | >0.05 | >0.05 | |||
| DAG 32a:0 | 675.4117 | [M + Ag107]+ | 0.3495 | >0.05 | >0.05 | >0.05 | >0.05 | >0.05 | >0.05 | |||
| DAG 34a:2 | 699.4117 | [M + Ag107]+ | 0.0372* | >0.05 | >0.05 | >0.05 | >0.05 | >0.05 | >0.05 | |||
| DAG 34a:1 (16:0/18:1)† | 701.4274 | [M + Ag107]+ | 0.2731 | >0.05 | >0.05 | >0.05 | >0.05 | >0.05 | >0.05 | |||
| DAG 36a:4 | 723.4117 | [M + Ag107]+ | 0.0029** | >0.05 | <0.01** | ↑ | >0.05 | <0.05* | >0.05 | <0.05* | ||
| DAG 36a:2 (18:1/18:1 + 18:0/18:2)† | 727.4430 | [M + Ag107]+ | <0.0001*** | >0.05 | <0.001*** | ↑ | >0.05 | <0.001*** | >0.05 | <0.001*** | ||
| DAG 36a:1 [Ag109] | 731.4583 | [M + Ag109]+ | <0.0001*** | >0.05 | <0.001** | ↑ | >0.05 | <0.001** | >0.05 | <0.001** | ||
| DAG 38a:6 (20:6/18:0 + 22:6/16:0)† | 747.4117 | [M + Ag107]+ | <0.0001*** | >0.05 | <0.001*** | ↑ | >0.05 | <0.001*** | >0.05 | <0.001*** | ||
| DAG 38a:4 (18:0/20:4)† [Ag109] | 753.4427 | [M + Ag109]+ | <0.0001*** | >0.05 | <0.001** | ↑ | >0.05 | <0.001** | >0.05 | <0.001** | ||
| DAG 40a:6 (18:0/22:6)† | 775.4430 | [M + Ag107]+ | <0.0001*** | >0.05 | <0.001*** | ↑ | >0.05 | <0.001*** | >0.05 | <0.001*** | ||
| PE32a:0 | 690.5080 | [M−H]− | 0.3443 | >0.05 | >0.05 | >0.05 | >0.05 | >0.05 | >0.05 | |||
| PE34a:1 (16:0/18:1)† | 716.5236 | [M−H]− | 0.0012** | >0.05 | <0.05* | >0.05 | <0.01** | >0.05 | <0.05* | |||
| PE34a:0 | 718.5393 | [M−H]− | 0.6265 | >0.05 | >0.05 | >0.05 | >0.05 | >0.05 | >0.05 | |||
| PE36p:4 (16:0p/20:4)† | 722.5131 | [M−H]− | 0.2023 | >0.05 | >0.05 | >0.05 | >0.05 | >0.05 | >0.05 | |||
| PE 36a:4 (16:0/20:4)† | 738.5080 | [M−H]− | 0.3447 | >0.05 | >0.05 | >0.05 | >0.05 | >0.05 | >0.05 | |||
| PE36a:3 (18:2/18:1)† | 740.5236 | [M−H]− | 0.1387 | >0.05 | >0.05 | >0.05 | >0.05 | >0.05 | >0.05 | |||
| PE36a:2 (18:1/18:1)† | 742.5393 | [M−H]− | 0.0233* | >0.05 | >0.05 | >0.05 | >0.05 | <0.05* | >0.05 | |||
| PE36a:1 (18:0/18:1)† | 744.5549 | [M−H]− | 0.3001 | >0.05 | >0.05 | >0.05 | >0.05 | >0.05 | >0.05 | |||
| PE38p:6 (16:0p/22:6)† | 746.5131 | [M−H]− | 0.1358 | >0.05 | >0.05 | >0.05 | >0.05 | >0.05 | >0.05 | |||
| PE36a:0 | 746.5706 | [M−H]− | 0.0513 | >0.05 | >0.05 | >0.05 | >0.05 | >0.05 | >0.05 | |||
| PE 38a:6 (16:0/22:6)† | 762.5080 | [M−H]− | 0.0095** | >0.05 | <0.01** | >0.05 | >0.05 | >0.05 | >0.05 | |||
| PE38a:5 (18:1/20:4)† | 764.5236 | [M−H]− | 0.1727 | >0.05 | >0.05 | >0.05 | >0.05 | >0.05 | >0.05 | |||
| PE38a:4 (18:0/20:4)† | 766.5393 | [M−H]− | 0.8649 | >0.05 | >0.05 | >0.05 | >0.05 | >0.05 | >0.05 | |||
| PE38a:2 | 770.5706 | [M−H]− | 0.1391 | >0.05 | >0.05 | >0.05 | >0.05 | >0.05 | >0.05 | |||
| PE38a:1 (18:1/20:0)† | 772.5862 | [M−H]− | 0.1387 | >0.05 | >0.05 | >0.05 | >0.05 | >0.05 | >0.05 | |||
| PE40p:6(18:0p/22:6)† | 774.5444 | [M−H]− | 0.1485 | >0.05 | >0.05 | >0.05 | >0.05 | >0.05 | >0.05 | |||
| PE 40a:6 (18:0/22:6)† | 790.5393 | [M−H]− | 0.0170** | >0.05 | <0.05* | ↓ | >0.05 | >0.05 | >0.05 | >0.05 | ||
| PE 40a:5 | 792.5549 | [M−H]− | 0.2654 | >0.05 | >0.05 | >0.05 | >0.05 | >0.05 | >0.05 | |||
| PE 40a:4 | 794.5706 | [M−H]− | 0.0585 | >0.05 | >0.05 | >0.05 | >0.05 | >0.05 | >0.05 | |||
| PC32:0 (16:0/16:0)† | 840.4667 | [M + Ag107]+ | 0.0801 | >0.05 | >0.05 | >0.05 | >0.05 | >0.05 | >0.05 | |||
| PC 34:1 (18:1/16:0)† | 866.4824 | [M + Ag107]+ | 0.0077** | >0.05 | >0.05 | >0.05 | >0.05 | <0.05* | <0.05* | |||
| PI 34:1 | 835.5342 | [M−H]− | 0.3458 | >0.05 | >0.05 | >0.05 | >0.05 | >0.05 | >0.05 | |||
| PI 36:4 (16:0/20:4)† | 857.5186 | [M−H]− | 0.0151* | >0.05 | >0.05 | >0.05 | >0.05 | >0.05 | <0.05* | |||
| PI 38:6 (18:0/20:4 & 16:0/22:4)† | 881.5186 | [M−H]− | 0.3615 | >0.05 | >0.05 | >0.05 | >0.05 | >0.05 | >0.05 | |||
| PI 38:5 (18:1/20:4)† | 883.5342 | [M−H]− | 0.1508 | >0.05 | >0.05 | >0.05 | >0.05 | >0.05 | >0.05 | |||
| PI 38:4 (18:0/20:4)† | 885.5499 | [M−H]− | 0.2508 | >0.05 | >0.05 | >0.05 | >0.05 | >0.05 | >0.05 | |||
| PI 40:6(18:0/22:6)† | 909.5499 | [M−H]− | 0.7023 | >0.05 | >0.05 | >0.05 | >0.05 | >0.05 | >0.05 | |||
| Cholesterol [Ag109] | 709.0698 | [M + Ag3]+ | 0.6396 | >0.05 | >0.05 | >0.05 | >0.05 | >0.05 | >0.05 | |||
| CE (16:0) | 731.4896 | [M + Ag107]+ | <0.0001*** | >0.05 | <0.001*** | ↑ | <0.001*** | ↑ | <0.001*** | <0.001*** | <0.05* | |
| CE (18:2) | 755.4896 | [M + Ag107]+ | 0.0078** | >0.05 | <0.05* | ↑ | >0.05 | <0.05* | >0.05 | <0.05* | ||
| CE (18:1)† | 757.5052 | [M + Ag107]+ | 0.0011** | >0.05 | <0.01** | ↑ | <0.05* | ↑ | <0.01** | <0.05* | >0.05 | |
| CE(20:4)†[Ag109] | 781.4892 | [M + Ag109]+ | <0.0001*** | >0.05 | <0.001*** | ↑ | <0.001*** | ↑ | <0.001*** | <0.01** | >0.05 | |
| CE (22:6)† | 803.4896 | [M + Ag107]+ | <0.0001*** | >0.05 | <0.01** | ↑ | <0.001*** | ↑ | <0.01** | <0.001*** | >0.05 | |
| CE (22:4) [Ag109] | 809.5205 | [M + Ag109]+ | 0.0010** | >0.05 | <0.05* | ↑ | <0.05* | ↑ | <0.05* | <0.05* | >0.05 | |
| CE (24:6) | 831.5209 | [M + Ag107]+ | 0.0004*** | >0.05 | >0.05 | <0.001*** | ↑ | >0.05 | <0.001*** | <0.05* | ||
| CE (24:4) | 835.5522 | [M + Ag107]+ | <0.0001*** | >0.05 | >0.05 | <0.001*** | ↑ | >0.05 | <0.001*** | <0.01** | ||
na = Below detection limits (0.1%) in most of the samples, not enough data to do statistics.
Structure confirmed my MS/MS.
2.4. Data processing & statistical analysis
To investigate changes in the injured area, regions of interest (ROI) delineating the injury were hand drawn for each lipid image using the free draw option of the ImageWerks software. The ROI sizes are reported in pixels, with a pixel corresponding to the raster step of the laser (50 μm) and an area of 2500 μm2. The ROIs for each lipid were initially determined as the region surrounding the center of the impact site that showed the greatest change in levels of the specific lipid in sections from animals subjected to CCI. The ROIs were similar for each lipid family but considerably different between lipid families (i.e., SMs showed a different post-injury distribution from CERs; see Results section). The average intensity/pixel of mass resolved lipid ions within each defined ROI was computed by integrating the total intensity within the ROI and dividing by the number of pixels. Resulting peak lists (m/z and intensities) were annotated using our lipid database. A maximum error of 5 parts-per-million (ppm) was used for the annotation. The ROI size and average intensities were compared between animal groups and time points. The intensity of all detected lipids in each sample/ROI were investigated by univariate analysis (two-way ANOVA and Bonferroni post-hoc tests) using GraphPad Prism (version 4.00 for Windows, GraphPad Software, San Diego California USA).
3. Results
3.1. Lipid assignments
MSI analysis was conducted in both positive and negative ion mode in the injured coronal level (bregma −2.04 mm). MS/MS was performed on every annotated lipid. Most MS/MS were conclusive for lipid structure assignments; results of structural analysis are shown in Table 2. In positive ion mode, 41 lipids were detected as [M + Ag]+ ions, except for cholesterol that was detected as [M + Ag3]+). Although several other peaks associated with sodium and potassium adducts were identified, they were not used in this study as the natural distributions of sodium and potassium in tissue can be different from the lipid specie of interest. Previous imaging studies in stroke have shown that sodium adducts of lipids are greatly increased due to the presence of blood leading to erroneous results in which a lipid species appears to increase in the injury, although the increase is due to the amount of sodium in the injured area (Wang et al., 2010, 2012). Because interfering signals were present in some cases for the [M + 107Ag]+ isotopic peak, the [M + 109Ag]+ peak was used for intensity extraction as the 107Ag and 109Ag isotopes have similar abundance (51.84% and 48.16%, respectively). Four lipids had interferences for both Ag isotopes and were not analyzed. As a result 37 identified lipids were imaged in positive ion mode, including 4 ceramides (CER), 9 diacylglycerols (DAG), 8 cholesteryl esters (CE), 13 galactosyl ceramides (GALCER), 2 phosphatidylcholines (PC) and cholesterol (CHL). Of the 13 identified GALCER positive ion species, 7 were hydroxylated. Fifty-six lipids were detected as [M − H]− ions in negative ion mode, except for sphingomyelins which were detected as [M − H CH2]−. All 56 detected lipids were imaged with no interferences, including 8 sphingomyelins (SM), 19 phosphatidylethanolamines (PE), 6 phosphatidylinositols (PI) and 23 sulfatides (ST). Of the 23 ST imaged, 11 were hydroxylated. The 93 lipids imaged in this study and are listed in Table 2.
3.2. Characterization of CCI injury by MSI of lipid species
The images for each lipid were compared across groups (control vs. injury for the different time points). Lipids from all classes (except GalCER and ST) show changes in the injury for at least one time point compared to controls. Some changes were intense enough to clearly discern the injured area from the rest of the brain. Hence, the ROIs were defined by pixels that differ significantly from the control concentrations of regional telencephalic distribution of the same species. Hence, regions of interest (ROI) were defined using the lipid distribution in the injured area for species that allowed a good delineation of the injury area in pixels. The ROIs were found to be very similar within lipid species (e.g. all DAG show the same distribution in the injury) but often differed between classes of lipid (e.g. SM have a different distribution than CER, Fig. 2A). DAG and SM showed similar distribution at 3 days (Fig. 2A), however ST and GALCER did not show any distinctive distribution within the injury making it difficult to define a ROI.
Fig. 2.

Size of the different ROIs defining the area of injury region for CER C18:0/d18:1 (m/z 674.45, red), CE 18:1 (m/z 757.51, pink), SM C16:0/d18:1 (m/z 687.54, green) and DAG 40a:6 (m/z 775.44, blue). (A) MSI at 3 days for the lipids that were used to define the injury ROI. (B) Graphs of the size of the injury ROI over time (Bonferroni post-test compared to controls injury size = 0, * p < 0.05, ** p < 0.01, *** p < 0.001). When no changes were observed at a specific time point, no ROI was defined as for CE 18:1, SM C16:0/d18:1 and DAG 40a:6 1 day after the injury. (For interpretation of the references to color in this figure legend, the reader is referred to the web version of this article.)
The average size in pixels (50 μm × 50 μm sampling intervals) of each of the injury ROI at the 3 different time points were compared to controls (injury size = 0) (Fig. 2B and Table 1). One day after the injury, the only lipid family to show a significant, focal increase in concentrations around the CCI site was CER, suggesting that increased CER is an early biomarker of intracranial tissue reaction to primary injury. At 3 days CER, CE, SM and DAG species show a significant injury size, suggesting that most of the lipid changes occur by day 3 post injury. At seven days post-injury, the injured area’s size decreased for CER, CE and SM, whereas DAG completely disappeared from the injured area. The average ion count of each lipid inside the ROI defining their distribution was also investigated to evaluate the intensity of the changes within the injured area at the different time points. Average intensity/pixel of mass resolved lipid ions correspond to the total intensity within the ROI and dividing by the number of pixels of the ROI. The ROI for each lipid family determined in sections from injured brains was overlaid on the sections from Sham rats, so that changes in intensity in injured animals could be compared to the intensities observed in the sham-injured brains. ROI were defined for CER, DAG, CE and SM, but as previously mentioned, some lipid classes did not show enough changes within the injury to visualize their distribution and define a ROI (GALCER and PC in positive ion mode, ST, PE and PI in negative ion mode).Another approach to visualizing spatial differences in lipid responses at the cortical impact site is shown in Figs. 3–6, which illustrate the size and location of samples with CER, CE, and DAG levels that exceeded the 99.5th percentile observed across samples from the sections of four sham control animals. The areas containing these high valued samples in the vicinity of the CCI site showed significant size differences for different lipid species on days 1, 3 and 7 (Fig. 3). CER C18:0/d18:1 was elevated over a relatively large area on day 1; the area of elevated levels did not change on day 3, but dropped significantly on day 7 (least significant differences test, p < 0.05). Areas with high levels of CE (18:1), DAG 40a:6 (18:0/22:6) and CER C16:0/d18:1 all showed a similar pattern: a significant increase on day 3, follow by a significant drop on day 7 (least significant differences tests, p < 0.05). PC 34:1 (18:1/16:0) showed a steady increase but the area was small.
Table 1.
Average size of the different ROIs defining the injury region for CER 674, DAG 775CE 757 & SM 687. Results of the ANOVA and Bonferroni post-test compared to controls injury size = 0. (AVG = average in pixel 50 μm × 50 μm).
| Name (Mode) | m/z | Lipid classes | ANOVA | Bonferroni’s multiple comparison test | |||||
|---|---|---|---|---|---|---|---|---|---|
| p-Value | AVG 1D | Sham vs 1D | AVG 3D | Sham vs 3D | AVG 7D | Sham vs 7D | |||
| CER 674 (+) | 674.4481 | CER/GALCER/PC | p < 0***.0001 | 2527 ± 782 | p < 0***.001 | 2596 ± 200 | p < 0***.001 | 1003 ± 253 | p < 0*.05 |
| DAG 775 (+) | 775.4430 | DAG | 0.0002*** | 0 | p > 0.05 | 1341 ± 679 | p < 0***.001 | 0 | p > 0.05 |
| CE 757 (+) | 757.5052 | CE/CHL | p < 0***.0001 | 0 | p > 0.05 | 2115 ± 288 | p < 0***.001 | 820 ± 615 | p < 0*.05 |
| SM 687 (−) | 687.5446 | SM/ST/PE/PI | 0.0019** | 0 | p > 0.05 | 1410 ± 632 | p < 0**.01 | 401 ± 158 | p > 0.05 |
AVG in pixel = 50 μm × 50 μm.
Fig. 3.

The area occupied by 50 μm samples that showed levels greater than the 99.5th percentile of sham control brains for five lipid species. The levels were measured at the total area under the MS peaks for each positive ion species (m/z 644.4171 CER C16:0/d18:1[M + Ag107]+, m/z 674.4481 CER C18:0/d18:1 [Ag109] [M + Ag109]+, m/z 775.4430 DAG 40a:6 (18:0/22:6) [M + Ag107]+, m/z 757.5052 CE (18:1) [M + Ag107]+, and m/z 866.4824 PC 34:1 (18:1/16:0) [M + Ag107]+ ), and the 99.5th percentile point was identified from more than 200,000 pooled sampling sites from sections from 4 sham control rats (anesthesia and craniotomy but no CCI). The spatial distributions of sites showing lipid concentrations greater than the respective 99.5th percentile cutoff at the CCI site are shown in Figs. 4–6. The number of 50 μm sites was divided by 400 to yield the area of high outlier levels this graph; error bars represent the standard error.
Fig. 6.

The distribution 50 μm samples that showed levels greater than the 99.5th percentile of sham control brains for four lipid species, seven days after CCI. The levels were measured at the total area under the MS peaks for each positive ion species (m/z 644.4171 CER C16:0/d18:1[M + Ag107]+, m/z 674.4481 CER C18:0/d18:1 [Ag109] [M + Ag109]+, m/z 775.4430 DAG 40a:6 (18:0/22:6) [M + Ag107]+, m/z 757.5052 CE (18:1) [M + Ag107]+, and m/z 866.4824 PC 34:1 (18:1/16:0) [M + Ag107]+). The data are displayed from a section through the CCI site in four rats. The upper row shows data for sample sites displaying high values of the CER C16 alone, CER C18 alone and both. The middle row shows data for sample sites displaying high values of the cholesteryl ester (CE) alone, CER C18 alone and both. The lower row shows the distributions for outlier levels of CE alone, outlier levels of the DAG species alone and both in the same sample.
The relative distribution of the areas showing high (>99.5th percentile of control) values of these lipids is compared for several positive ion species from each animal in Fig. 4 (day 1), 5 (day 3) and 7 (day 7). On day 1, the high levels of CER C18:0/d18:1 dominated the CCI site and 91% of the high CER C16:0/d18:1 sites also had high levels of CER C18:0/d108:1 (Fig. 4). The few sample sites with high levels of CE (18:1) and DAG 40a:6 (18:0/22:6) did not overlap appreciably with the former species. At 3 days after CCI, the spatial distribution of samples showing highly elevated values of CER C16:0/d18:1, CE (18:1) and DAG 40a:6 (18:0/22:6) increased dramatically, such that the four species showed extensive mutual overlap in single samples (Fig. 5). At 7 days after CCI, the reduced areas of elevated CER C18:0/d108:1, CER C16:0/d18:1 and CE (18:1) concentrations still showed extensive mutual overlap (Fig. 6), but there were virtually no sites of elevated DAG 40a:6 (18:0/22:6).
Fig. 4.

The distribution 50 μm samples that showed levels greater than the 99.5th percentile of sham control brains for four lipid species, one day after CCI. The levels were measured at the total area under the MS peaks for each positive ion species (m/z 644.4171 CER C16:0/d18:1[M + Ag107]+, m/z 674.4481 CER C18:0/d18:1 [Ag109] [M + Ag109]+, m/z 775.4430 DAG 40a:6 (18:0/22:6) [M + Ag107]+, m/z 757.5052 CE (18:1) [M + Ag107]+, and m/z 866.4824 PC 34:1 (18:1/16:0) [M + Ag107]+). The data are displayed from a section through the CCI site in four rats. The upper row shows data for sample sites displaying high values of the CER C16 alone, CER C18 alone and both. The middle row shows data for sample sites displaying high values of the cholesteryl ester (CE) alone, CER C18 alone and both. The lower row shows the distributions for outlier levels of CE alone, outlier levels of the DAG species alone and both in the same sample.
Fig. 5.

The distribution 50 μm samples that showed levels greater than the 99.5th percentile of sham control brains for four lipid species, three days after CCI. The levels were measured at the total area under the MS peaks for each positive ion species (m/z 644.4171 CER C16:0/d18:1[M + Ag107]+, m/z 674.4481 CER C18:0/d18:1 [Ag109] [M + Ag109]+, m/z 775.4430 DAG 40a:6 (18:0/22:6) [M + Ag107]+, m/z 757.5052 CE (18:1) [M + Ag107]+, and m/z 866.4824 PC 34:1 (18:1/16:0) [M + Ag107]+). The data are displayed from a section through the CCI site in four rats. The upper row shows data for sample sites displaying high values of the CER C16 alone, CER C18 alone and both. The middle row shows data for sample sites displaying high values of the cholesteryl ester (CE) alone, CER C18 alone and both. The lower row shows the distributions for outlier levels of CE alone, outlier levels of the DAG species alone and both in the same sample.
GALCER and ST did not show any change in the injured area, so no ROI could be drawn. GALCER are glycosphingolipids with a ceramide backbone, therefore the same ROI that was used for CER in positive ion mode was used for GALCER. ST are sulfated galacto-cerebrosides with a sphingosine backbone, therefore the same ROI that was used for SM in negative ion mode was used for ST. Glycerophospholipids PC, PE and PI exhibited minimal changes in the injury, they mostly decreased, making it difficult to define a ROI. In positive ion mode, the PC distribution was found to be identical to CER so the CER ROI was used for PC analysis. In negative ion mode, PE and PI distributions were identical to SM so the SM ROI was used for these lipids. Results for average ion count changes were grouped by lipid families (Table 2) including sphingolipids (CER, SM, GALCER & ST), glycerolipids/glycerophospholipids (PC, PI, PE & DAG), cholesterol and its derivatives (CE) and are discussed below.
3.3. Sphingolipids
ST and GALCER average intensities within the injury site did not show any significant change between control and CCI animals. However CER and SM exhibited important changes as seen in Fig. 7. The changes correlated to the fatty acid attached to the sphingoid base. Low mass SM and CER (≤C16) were localized exclusively in the ventricles in controls and in the injured area in CCI animals. Among low mass SM and CER, only SM & CER C16:0/d18:1 were detected. They are probably derived from blood in the injury and thus are located in the hematoma region (Fig. 7A). 3 CER and 4 SM of intermediate mass (from C18 to C20) were detected. They are localized in grey matter and show significant and opposite changes (increase in CER vs decrease in SM) in the injured area (Fig. 7B). Only 3 high mass SM (≥C22) were detected. They are localized in the ventricles and show no significant changes (data not shown) but a small increase in the injured area (which is an opposite trend compared to grey matter SM).
Fig. 7.
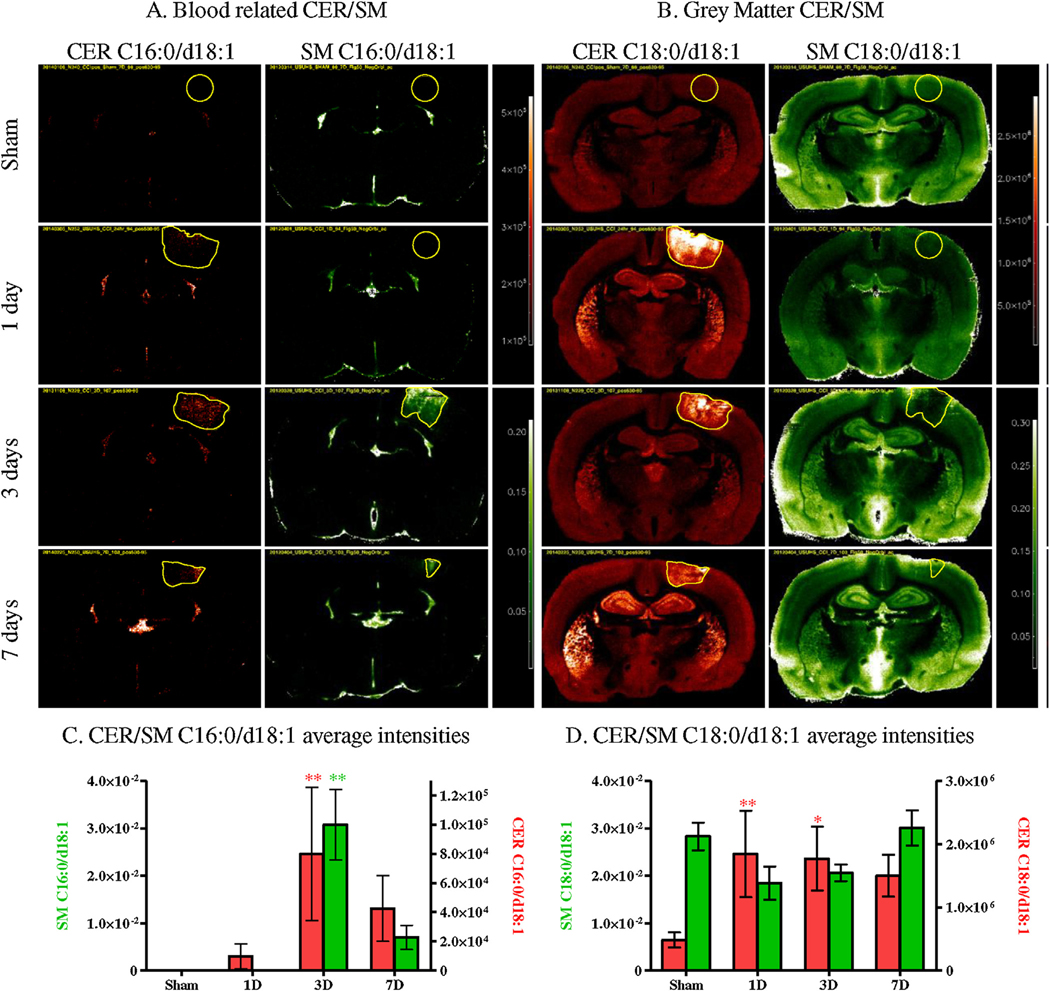
MSI of controls (Sham) and CCI brains (1 day, 3 days and 7 days) for blood related CER/SM C16:0/d18:1 (A) and grey matter CER/SM C18:0/d18:1 (B) (CER in red, SM in green). Average intensities within the injury ROI in controls (Sham) and CCI brains (1 day, 3 days and 7 days) for CER/SM C16:0/d18:1 (C) and CER/SM C18:0/d18:1 (D) (CER in red, SM in green) (Bonferroni post-test compared intensity in controls, * p < 0.05, ** p < 0.01, *** p < 0.001).
The intensities extracted from the CER and SM ROI, confirmed as low mass SM and CER C16:0/d18:1 (Fig. 7A), were increased in the region of the injured area. Both SM and CER showed a significant increase in intensity after 3 days (Fig. 7C) but no significant increase was observed for the other time-points, unlike for grey matter CER (Fig. 7B). Intermediate mass SM and CER (C18:0/d18:1 Fig. 7B) were localized in the grey matter of the brain. These SM and CER showed opposite changes within the injury. CER increased significantly as early as 24 h post trauma and remained elevated after 3 and 7 days although not significantly elevated at 7 days). In contrast, SM decreased in the injury after 1 and 3 days but this decrease was not significant (Fig. 7D). High mass SM (≥C22) localized in the ventricles showed no significant changes (data not shown). Since the injury was located in the cortex which is mainly grey matter, white matter species had a low intensity and exhibited a large variation within the injury’s ROI. Statistics are summarized in Table 2. In addition, alteration of the brain lipid content was not limited to the injury ROI, as some species changed in the rest of the brain. Grey matter CER increased in the caudate putamen, globus pallidus and the hippocampus (Fig. 7B), while grey matter SM showed an overall decrease in the rest of the brain at 1 day and an increase at 3 and 7 days.
3.4. Glycerolipids/glycerophospholipids
As previously mentioned, glycerophospholipids (PC/PE/PI) mostly decreased in the injured area. All of the detected species in these 3 classes were predominantly localized in grey matter (Fig. 8A and B). DAG, a class of glycerolipids, was not detected in control brain tissue (sham), but showed a marked increase in injured brains after 3 days (Fig. 8A). The average intensities extracted from the different ROI confirmed what was observed in the MS images in Fig. 8. DAG showed a significant increase 3 days after the injury as is shown in Fig. 8C. This increase did not persist beyond day 7. The same significant increase was observed for almost all 9 detected DAG (2/9 showed an increase but were not statistically significant, Table 2). In Fig. 8A, PE 40a:6 which generates DAG 40a:6, showed a significant decrease 3 days after the injury, but not at the other time points. Most of the detected PE exhibited the same trend (decrease at 3 days), but only a few were significant (3/19).
Fig. 8.
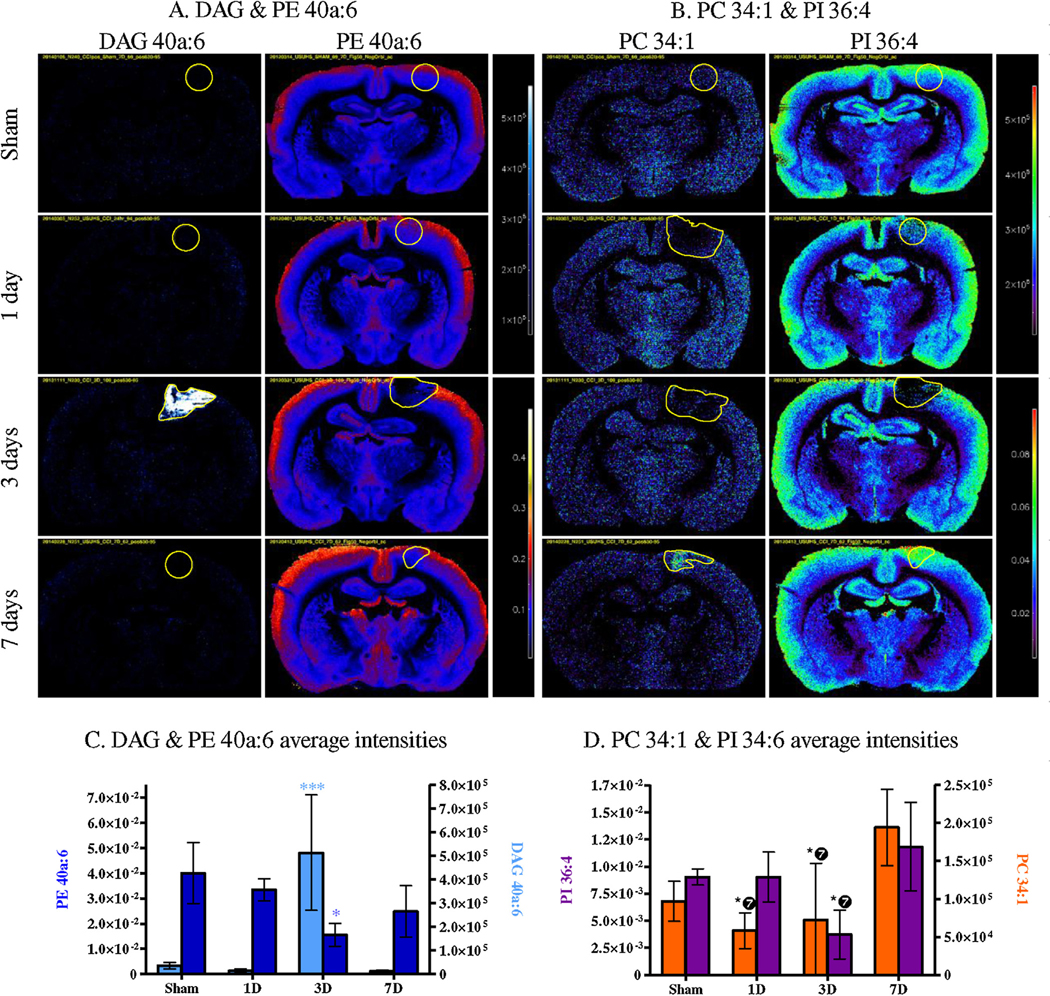
MSI of controls (Sham) and CCI brains (1 day, 3 days and 7 days) for DAG and PE 40a:6 (A), PC 34:1 and PI 36:4 (B) (DAG in blue/white, PE in red/blue, PC and PI in rainbow). Average intensities within the injury ROI in controls (Sham) and CCI brains (1 day, 3 days and 7 days) for DAG and PE 40a:6 (C), PC 34:1 and PI 36:4 (D) (DAG in light blue, PE in navy blue, PC in dark orange and PI in purple). (Bonferroni post-test compared intensity in controls, * p < 0.05, ** p < 0.01, *** p < 0.001, for PC and PI ❼ means the significance is compared to 7 days, not sham).
Interestingly two of the most important decreases were PE 38a:6 and PE 40a:6, both containing docosahexaenoic acid (DHA, FA 22:6) according to their MS/MS (16:0a/22:6 and 18:0/22:6 respectively; Table 1). For other glycerophospholipids classes (PI and PC), the 40a:6 diacyl backbone was not detected; PC34:1 (16:0/18:1) and PI 36:4 (16:0/20:4) are shown in Fig. 8B. Both PC and PI showed a decrease at 3 days and an increase at 7 days. These changes were not significant compared to controls, but the decrease at 3 days was significant compared to the increase at 7 days (Fig. 8D). In addition the PC showed a decrease at 1 day that was also significant compared to the increase at 7 days. Of the 2 PC and 6 PI detected, only PC34:1 and PI 36:4 exhibited significant changes even though a similar trend was observed for the other detected glycerophospholipids.
3.5. Cholesterol and derivatives
Cholesterol and cholesteryl esters (CE) showed the same distribution in the injury area. Cholesterol was detected in the whole brain, and showed a decrease in the injury region after 3 and 7 days (Fig. 9A). It also showed an increase in the rest of the brain after 3 days, more specifically in the corpus callosum, dentate gyrus & the internal capsule. CE were not detected in control brains but increased in the injured area, and their signals were intense at the same time points where cholesterol decreased (3 & 7 days). The average intensities extracted from the ROI confirmed the significant increase of CE in the injury at 3 and 7 days (Fig. 9B) but the cholesterol decrease observed was not significant.
Fig. 9.

MSI of controls (Sham) and CCI brains (1 day, 3 days and 7 days) for cholesterol and CE 22:6 (A) (CHL and CE in rainbow). Average intensities within the injury ROI in controls (Sham) and CCI brains (1 day, 3 days and 7 days) for cholesterol and CE 22:6 (CGL in light green, CE in light orange) (B). (Bonferroni post-test compared intensity in controls, * p < 0.05, ** p < 0.01, *** p < 0.001).
4. Discussion
Changes in lipid profile after CCI point to the magnitude of pathological changes and the biochemical pathways involved in both the secondary injury progression and mobilization of wound healing and repair mechanisms. At a molecular level, concussive brain injury is believed to produce neuronal injury and death by activating excitotoxic metabolic pathway, with one pathological process involving excessive stimulation of NMDA and AMPA receptors by the excitatory neurotransmitter glutamate (Olney, 1978, 1993) and release of excessive amount of dynorphin (Woods et al., 2006; Hauser et al., 2005). Excitotoxicity is not specific to TBI; it is common to many neurological disorders including stroke, epilepsy, and neurodegenerative diseases (Waggie et al., 1999; Meldrum and Garthwaite, 1990). Cellular and molecular events induced by brain injury have been divided into three phases that involve both sequentially and temporally overlapping responses in the brain: initial and subsequent injuries and “repair process” (Levine et al., 2006). An excellent review by Hunt et al. (2013) has detailed the cascades from these three phases and the potential molecular and cellular events involved and will not be reiterated here.
In this study, many lipid families showed changes over time at the site of CCI, including sphingolipids. Numerous papers and reviews have been published about the role of the SM/CER signaling pathway in cell death or apoptosis (Woodcock, 2006; Aureli et al., 2014; Taniguchi and Okazaki, 2014). Activation of this pathway occurs after cellular stress including ischemic brain injury and stroke (Altura et al., 2002; Yu et al., 2000; Novgorodov and Gudz, 2011). It results in the cleavage of membrane SM by activation of acidic and/or neutral sphingomyelinase (SMase) and generation of the second messenger ceramide. Our results suggest that the SM/CER signaling pathway is involved in TBI as we observed changes in both SM and CER. Both low mass SM and CER detected in this study (SM/CER C16:0/d18:1) showed a concomitant increase in the injured area. According to our MS images these low mass species SM & CER C16 are not normally present in the brain parenchyma but they are usually found in blood (Gorska et al., 2002; Ichi et al., 2007; Ionescu et al., 2013). Their increase in the injury between day 1 and day 3, accompanied by increased CE, could indicate changes in blood–brain barrier properties, inflammatory cell migration, or an increased local synthesis rate. Intermediate mass SM and CER (from C18 to C20), localized in the gray matter, showed opposite trends 3 days after the injury: a decrease in SM and an increase in CER. These changes may reflect the activation of SMase that hydrolyzes SM to produce CER. However, the early increase of CER at day 1 is not correlated with a decrease in the corresponding SM, as observed at days 3. This suggests that the CER synthesis (de novo or salvage pathway with CER synthase CerS) might be activated as early as day1 post TBI. Indeed, a variety of stressful stimuli are known to increase CER levels via activation of both SMase and CerS (Stiban et al., 2010; Merrill and Jones, 1990), especially CerS5 and CerS6 (Jin et al., 2008; Schull et al., 2015), which synthesize C14–C18 CER. This would also explain why CER are still increased in the injury after 7 days, while SM do not show any decrease because of no additional hydrolysis by SMase. Moreover the CER increase observed for intermediate mass SM and CER is not only localized in the injured area, but is also observed in other regions of the brain, suggesting the presence of diffuse axonal injury mediated most likely by activation of CerS or de novo synthesis since no corresponding SM decrease was observed in those regions. Finally, high mass SM (≥C22:0), localized in the ventricles/white matter, seem to be less affected by events at the CCI site as no significant changes were observed.
Glycerolipids, glycerophospholipids, cholesterol and its derivatives also showed changes over time after TBI. DAGs are important second messenger signaling lipids produced from the degradation of glycerophospholipids by phospholipase C (PLC). It has been shown that brain injury increases the activity of PLC (Wei et al., 1982; Dhillon et al., 1999), releasing lipid second messengers including DAG. Our results suggest that the increase of DAG in the injury is most likely linked to the decrease/degradation of glycerophospholipids, including PE and probably PC and PI by an increase in PLC activity. Glycerophospholipids are major constituents of neural cell membranes particularly long chain polyunsaturated fatty acids (PUFA) such as arachidonic acid (AA; 20:4 n − 6) and docosahexaenoic acid (DHA; 22:6 n − 3). DHA is the most important PUFA PE in mature brain and interestingly, in this study, all PE containing either AA or DHA showed a trend toward a decrease in the injured area after 3 days (38p:6, 38a:6, 38a:5, 40p:6, 40a:6, 40a:5). However, only the diacyl-PE containing DHA were significantly decreased (38a:6 & 40a:6). This result suggests membranes disruption. Cholesterol is another major component of the brain and neural cell membrane, 25% of the cholesterol in the body is found in the brain, where it plays important roles in membrane function. In this study a non-significant decrease of cholesterol was observed in the injury as well as a significant increase of CE which is produced by esterification of cholesterol. In tissues, including brain, the enzyme responsible for the esterification of free cholesterol is the acyl-coenzyme A cholesterol acyltransferase (ACAT). ACAT-mediated esterification of cholesterol limits the toxic accumulation of excess free cholesterol in cells (Tabas, 2002). ACAT1 expression was shown to increase after excitotoxic injury in the hippocampus, significantly increasing cholesteryl esters levels (Kim et al., 2011). The significant increase of CE observed at 3 and 7 days post injury could reflect similar local neurodegenerative events, possibly combined with vascular remodeling and secondary changes in blood–brain barrier permeability at the injury site.
Overall investigation of brain lipids at the site of CCI gives an insight into the extent of biochemical, functional and structural changes that may be detected by changes in lipid profiles. It is note-worthy that the spatial distributions of high levels of different CERs, CE, and DAG follow distinct time courses, suggesting that they are regulated independently by the local milieu (Figs. 3–6). The lipid classes exhibiting the most significant changes in gray matter were CER, DAG and CE. The CER species increased as early as 1 day post injury and were still elevated after 7 days, possibly reflecting their role as signaling substrates, precursors for downstream synthesis of sphingomyelins, and turnover of sphingomyelins, sphingosines, ceramide-1-phosphate and glucosylceramides. This behavior contrasts sharply with decreased regional brain CER concentrations after low level blast wave exposure (Woods et al., 2013), which, unlike CCI, produced no evidence of frank brain injury. Hence, we attribute the CER response in this study to the injury and repair of a contusion of neural and vascular tissues.
The delayed elevation of CE is significant because levels are very low in normal brain, but may be elevated in some neurodegenerative disorders (Dietschy and Turley, 2004). However, like the more prolonged increase in C18 CER, the observed spatially overlapping CE increase is likely to be associated with vascular remodeling and inflammatory reactions, as well as central nervous system neuronal and glial responses. The effect at both 3 and 7 days post injury seems to be consistent with a role in multiple wound healing and repair responses. The increase in DAG, on the other hand, appeared only at 3 days and was associated spatially with sample sites showing high levels of blood-related C16 CER and CE. Hence, it appears to be a more transient signal associated with tissue responses at a ‘core’ region of injury. Thus, the ability to analyze quantitatively the spatiotemporal distribution of these lipid species in tissue sections provide a new tool to investigate cellular processes of injury response and remodeling in neural, glial and vascular components of injured brain tissue.
HIGHLIGHTS.
MSI allows the in situ mapping of molecules directly from tissues.
Brain images showed changes in most lipids classes 3 days after TBI.
Signaling lipids such as increase in ceramides increased as early as 1 day after the injury.
More diffuse lipid changes are observed outside of the injured area.
Ceramides, diacylglycerols and cholesteryl esters are good biomarkers for TBI.
Acknowledgements
The authors declare no competing financial interests. This work was supported in part by a grant from the U.S. Department of Defense and the Center for Neuroscience and Regenerative Medicine (CNRM), Rockville, MD and by the Intramural Research Program of the National Institute on Drug Abuse, NIH. Ionwerks gratefully acknowledges support of this work through NIH SBIR Phase II grants R44DA030853–03 5R44DA036263–03”. The authors acknowledge Dr. Mari Prieto and Glen Gregory of the Thermo Fisher Corporation for technical and instrumentation advice. The authors also thank Gregory Bull for his technical support. The opinions and assertions contained herein are the personal opinions of the authors and are not to be construed as official or reflecting the views of the Uniformed Services University, the Department of Defense, NIDA or the NIH.
Abbreviations:
- TBI
traumatic brain injury
- MSI
mass spectrometry imaging
- AgNPs
silver nanoparticles
- CCI
controlled cortical impact
- ROI
regions of interest
- CER
ceramide
- DAG
diacylglycerol
- CE
cholesteryl ester
- GALCER
galactosyl ceramide
- PC
phosphatidylcholine
- CHL
cholesterol
- SM
sphingomyelin
- PE
phosphatidylethanolamine
- PI
phosphatidylinositol
- ST
sulfatide
References
- Adibhatla RM, Hatcher JF, Dempsey RJ. Lipids and lipidomics in brain injury and diseases. AAPS J 2006;8:E314–21. [DOI] [PMC free article] [PubMed] [Google Scholar]
- Agrawal A, Timothy J, Pandit L, Manju M. Post-traumatic epilepsy: an overview. Clin Neurol Neurosurg 2006;108:433–9. [DOI] [PubMed] [Google Scholar]
- Altura BM, Gebrewold A, Zheng T, Altura BT. Sphingomyelinase and ceramide analogs induce vasoconstriction and leukocyte-endothelial interactions in cerebral venules in the intact rat brain: insight into mechanisms and possible relation to brain injury and stroke. Brain Res Bull 2002;58:271–8. [DOI] [PubMed] [Google Scholar]
- Aureli M, Murdica V, Loberto N, Samarani M, Prinetti A, Bassi R, Sonnino S. Exploring the link between ceramide and ionizing radiation. Glycoconj J 2014;31: 449–59. [DOI] [PubMed] [Google Scholar]
- Colsch B, Woods AS. Localization and imaging of sialylated glycosphingolipids in brain tissue sections by MALDI mass spectrometry. Glycobiology 2010;20:661–7. [DOI] [PMC free article] [PubMed] [Google Scholar]
- Cutler RG, Kelly J, Storie K, Pedersen WA, Tammara A, Hatanpaa K, Troncoso JC, Mattson MP. Involvement of oxidative stress-induced abnormalities in ceramide and cholesterol metabolism in brain aging and Alzheimer’s disease. Proc Natl Acad Sci USA 2004;101:2070–5. [DOI] [PMC free article] [PubMed] [Google Scholar]
- Delvolve AM, Colsch B, Woods AS. Highlighting anatomical sub-structures in rat brain tissue using lipid imaging. Anal Methods 2011;3:1729–36. [DOI] [PMC free article] [PubMed] [Google Scholar]
- Dhillon HS, Carman HM, Prasad RM. Regional activities of phospholipase C after experimental brain injury in the rat. Neurochem Res 1999;24:751–5. [DOI] [PubMed] [Google Scholar]
- Dietschy JM, Turley SD. Thematic review series: brain lipids. Cholesterol metabolism in the central nervous system during early development and in the mature animal. J Lipid Res 2004;45:1375–97. [DOI] [PubMed] [Google Scholar]
- Faul M, Xu L, Wald MM, Coronado VG. Traumatic brain injury in the United States: emergency department visits, hospitalizations, and deaths. Atlanta (GA): Centers for Disease Control and Prevention. National Center for Injury Prevention and Control; 2010. [Google Scholar]
- Fernandez JA, Ochoa B, Fresnedo O, Giralt MT, Rodriguez-Puertas R. Matrix-assisted laser desorption ionization imaging mass spectrometry in lipidomics. Anal Bioanal Chem 2011;401:29–51. [DOI] [PubMed] [Google Scholar]
- Fernandis AZ, Wenk MR. Membrane lipids as signaling molecules. Curr Opin Lipidol 2007;18:121–8. [DOI] [PubMed] [Google Scholar]
- Gorska M, Dobrzyn A, Zendzian-Piotrowska M, Namiot Z. Concentration and composition of free ceramides in human plasma. Horm Metab Res 2002;34: 466–8. [DOI] [PubMed] [Google Scholar]
- Hardman JM, Manoukian A. Pathology of head trauma. Neuroimaging Clin N Am 2002;12:175–87, vii. [DOI] [PubMed] [Google Scholar]
- Hauser KF, Aldrich JV, Anderson KJ, Bakalkin G, Christie MJ, Hall ED, Knapp PE, Scheff SW, Singh IN, Vissel B, Woods AS, Yakovleva T, Shippenberg TS. Pathobiology of dynorphins in trauma and disease. Front Biosci 2005;10:216–35. [DOI] [PMC free article] [PubMed] [Google Scholar]
- Hunt RF, Boychuk JA, Smith BN. Neural circuit mechanisms of post-traumatic epilepsy. Front Cell Neurosci 2013;7:89. [DOI] [PMC free article] [PubMed] [Google Scholar]
- Ichi I, Nakahara K, Kiso K, Kojo S. Effect of dietary cholesterol and high fat on ceramide concentration in rat tissues. Nutrition 2007;23:570–4. [DOI] [PubMed] [Google Scholar]
- Ionescu N, de FC, Bueno AA. Perturbations in blood phosphatidylcholine and sphingomyelin Fatty Acid composition in a sample population of cigarette smokers. Indian J Clin Biochem 2013;28:361–7. [DOI] [PMC free article] [PubMed] [Google Scholar]
- Jackson SN, Baldwin K, Muller L, Womack VM, Schultz JA, Balaban C, Woods AS. Imaging of lipids in rat heart by MALDI-MS with silver nanoparticles. Anal Bioanal Chem 2014;406:1377–86. [DOI] [PMC free article] [PubMed] [Google Scholar]
- Jackson SN, Wang HY, Woods AS. Direct profiling of lipid distribution in brain tissue using MALDI-TOFMS. Anal Chem 2005;77:4523–7. [DOI] [PubMed] [Google Scholar]
- Jin J, Hou Q, Mullen TD, Zeidan YH, Bielawski J, Kraveka JM, Bielawska A, Obeid LM, Hannun YA, Hsu YT. Ceramide generated by sphingomyelin hydrolysis and the salvage pathway is involved in hypoxia/reoxygenation-induced Bax redistribution to mitochondria in NT-2 cells. J Biol Chem 2008;283:26509–17. [DOI] [PMC free article] [PubMed] [Google Scholar]
- Kim JH, Ee SM, Jittiwat J, Ong ES, Farooqui AA, Jenner AM, Ong WY. Increased expression of acyl-coenzyme A: cholesterol acyltransferase-1 and elevated cholesteryl esters in the hippocampus after excitotoxic injury. Neuroscience 2011;185:125–34. [DOI] [PubMed] [Google Scholar]
- Kushner D Mild traumatic brain injury: toward understanding manifestations and treatment. Arch Intern Med 1998;158:1617–24. [DOI] [PubMed] [Google Scholar]
- Levine B, Fujiwara E, O’Connor C, Richard N, Kovacevic N, Mandic M, Restagno A, Easdon C, Robertson IH, Graham SJ, Cheung G, Gao F, Schwartz ML, Black SE. In vivo characterization of traumatic brain injury neuropathology with structural and functional neuroimaging. J Neurotrauma 2006;23:1396–411. [DOI] [PMC free article] [PubMed] [Google Scholar]
- Marshall LF, Gautille T, Klauber MR, Eisenberg HM, Jane JA, Luerssen TG, Marmarou A, Foulkes MA. The outcome of severe closed head injury. Spec Suppl 1991;75:S28–36. [Google Scholar]
- Meldrum B, Garthwaite J. Excitatory amino acid neurotoxicity and neurodegenerative disease. Trends Pharmacol Sci 1990;11:379–87. [DOI] [PubMed] [Google Scholar]
- Merrill AH Jr, Jones DD. An update of the enzymology and regulation of sphingomyelin metabolism. Biochim Biophys Acta 1990;1044:1–12. [DOI] [PubMed] [Google Scholar]
- Muller L, Kailas A, Jackson SN, Roux A, Barbacci DC, Schultz JA, Balaban CD, Woods AS. Lipid imaging within the normal rat kidney using silver nanoparticles by matrix-assisted laser desorption/ionization mass spectrometry. Kidney Int 2015;88:186–92, 10.1038/ki.2015.3. [DOI] [PMC free article] [PubMed] [Google Scholar]
- National Institute of Neurological Disorders and Stroke. Traumatic brain injury: hope through research. Bethesda, MD: National Institutes of Health; 2002. [Google Scholar]
- Novgorodov SA, Gudz TI. Ceramide and mitochondria in ischemic brain injury. Int J Biochem Mol Biol 2011;2:347–61. [PMC free article] [PubMed] [Google Scholar]
- Olney JW. Neurotoxicity of excitatory amino acids In: McGeer E, Olney JW, McGeer P, editors. Kainic acid as a tool in neurobiology. New York, NY: Raven Press; 1978. p. 95–121. [Google Scholar]
- Olney JW. Role of excitotoxins in developmental neuropathology. APMIS Suppl 1993;40:103–12. [PubMed] [Google Scholar]
- Paxinos G, Watson C. The rat brain in stereotaxic coordinates. New York: Elsevier/Academic Press; 2007. [Google Scholar]
- Piomelli D The challenge of brain lipidomics. Prostaglandins Other Lipid Mediat 2005;77:23–34. [DOI] [PubMed] [Google Scholar]
- Piomelli D, Astarita G, Rapaka R. A neuroscientist’s guide to lipidomics. Nat Rev Neurosci 2007;8:743–54. [DOI] [PubMed] [Google Scholar]
- Rao V, Lyketsos C. Neuropsychiatric sequelae of traumatic brain injury. Psychosomatics 2000;41:95–103. [DOI] [PubMed] [Google Scholar]
- Romine J, Gao X, Chen J. Controlled cortical impact model for traumatic brain injury. J Vis Exp 2014:e51781, 10.3791/51781. [DOI] [PMC free article] [PubMed] [Google Scholar]
- Roux A, Muller L, Jackson SN, Baldwin K, Womack V, Pagiazitis JG, O’Rourke JR, Thanos PK, Balaban C, Schultz JA, Volkow ND, Woods AS. Chronic ethanol consumption profoundly alters regional brain ceramide and sphingomyelin content in rodents. ACS Chem Neurosci 2014;6:247–59. [DOI] [PMC free article] [PubMed] [Google Scholar]
- Schull S, Gunther SD, Brodesser S, Seeger JM, Tosetti B, Wiegmann K, Pongratz C, Diaz F, Witt A, Andree M, Brinkmann K, Kronke M, Wiesner RJ, Kashkar H. Cytochrome c oxidase deficiency accelerates mitochondrial apoptosis by activating ceramide synthase 6. Cell Death Dis 2015;6:e1691. [DOI] [PMC free article] [PubMed] [Google Scholar]
- Sharon R, Bar-Joseph I, Frosch MP, Walsh DM, Hamilton JA, Selkoe DJ. The formation of highly soluble oligomers of alpha-synuclein is regulated by fatty acids and enhanced in Parkinson’s disease. Neuron 2003;37:583–95. [DOI] [PubMed] [Google Scholar]
- Stiban J, Tidhar R, Futerman AH. Ceramide synthases: roles in cell physiology and signaling. Adv Exp Med Biol 2010;688:60–71. [DOI] [PubMed] [Google Scholar]
- Sturley SL, Patterson MC, Balch W, Liscum L. The pathophysiology and mechanisms of NP-C disease. Biochim Biophys Acta 2004;1685:83–7. [DOI] [PubMed] [Google Scholar]
- Tabas I Consequences of cellular cholesterol accumulation: basic concepts and physiological implications. J Clin Invest 2002;110:905–11. [DOI] [PMC free article] [PubMed] [Google Scholar]
- Taniguchi M, Okazaki T. The role of sphingomyelin and sphingomyelin synthases in cell death, proliferation and migration-from cell and animal models to human disorders. Biochim Biophys Acta 2014;1841:692–703. [DOI] [PubMed] [Google Scholar]
- Waggie KS, Kahle PJ, Tolwani RJ. Neurons and mechanisms of neuronal death in neurodegenerative diseases: a brief review. Lab Anim Sci 1999;49:358–62. [PubMed] [Google Scholar]
- Wang HY, Liu CB, Wu HW, Kuo JS. Direct profiling of phospholipids and lysophospholipids in rat brain sections after ischemic stroke. Rapid Commun Mass Spectrom 2010;24:2057–64. [DOI] [PubMed] [Google Scholar]
- Wang HY, Wu HW, Tsai PJ, Liu CB. MALDI-mass spectrometry imaging of desalted rat brain sections reveals ischemia-mediated changes of lipids. Anal Bioanal Chem 2012;404:113–24. [DOI] [PubMed] [Google Scholar]
- Wei EP, Lamb RG, Kontos HA. Increased phospholipase C activity after experimental brain injury. J Neurosurg 1982;56:695–8. [DOI] [PubMed] [Google Scholar]
- Wenk MR. The emerging field of lipidomics. Nat Rev Drug Discovery 2005;4:594–610. [DOI] [PubMed] [Google Scholar]
- Wenk MR. Lipidomics: new tools and applications. Cell 2010;143:888–95. [DOI] [PubMed] [Google Scholar]
- Woodcock J. Sphingosine and ceramide signalling in apoptosis. IUBMB Life 2006;58:462–6. [DOI] [PubMed] [Google Scholar]
- Woods AS, Colsch B, Jackson SN, Post J, Baldwin K, Roux A, Hoffer B, Cox BM, Hoffer M, Rubovitch V, Pick CG, Schultz JA, Balaban C. Gangliosides and ceramides change in a mouse model of blast induced traumatic brain injury. ACS Chem Neurosci 2013;4:594–600. [DOI] [PMC free article] [PubMed] [Google Scholar]
- Woods AS, Jackson SN. Brain tissue lipidomics: direct probing using matrix-assisted laser desorption/ionization mass spectrometry. AAPS J 2006;8:E391–5. [DOI] [PMC free article] [PubMed] [Google Scholar]
- Woods AS, Kaminski R, Oz M, Wang Y, Hauser K, Goody R, Wang HY, Jackson SN, Zeitz P, Zeitz KP, Zolkowska D, Schepers R, Nold M, Danielson J, Graslund A, Vukojevic V, Bakalkin G, Basbaum A, Shippenberg T. Decoy peptides that bind dynorphin noncovalently prevent NMDA receptor-mediated neurotoxicity. J Proteome Res 2006;5:1017–23. [DOI] [PMC free article] [PubMed] [Google Scholar]
- Yu Z, Nikolova-Karakashian M, Zhou D, Cheng G, Schuchman E, Mattson M. Pivotal role for acidic sphingomyelinase in cerebral ischemia-induced ceramide and cytokine production, and neuronal apoptosis. J Mol Neurosci 2000;15:85–97. [DOI] [PubMed] [Google Scholar]