

Abstract
We present design, implementation, and characterization of a single photon detector based on 32-channel PMT sensor [model H7260-20, Hamamatsu]. The developed high speed electronics enables the photon counting with linear dynamic range (LDR) up to 108count/s per detector's channel. The experimental characterization and Monte-Carlo simulations showed that in the single photon counting mode the LDR of the PMT sensor is limited by (i) “photon” pulse width (current pulse) of 900ps and (ii) substantial decrease of amplitudes of current pulses for count rates exceeding 108 count/s. The multi-channel architecture of the detector and the developed firm/software allow further expansion of the dynamic range of the device by 32-fold by using appropriate beam shaping. The developed single photon counting detector was tested for the detection of fluorescence labeled microbeads in capillary flow.
Keywords: photomultipliers, single photon counting, fluorescence detection
I. Introduction
Single photon detection is one of the most accurate and sensitive method for detection of weak electromagnetic radiation in the spectral range from the UV through IR. Over the years single photon detection had become one of the primary methods of analysis in biochemistry, biophysics and many life sciences applications including multicolor detection of extremely small amounts of material (chemical and biological) all the way down to single molecules. [1]. On the other hand, single photon detection is very useful for multicolor detection of micro-objects which are relatively bright, but are observed for very short, randomly distributed time intervals (e.g. in flow cytometry and microfluidic measurements objects are observed only once during microseconds). The advantage of the single photon detection in such measurements is that the detected objects produce a very limited number of photons during the detection interval. Therefore, single photon detectors, which do not add any noise to the statistical noise of the photon flux, provide the most accurate and sensitive detection of an object. In all above cases, the linear dynamic range (LDR) of the photon detector is crucial for accurate detection and color recognition.
A number of strategies exist for extending the LDR of single photon detectors: utilization of neutral filters, combining several photo-sensors into one detection unit and applying fiber-optic beam splitters to sample different fractions of the incident light beam, expansion of the LDR of the photon detector by post-processing of the detected signal [2], and combination of photon counting at low-light levels with analog to digital conversion at higher illumination levels [3], [4].
In the current article we present the design and characterization of a 32-channel single photon detector with very broad LDR and its application for the detection of fluorescence labeled microbeads in capillary flow.
We selected one of the best commercial multi-channel single photon sensors - the 32-channel Hamamatsu PMT [model H7260-20]. This sensor provides very high internal gain (~2-3×10⁶), good sensitivity in fluorescence detection range (almost steady response in 500-700nm range) and generates very short current pulses in response to incident single photons (FWHM below 1ns).
The conducted experimental studies and the computer simulations of the developed single photon detector show that the obtained LDR of the detector is the maximum which can be obtained with the selected 32-channel PMT sensor. The limitations to the LDR are caused by two major factors (1) finite (~900ps) width of the “photon” pulses generated by the PMT in response to single photons, and the substantial decrease of the PMT gain for count rates exceeding 108count/s.
II. Design and implementation of the PCB
A. Architecture of the single photon detector
The device consists of a 32-channel linear array PMT (Hamamatsu series H7260-20) connected to the PCB that comprises fast 32-channel pulse amplifier, a high speed FPGA counter, and several USB and LPT outputs [5].
B. PCB overview
The major limitation on the maximum LDR of the device is the width of pulses in the system. Therefore, the selected PCB components had to introduce as little broadening of the original PMT pulses as possible.
The magnitude of the current pulses produced by the PMT in response to single photons is determined by the internal gain of the sensor. The highest available PMT gain (~3×10⁶) corresponds to the voltage pulses of ~20mV average amplitude on 50Ω load. Pulses of that magnitude cannot be directly applied to the digital circuit components (comparators) and have to be pre-amplified.
In order to be able to process the pulses coming from all 32 channels of the detector, we built a PCB that comprised a connector for PMT output pins, 32 identical electrically-separated amplification circuits for each of the PMT's channels and a Xilinx Virtex-5 FPGA chip to count the pulses of all 32 channels and communicate with Cypress CY7C68013A USB-controller IC, that communicated with a PC via either USB or LPT protocols.
The PCB also had EMCO CA10N-5 high-voltage supply, to provide 800V bias to the PMT, connectors for external display unit and controls buttons, 4 USB and 1 LPT output ports. The PMT is mounted onto the central part of the board. Amplification circuits and comparators are situated as close to the PMT outputs as possible in order to prevent signal distortion. All analog parts are physically separated from digital ones, to reduce crosstalk.
C. Amplification circuit
The PMT produces current pulses with statistically distributed variations in the pulse amplitudes. This fact along with a finite tolerance of comparators’ thresholds leads to the necessity of a pre-amplification of the pulses into the range of single volts.
The schematic of the one channel amplifier/comparator circuit is shown in Fig. 1. In the circuit, the negative low-level PMT current pulses are amplified and inverted in the amplifier unit. The resulting positive voltage pulse goes straight to the comparator, whose reference voltage needs to be set in a range from 1.2V (middle point of the amplifier) up to the amplified pulse height. Our experiments with 1- 2- and 3-stage amplifiers based on a single, high bandwidth amplifier (BGA 427) and a fast comparator IC (LMH7220) showed that 20dB amplification obtained from the 1-stage amplifier was sufficient for a very reliable, loss free detection of the PMT pulses.
Fig. 1.

Schematic of the amplifier/comparator circuit.
Fig. 2 presents the comparator output pulses (bottom panels) versus the input pulses (top panels, obtained after the amplifier) for different light intensities.
Fig. 2.

One stage amplifier and comparator pulses for different light attenuations. From left to right: dark counts, −2OD, −1OD, −0.3OD.
Throughout the article the “OD” (optical density) notation refers to the attenuation of the incident light by neural filters and is defined as the logarithm (base 10) of the attenuation ratio of the filter (e.g. −1OD means 10-fold attenuation of the intensity of the incident illumination). We set the light intensity in such a way that −1OD illumination level produced 108 counts per second in the detector. For 532nm wavelength and 18% quantum efficiency of the PMT, −1OD illumination corresponds to ~7pW of optical power delivered to the photocathodes of the sensor.
As can be seen, the amplitude of the amplified pulses (top panel) decreases by more than 2 fold when the illumination intensity increases up to −0.3OD. The shape of the comparator pulses (bottom panel) and the average pulse width (2.5ns) do not depend on the amplitude of the amplified pulses for all light intensities.
D. Photon counting circuit
As a pulse counter we used a fast Xilinx FPGA chip (Virtex-5 series). One of the key criteria in favor of the particular type of the FPGA was its 1.6GHz that was sufficient for registration of the 2.5ns pulses produced by the comparators. We utilized LVDS inputs of the FPGA (thus the choice of LVDS comparators), because of the high speed and low interference required when transmitting single nanoseconds pulses.
III. Characterization of the 32-channel single photon sensor
A. Measurement Setup
A block diagram of the measurement setup is presented in the Fig.3.
Fig. 3.

Block diagram of the measurement setup.
Individual channels of the PMT were illuminated through the output fiber of the fiberized monochromator (Optometrics Group MLM-2). The output power of the monochromator was controlled using neutral filters. A special fixture was designed and used to focus the illumination from the output of the monochromator onto individual PMT channels.
Output signals obtained either directly from the output pins of the 32-channel PMT or from the pins of the 32-channel amplifier were connected to the oscilloscope (Tektronix TDS7404).
B. Single photon pulses
Fig. 4 shows pulse traces measured for different illumination levels directly from the PMT pins using the accumulation mode of the oscilloscope. The graphs in the left part of each screenshot represent distributions of the pulse heights.
Fig. 4.

PMT pulses in the range from darkness to very high light (from left to right: dark current pulses, light attenuation: −6OD, −5OD, −4OD, −3OD, −2OD, −1OD, 0 OD).
For low light levels (below −4OD) we observed variations of the height of the PMT pulses from ~5mV up to 70mV with average pulse height of about 20mV and FWHM of ~900ps.
For illumination levels above −1OD, the amplitude of the pulses dropped dramatically, so that the pulses almost merged with the noise floor. Further increase of the illumination intensity brought the PMT into a highly non-linear mode. This happened because the current between the PMT's dynodes became comparable to the current in the voltage divider that distributes the high bias voltage between the dynodes.
Judging by the shape of the pulses, it is reasonable to assume that up to −1OD PMT can work in the linear single photon counting mode, provided that analog and digital parts of the photon counting circuit are sufficiently fast (have bandwidths larger than 1GHz).
IV. Characterization of the detector
A. Photon counting threshold
Selecting a proper threshold for the comparators is critical for the performance of the entire detector. Fig. 5 presents the dark counts for one channel of the PMT versus the comparator threshold voltage.
Fig. 5.

Dark count versus comparator threshold voltage.
As can be seen, if the threshold is too high (above 1.5V) it reduces the sensitivity of the device because of a substantial loss of smaller pulses. On the other hand, if the threshold is too low (below 1.45V) the device registers a lot of dark counts at the noise floor. Thus, it's very important to determine a well-balanced threshold for each individual PMT channel. In order to perform individual adjustments of the comparator thresholds we implemented 32 potentiometers on the PCB, each one corresponding to one of the channels outputs. That allowed us to perform precise adjustments of the thresholds in individual channels of the detector.
It can easily be seen, that the count values for threshold above 1.45V follow the height distribution of the dark pulses (as it is shown in Fig.4).
B. Channel crosstalk
There are two sources of the channel crosstalk in the 32-channel PMT:
– Crosstalk which arises from interaction between channels inside of the PMT,
– Electronic crosstalk between PCB channels,
In order to characterize the crosstalk of the detector, we illuminated individual channels of the PMT with a solid state laser (532nm emission wavelength) so that the illuminated PMT area was small enough to reduce exposure of the neighboring channels. Fig. 6 presents photon counts in the illuminated channel (channel #24, black line) and two neighboring channels (#23 and #25, dashed lines).
Fig. 6.

Crosstalk of neighboring channels.
As can be seen, the behavior of the photon counts in the illuminated channel and the neighboring channels is similar. The magnitude of the crosstalk stays within 5% of the main channel which is what we expected from this type of PMT, having ~3-5% combined internal cross talk.
C. Linearity Dynamic Range
We have performed extensive measurements of the linearity of all 32 channels of the detector using the setup presented in Fig.3. The light-count characteristics obtained at 550nm wavelength from 32 channels of the detector are presented in Fig.7.
Fig. 7.

Photon count versus illumination for 32 channels of the PMT. The comparator response time is 2.5ns. Circled and squared curves present results of the Monte-Carlo simulation for 1ns and 2.5ns comparator pulses correspondingly. Dashed curve is the ideal linear response.
We showed that almost perfect linearity was achieved for photon count rate up to 60-70 million counts per second. The absolute maximum number of counts that the detector could register was about 200-250MHz. This count rate is in a good agreement with the maximum count rate obtained from the Monte-Carlo simulation for the counting of 2.5ns “photon” pulses.
D. Monte-Carlo simulation of single photon counting
We have developed a simple model to simulate the counting of single photons, taking into account a finite pulse width. Our measurements of the time intervals between arrivals of consecutive photons for different levels of CW illumination showed that the probability of that the photon does not arrive during time interval t and arrives during t + dt is given by the following expression:
| (1) |
where 1/τ is average rate of the photons’ arrival (or τ is average time interval between arrivals of the consecutive photons). In the simulation of the photon counting we assumed that the loss of counts is only caused by the detection of photons separated by the time intervals shorter than the width of the comparator pulses (2.5ns). Fig.8 presents distributions of the photons’ arrival times simulated with Monte-Carlo technique for different photocount rates according to equation (1).
Fig. 8.

Simulated distributions of photon arrival times for photocount rates from 2×10⁵/s through 2×10⁹/s.
As can be seen, for photocount rates higher than 2×10⁸/s, there is a large fraction of photons whose arrivals are separated by time intervals shorter than 2.5ns. It means that the comparators producing 2.5ns pulses do not register a significant fraction of pulses at these rates.
The curve with square-shaped data points in the Fig. 7 presents the simulation results for 2.5ns comparator pulses. It can be seen that the simulated results match the experimental count/light characteristics very accurately up to −1OD light attenuation. On the other hand, for higher light levels the experimental loss of photo-counts exceeds the loss simulated with 2.5ns comparator delay time. This observation can be explained by a significant reduction of the amplitude of the PMT pulses at the illumination intensity higher than −1OD (see Fig. 2 and Fig.4).
Fig.9 presents light/count characteristics measured for a single PMT channel that was connected to a p.e.c.l. comparator with 2ns pulses for three comparator's threshold voltages Vth.
Fig. 9.

Light/Count characteristics measured for three comparator thresholds Vth. Dashed line presents simulated incident (true) photon count, and white circles are Monte-Carlo simulated photon count as detected by comparator.
As can be seen, the increase of the comparator threshold from Vth=1300mV to Vth=1400mv has a minimum impact on the detected photon counts for the illumination levels below −1OD. However, for higher illumination levels, a significant count loss is observed (which increases with the increase of the Vth). Comparison of the simulated and the measured curves shows that for Vth=1300mV almost the entire loss of counts can be attributed to the 2ns width of the comparator pulses. For Vth=1350mV a significant loss of counts occurring at the illumination level above −0.3OD is caused by the diminishing of the amplitude of the PMT pulses. Similar behavior is observed for Vth=1400mV, but the loss of low level “photon” pulses occurs already at −1OD illumination.
E. Noise of the detector
Photon noise, also known as Poisson noise, is inherent to the quantized nature of light and the independence of photon detections, when individual photon detections can be treated as independent events that follow a random temporal distribution. Thus, in a correctly operating single photon detector we observe Poisson distribution of the photo-counts for which the variance of the photo-count rate is equal to its mean value, setting the lower boundary for the signal-to-noise ratio of the photon detector.
In order to determine the distribution of photo-counts in our detector, we collected the photo-counts during 25ms intervals at different illumination levels and performed 30 min recordings using our data recording software. Fig. 10 presents photon count rate, mean photon count accumulated during 25ms time intervals and the photo-count variance.
Fig. 10.

Photo-count rate, mean photon count accumulated during 25ms and its variance.
For illumination levels below −1OD (photon counting rate below 108/s) the mean photon count and its variance are almost equal. The good match between the mean values and the variances indicates that for the photon counting rates below 108/s the measured photon counts follow Poisson statistics and that the detector itself does not produce additional noise. For higher illumination levels one can see the departure from Poisson distribution.
The conducted Monte-Carlo simulations showed that when the photon detection rate exceeded 108/s there was a loss of photo-counts for consecutive photons separated by the time intervals which are shorter than the comparator's response time (2.5ns). As a result, the distribution of the detected photons becomes non-Poissonian. Another source for non-Poissonian distribution of photon counts is that at high illumination levels the amplitudes of “photon” pulses in the PMT decrease dramatically (see Fig. 4). The decrease of the pulse amplitudes is caused by an insufficient recovery of the PMT gain during short time intervals between arrivals of consecutive photons. Obviously, both described processes introduce correlations between detection of consecutive photons (which leads to non-Poissonian distribution of the photon count, and increases the photon counting noise).
V. Detection of color-labeled microbeads
There exist a number of different approaches for optical “bar-coding” of micro objects (beads, cells, etc.) with fluorescent dyes and nano-particles [6][7][8]. Since each micro object may carry a whole variety of biological samples the ability to perform fast and reliable determination of color “signature” of the micro-object has wide variety of applications in life sciences, and medicine. Obviously, broad LDR of the detector is a key to a very accurate detection of the multi-color fluorescent objects. For example, in flow system like flow-cytometers, which are widely used in bio-medical applications, detection of objects may be done at a very high rate (up to 105 objects per second). Therefore, detection time for individual object is smaller than 10−5 s. The duration of the object detection time limits the number of photons that can be collected from the object in linear regime. For linearity range of 108 photo-counts per second, maximum 1000 photons can be obtained from the object during the 10−5 s measurement time. Increasing total number of counts obtained from the object leads to better signal-to-noise ratio of the detection.
Using the developed single photon detector we have performed measurements of polystyrene beads colored with types of quantum dots (CrystalPlex, Pittsburgh, PA). The measurement setup for detection of the beads in the capillary flow is described in [9]. The detector was mounted at the output of the spectrometer bench as described in [5].
Fig. 11 presents spectra of three types of quantum dots measured using the developed 32-channel single photon detector.
Fig. 11.
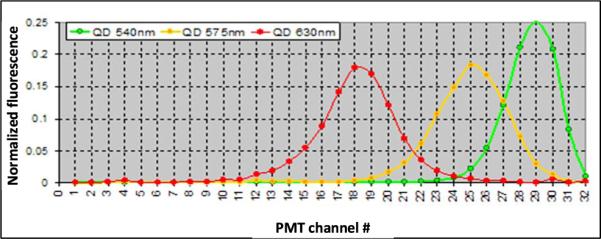
Fluorescence of three types of quantum dots.
These quantum dots were used for coloring of porous polystyrene beads so that the individual beads contained various compositions of the three quantum dot types (bead coloring was performed by CrystalPlex).
Fig.12 depicts fluorescence of 250 individual beads measured in the capillary flow, and Fig.13 presents a 3-dimentional bead map for 1500 distinguishable color codes for color-encoded beads (color codes were determined using technique described in [5]).
Fig. 12.

Fluorescence detected from 250 individual beads colored with three quantum dot types.
Fig. 13.

3D bead map of color codes of 1500 beads encoded with three types of quantum dots.
VI. Conclusion
A multichannel PMT-based single photon counting detector with LDR of 108count/s per channel has been demonstrated. Theoretical model of single photon counting has been developed. Comparison of computer simulated photon counting with experimental results showed that for the illumination level corresponding to the count of 108/s (~70pW at 532nm), the loss of counts in the system only occurs due to the width of the 2.5ns comparator pulses (2.5ns). Computer simulations performed for 1ns comparator pulses showed that the maximum detected photo-count rate may reach 400MHz.
The obtained experimental data and theoretical analysis of the detector's performance indicate that the linearity range of 108 count/s per channel is close to the physical limit of the 32-channel PMT, which is determined by (i) 900ps width of single photon pulses and (ii) dramatic decrease of the amplitude of single photon pulses at true count rates higher than 108/s. It is important to emphasize, that the multi-channel architecture of the single photon detector in combination with programming capabilities provided by the FPGA photon counter incorporated into the device, allows for a further expansion of the dynamic range by another order of magnitude with the help of the appropriate beam shaping and by combining photon counts obtained from multiple channels.
Another application option that can also be easily implemented in the presented photon detector is a photon number analysis for repetitive pulsed measurements as it was discussed in [3]. In this case, the availability of the 32 channels each having individual photon counting threshold, will allow a very accurate statistical analysis of the number of photons in the detected photon pulses.
Acknowledgements
These studies were supported by a grant from NIH (Award #R42-CA 140109). Vera Gorfinkel's spouse has an equity interest in ABMM, Inc., a company that may potentially benefit from the research results. The terms of this arrangement have been reviewed and approved by the Stony Brook University in accordance with its conflict of interest policies.
Biography
Dmytro Gudkov received his Ph.D and M.S. degrees in electrical engineering from the State University of New York, Stony Brook in 2011 and 2013 respectively. In 2006-2013, he has been working as a Research Assistant at the Fluorescence Detection Laboratory at the State University of New York, Stony Brook. Currently, he is a Research Scientist at ABMM Inc., Stony Brook, NY. His current research interests include development of single photon and fluorescence detection systems and design and development of photomultiplier sensors.
 George Gudkov (received the M.S. degree in radio engineering from the Department of Radio Engineering, Kharkov Institute of Radio Electronics, Ukraine, in 1968. From 1979 to 2000, he worked as Leading Engineer, Senior Engineer, and Project Director at the R&D Institute “PROTON,” Kharkov, Ukraine. From 2000 through 2010, he has been working with the Fluorescence Detection Laboratory at the State University of New York, Stony Brook. His research interests included designing high frequency analog/mixed-signal circuits.
Boris Gorbovitski received the Ph.D. degree in physics of semiconductors from A. F. Ioffe Institute, St. Petersburg, Russia, in 1984. Currently, he is a President of ABMM Inc., Stony Brook, NY. His current research interests include semiconductor and optoelectronic devices, single photon detection systems, and development of instrumentation for life sciences.
Vera Gorfinkel received the Ph.D. degree in physics of semiconductors from A.F. Ioffe Institute, St. Petersburg, Russia, in 1981. Currently, she is an Associate Professor in the Department of Electrical and Computer Engineering, State University of New York, Stony Brook. Her current research interests include semiconductor and optoelectronic devices, single photon detection systems, and development of instrumentation for life sciences.
REFERENCES
- 1.Chunnilall CJ, Degiovanni IP, Kück S, Müller I, Sinclair AG. Optical Engineering. 2014 Aug;53(8):081910. [Google Scholar]
- 2.Gavrilov D, Gorbovitski B, Gouzman M, Gudkov G, Stepoukhovitch A, Ruskovoloshin V, Tsupryk A, Tyshko G, Bilenko O, Kosobokova O, Luryi S, Gorfinkel V. Electrophoresis. Volume 24. 2003:1184–1192. doi: 10.1002/elps.200390152. [DOI] [PubMed] [Google Scholar]
- 3.Kissick DJ, Muir RD, Simpson GJ. Anal. Chem. 2010;82:10129–10134. doi: 10.1021/ac102219c. [DOI] [PMC free article] [PubMed] [Google Scholar]
- 4.Gavrilov D, Gorbovitski B, Gudkov G, Stepukhovich A, Tcherevishnik M, Tyshko G, Tsupryk A, Gorfinkel V. Proc.of SPIE. Vol. 6372. Boston, Massachusetts, USA: Oct 1-4, 2006. p. 63720C. [Google Scholar]
- 5.Tsupryk A, Tovkach I, Gavrilov D, Kosobokova O, Gudkov G, Tyshko G, Gorbovitski B, Gorfinkel V. Biosensors and Bioelectronics. 2008;23:1512–1518. doi: 10.1016/j.bios.2008.01.015. [DOI] [PubMed] [Google Scholar]
- 6.MacTaylor CE, Ewing AG. Electrophoresis. 1997;18(12-13):2279–2290. doi: 10.1002/elps.1150181218. [DOI] [PubMed] [Google Scholar]
- 7.Braeckmans K, de Smedt S, Roelant C, Leblans M, Pauwels R, Demeester J. Nature Materials. 2003;2:169–193. doi: 10.1038/nmat828. [DOI] [PubMed] [Google Scholar]
- 8.Doering WE, Nie S. Analytical Chemistry. 2003;75:6171–6176. doi: 10.1021/ac034672u. [DOI] [PubMed] [Google Scholar]
- 9.Gudkov D, Gavrilov D, Tsupryk A, Tovkach I, Gudkov G, Kosobokova O, Cherevishnik M, Gorbovitski B, Gorfinkel V. Biosensors and Bioelectronics. 2013;39:152–155. doi: 10.1016/j.bios.2012.07.013. [DOI] [PubMed] [Google Scholar]