

Abstract
Both subjective and objectively measured social status has been associated with multiple health outcomes, including weight status, but the mechanism for this relationship remains unclear. Experimental studies may help identify the causal mechanisms underlying low social standing as a pathway for obesity. Our objective was to investigate the effects of experimentally manipulated social status on ad libitum acute dietary intakes and stress-related outcomes as potential mechanisms relating social status and weight. This was a pilot feasibility, randomized, crossover study in Hispanic young adults (n=9; age 19–25; 67% female; BMI ≥18.5 and ≤30 kg/m2). At visit 1, participants consumed a standardized breakfast and were randomized to a high social status position (HIGH) or low social status position (LOW) in a rigged game of Monopoly™. The rules for the game differed substantially in terms of degree of ‘privilege’ depending on randomization to HIGH or LOW. Following Monopoly™, participants were given an ad libitum buffet meal and energy intakes (kcal) were estimated by pre- and post-weighing foods consumed. Stress-related markers were measured at baseline, after the game of Monopoly™, and after lunch. Visit 2 used the same standardized protocol; however, participants were exposed to the opposite social status condition. When compared to HIGH, participants in LOW consumed 130 more calories (p=0.07) and a significantly higher proportion of their daily calorie needs in the ad libitum buffet meal (39% in LOW versus 31% in HIGH; p=0.04). In LOW, participants reported decreased feelings of pride and powerfulness following Monopoly™ (p=0.05) and after their lunch meal (p=0.08). Relative to HIGH, participants in LOW demonstrated higher heart rates following Monopoly™ (p=0.06), but this relationship was not significant once lunch was consumed (p=0.31). Our pilot data suggest a possible causal relationship between experimentally manipulated low social status and increased acute energy intakes in Hispanic young adults, potentially influenced by decreased feelings of pride and powerfulness. Increased energy intake over time, resulting in positive energy balance, could contribute to increased risk for obesity, which could partially explain the observed relationship between low social standing and higher weight. Larger and longitudinal studies in a diverse sample need to be conducted to confirm findings, increase generalizability, and assess whether this relationship persists over time.
Keywords: Subjective social status, Hispanic Americans, young adult, obesity, diet, socioeconomic factors
1. Introduction
The prevalence of obesity in the United States (U.S.) has increased substantially over the last four decades1. In 2012, more than one-third of adults and 17% of youth in the U.S. were obese1. Obesity is overrepresented among Hispanic Americans, with Hispanic persons exhibiting higher obesity rates (22.6%) than non-Hispanic Blacks (22.1%), Whites (19.6%), and Asians (11.1%)1. Our previous work2 observed that Hispanic families have lower socioeconomic status (SES) – an objectively measured assessment of social standing reflecting reduced wealth, occupational prestige, and education – relative to Whites, with 23.6% of Hispanic families falling below the poverty line in 20143. Since low SES has been associated with higher rates of obesity and cardiometabolic outcomes4–6, low SES represents one potential driver of higher obesity rates among Hispanic persons.
Low SES is associated with lower health literacy, decreased access to purportedly healthier foods such as fruits and vegetables4, 7, 8, and poor diet quality as assessed by increased consumption of calories, fat, sugar, and sodium9–11. Additionally, low SES families often live in neighborhoods characterized by higher concentrations of fast-food restaurants, which offer a variety of foods high in calories, fat, sugar and sodium12, 13. Interventions attempting to overcome these presumptive obesity-related barriers in low SES populations have yielded unsatisfactory results. For example, Leroy and colleagues tested the effects of a cash and in-kind transfer program intended to improve food availability and health education by randomly assigning participants to the provision of food baskets plus nutrition education, food baskets only, or cash plus nutrition education in low SES women in rural Mexico for a period of 23 months14. Results showed that women in all three intervention groups gained significantly more weight relative to the control group and the effect was even more pronounced among overweight and obese women14 – a pattern that is the opposite of the original aims of the study. Findings from these studies, and others, indicate that additional factors beyond access to material resources affect susceptibility to obesity in socially disadvantaged populations.
Self-perception of social standing is an important, but often overlooked factor when exploring the relationship between social status and health. Unlike traditional measures of SES, which often assess income, education, and occupational prestige at one point in time to reflect position within a social hierarchy15, subjective measures of social status account for a culmination of earlier life and family circumstances, perceived prospects for social mobility, and internalization of relative social standing and/or subordinate status16–18. Internalization of low subjective social status may be a psychosocial stressor that negatively alters health-related behaviors19. Therefore, a measure of one’s perceived relative social standing and internalization of subordination may be a better measure for exploring the associations between social status and health outcomes20, 21.
Subjective measures of social standing have been associated with a variety of health-related outcomes in adults including self-rated health22–26, mortality, diabetes24, mental health23, 26, depression24, and cardiovascular disease risk20, 24, 27 among others. Subjective measures of social standing have also been associated with weight status cross-sectionally28 and longitudinally29 in non-Hispanic Black and White youth, but to our knowledge has not been investigated in adults or Hispanic persons. Cumulatively, these findings support the idea that perceived social standing may represent an appropriate framework for exploring associations between social status, SES, and health outcomes; however, the mechanism for the relationship between perceived social standing and obesity-related outcomes remains unclear.
Experimental manipulation of social standing would offer insight into the relationship between SES, internalization of relative social standing and/or subordinate status, and obesity-related outcomes and may help identify the causal mechanisms underlying low social status as a pathway for obesity. Therefore, the objective of this pilot study was to investigate the effects of experimentally manipulated social status on ad libitum acute dietary intakes and stress-related outcomes. We hypothesized that individuals would a) consume more energy (i.e., number of digestible calories), and more fat, sugar, and sodium following the low social status condition when compared to the high social status condition and, b) demonstrate higher stress (objective and subjective) following the low versus high social status manipulation. This study contributes to the literature on social status and health by investigating increased dietary intake as a causal mechanism relating SSS and weight status by examining the effects of experimentally manipulated social status on acute eating behavior and stress-related outcomes in a historically understudied population of Hispanic young adults.
2. Methods
2.1. Subjects
This study was a feasibility pilot, randomized crossover study in nine self-identified Hispanic young adults ages 19–25 years. Given this was funded to be a feasibility pilot study, our resources only allowed us to have nine participants enroll. As a result of some participants not showing up for their second study visit, a subsample of participants completed the high social status condition (n=7) and the low social status condition (n=8). Participants were recruited in the greater Denver, Colorado area in 2015 via flyers, online ads, television, and participant referrals. Given our limited sample size, we wanted to limit potential confounders and chose to study individuals with a body mass index (BMI) ≤30 kg/m2 as a means of identifying factors that precede and potentially contribute to the development of obesity. For study inclusion, participants had a BMI ≥18.5 kg/m2 and ≤30 kg/m2 and had no plans for extended travel (>1 week) within two months of beginning the study. Given that recently immigrated Hispanic individuals may have different perceptions, risks, and experiences when compared to Hispanic persons born in the United States30, we excluded participants not born in the United States. Additional exclusion criteria included smoking, strict dietary restrictions (including vegan, vegetarian, gluten-free, dairy-free/lactose intolerant), participation in any weight reduction program, weight-loss diet, weight loss or gain of ≥10 pounds in the past 3 months, pregnancy, currently taking medication known to influence appetite or body composition, suffering from psychiatric disorder, known substance abuse or eating disorder, or any major disease known to affect body composition, metabolism, or cardiac function. Participants were also excluded if they had never before played the game of Monopoly™. All participants provided informed consent to the protocol, which was approved by the Institutional Review Board at the University of Colorado Denver Anschutz Medical Campus. All measurements were collected by trained staff in the Nutrition Obesity Research Center at the University of Colorado Denver Anschutz Medical Campus. Participants were compensated with a $25 gift card following each study visit, for a total compensation of $50 if they completed both study visits.
2.2. Protocol
This was a pilot, randomized crossover design trial conducted at the Children’s Eating Laboratory at the Nutrition Obesity Research Center at University of Colorado’s Anschutz Medical Campus (Clinical-Trials.gov NCT02470949). Eligibility for the study was assessed through a detailed phone interview. Eligible participants were sent the consent form and, if interested, scheduled for their first visit. All participants were asked to fast overnight beginning at 9 pm, to avoid strenuous exercise for three days prior to the study visit, and to avoid alcohol or caffeinated beverages for at least 12 hours before the study visit. Participants were randomized to study condition using a randomization sequence generated by a computer program. Participants were blinded to the main aim of the study to minimize any bias or confounding as a result of participant expectations. They were told that the aim of the study was to investigate the influence of financial circumstances during a game of Monopoly™ on subtle behaviors; no reference was made to dietary intakes or stress response. Following the completion of the entire study, participants were fully debriefed and informed regarding the nature of the study and outcome variables.
The study protocol for visit 1 and 2 for this randomized, crossover study is described in Figure 1. On arrival to the first study visit (approximately 9 am), participants were asked to confirm fasting status and leave all outside food and drinks, bags, and cell phones in the waiting area. Written informed consent was obtained and participants were asked to rest for one minute. Baseline measurements of systolic blood pressure (SBP), diastolic blood pressure (DBP) and heart rate (HR) were completed. Anthropometrics were assessed and BMI was calculated. Participants were asked to complete visual analog scales (VAS; 1–100) to assess feelings of stress, powerfulness, and hunger perceptions.
Figure 1.
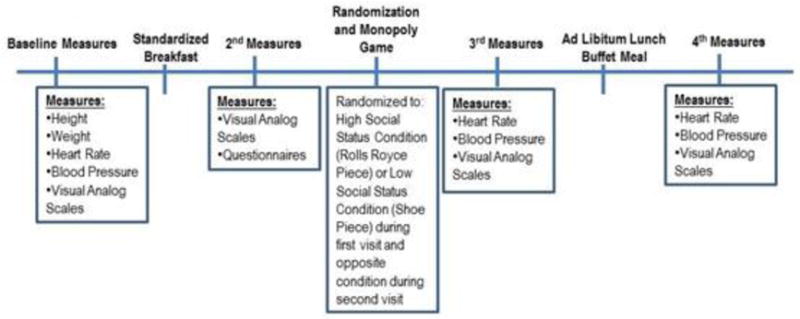
Study Protocol
Participants consumed a standardized breakfast. This was followed by a second VAS and a variety of questionnaires related to socio-demographics and health-related behaviors. Once participants were finished with the questionnaires, they were told the researcher needed to add up their questionnaire scores. When the researcher returned, the participant randomly assigned to the high status position was told, “Congratulations, based on your test performance you have been given the Rolls Royce piece.” The other participant, randomly assigned to the low status position, was told “I’m sorry. Based on your test performance, you have been given the shoe piece.” Participants were subsequently placed in a room where they played a game of Monopoly™ for 40 minutes using the game piece they had been assigned. One participant playing was randomized to the high social status condition (Rolls Royce piece) and the other participant was randomized to the low social status condition (shoe piece). The participants played each other and were aware of the other participant’s rules.
Rules were given to the participants and a physical copy of the rules was left on the table where the two participants played Monopoly™ for the duration of the game. Similar to work conducted by Piff and colleagues31, the rules for the Monopoly™ game differed depending on whether the participants had been randomized to the high social status condition (Rolls Royce piece) or to the low social status condition (shoe piece). Our protocol differed from Piff’s study by increasing the duration of the game from 15 minutes to 40 minutes to ensure the desired effect on social standing took place31. The rules for the high social status condition included starting the game with $2000, rolling both dice at each turn, collecting $200 when passing “Go”, and having the role of banker throughout the game. In contrast, the rules for the low social status condition included starting the game with $1000, rolling only one die at each turn, collecting $100 when passing “Go”, and being unable to “roll their way out” if they landed in jail (because they could only roll one die at a time). Thus, the rules for the Monopoly™ game differed substantially in terms of degree of ‘privilege’ depending on the assigned randomized social status with the high social status condition demonstrating a higher ‘status’ or ‘privilege’ relative to the low social status condition. The manipulation of perceived social standing promotes internalization of relative social standing and/or subordinate status and perceived prospects for social mobility in the rigged Monopoly™ game paradigm31. The participants were also instructed not to help each other during the game and that all other standard rules for Monopoly™ applied.
After 40 minutes of playing Monopoly™, the researchers had the participants return to their original, respective rooms. For the second time, blood pressure and HR were assessed in duplicate and the VAS was completed. The researcher brought the ad libitum buffet lunch on a tray to each participant’s room, where they were alone for 20 minutes to consume their lunch. Following the 20 minutes, the researcher returned to each room, assessed blood pressure and HR for the third time, and the VAS was completed. The researcher provided compensation to each participant and then weighed the food once both participants left.
Participants were asked to return for a second visit at least four weeks after their first visit. All protocols remained the same in the second visit with the exception that the participants were placed in the opposite social status condition. For example, if a participant had been randomized to the low social status condition (the shoe piece) during the first visit, they were exposed to the high social status condition (the Rolls Royce piece) in the second visit and were aware that their status changed based on the rules for that piece.
2.3. Anthropometric Measures
Anthropometric measurements for all participants were obtained by trained staff. Participants were weighed (Smart Body Analyzer WS-50; Withings, Issy-les-Moulineaux, France) to the nearest 0.1 kg (in minimal clothing without shoes) and height was recorded to the nearest 0.1 cm without shoes using a stadiometer (Heightronic 235; Measurement Concepts, Snoqualmie, WA). BMI was calculated as: (kg) / height (m)2.
2.4. Measurement of Blood Pressure and Heart Rate
SBP, DBP, and HR were measured using an automated blood pressure and HR monitor (Omron BP710N, Omron Europe, The Netherlands). Measures were taken in duplicate and averaged at each of the three time points (before game, after game/before lunch, and after lunch).
2.5. Measurement of Stress, Powerfulness, and Hunger
Perceived feelings were quantitatively assessed using VAS in a two-page questionnaire with similar questions grouped together (i.e., stress, anxiety, and guilt). The instrument incorporated a 100mm straight horizontal line between two opposing statements defined as ‘very little’ to ‘very much’. Participants were told to mark an ‘x’ on the horizontal line in relation to their feelings in that moment. These scales have been validated for repeated use within subjects under controlled or experimental settings32 and have been used in similar randomized crossover trials related to dietary intake33. The data showed high correlations between the item scores and as a result of our small sample size, we chose to group these items together to increase power. Three variables were created to evaluate the VAS including VAS1: average of perceived stress, anxiety, and guilt; VAS2: average of perceived feelings of powerfulness and pride; and VAS3: average of perceived hunger and desire to eat. For variables in VAS1, stress, anxiety, and guilt are significantly correlated with correlation coefficients between 0.56–0.65 (p<0.05). For variables in VAS2, powerfulness and pride are significantly correlated (r=0.73, p<0.0001). For variables in VAS3, hunger and desire to eat are significantly correlated (r=0.93, p<0.0001). In the analysis, we included three time points that matched those taken for blood pressure and HR including at before game, after game/before lunch, and after lunch.
2.6. Socioeconomic Status and Subjective Social Status
Socioeconomic status was assessed during the study visit with participants reporting their highest level of education and their household income in a questionnaire. During the telephone screening, subjective social status (SSS) was measured with the Subjective Social Status Scale22, a validated scale that asks individuals to report their perceived position in U.S. society and in their community. For example, the community SSS question states, “Imagine that this ladder represents the place that people occupy in their community. At the top of the ladder are the people who are the best off – they have the most money, the most education, and the most respected jobs. At the bottom of the ladder are the people who are the worst off – they have the least money, the least education, and the least respected jobs or no job. Where would you place yourself on this ladder with 10 being the highest and 1 being the lowest?” Scores range from 1 to 10, with higher scores representing higher SSS. For study inclusion, participants had to report a score on the community Subjective Social Status Scale ≥3 and ≤8 during their telephone screening. We hypothesized that individuals with a score greater than 8 or less than 3 would have presented as more challenging to experimentally manipulate their social status and thus, those individuals would be excluded. However, no one who underwent the telephone screening (n=34) reported a score greater than 8 or less than 3.
2.7. Dietary Intake Assessment
Participants arrived fasting to both study visits and received the same standardized breakfast in both conditions (ham, egg, and cheese breakfast sandwich, 210 kcal, 8 g fat, 24 g carbohydrate, 11 g protein, 2 g sugar, 630 mg sodium, and 1 g fiber; 499 g water). They were not offered additional food. Hunger and desire to eat were assessed with VAS before and after breakfast, and the VAS hunger score was significantly lower after breakfast compared to that before breakfast (p<0.001; data not shown).
At the ad libitum buffet lunch meal, participants were provided with a variety of foods and beverages, for a total offering of 1715 kcal (nutritional composition of items is described in Table 2). All foods were pre- and post-weighted to the nearest 0.1 g to assess ad libitum buffet lunch meal food consumption. The data were entered into a Nutrition Data System for Research (Nutrition Coordinating Center, University of Minnesota). The variables analyzed included total energy intake (kcal), macronutrient composition (% of total energy from fat, carbohydrate, and saturated fat), total fat (g), total carbohydrate (g), total sugar (g), added sugar (g), fiber (g), and sodium (mg). Percent of daily energy needs was assessed using the Mifflin-St Jeour equation34 and percent of daily energy needs consumed at the lunch buffet meal was assessed as an outcome variable.
Table 2.
Composition of foods offered during Ad Libitum Buffet Lunch Meal
| Food | Weight (g) | Calories (kcal) | Fat (g) | Saturated Fat (g) | Carbohydrate (g) | Protein (g) | Sugar (g) | Sodium (mg) | Fiber (g) |
|---|---|---|---|---|---|---|---|---|---|
| Meat Lasagna | 283 | 420 | 19 | 7 | 41 | 20 | 6 | 750 | 4 |
| Green Beans | 100 | 31 | 0 | 0 | 7 | 2 | 3 | 6 | 3 |
| Macaroni and Cheese | 241 | 360 | 15 | 8 | 41 | 13 | 2 | 700 | 2 |
| Doritos Nacho Cheese | 28 | 150 | 8 | 1.5 | 17 | 2 | 1 | 180 | 1 |
| Classic Applesauce | 255 | 194 | 0 | 0 | 51 | 0 | 41 | 49 | 5 |
| White Chocolate Chunk Macadamia Cookies | 200 | 260 | 12 | 6 | 34 | 2 | 12 | 170 | 0 |
| Bottled Water | 499 | 0 | 0 | 0 | 0 | 0 | 0 | 0 | 0 |
| Cola | 355 | 160 | 0 | 0 | 41 | 0 | 40 | 15 | 0 |
| Pink Lemonade | 355 | 140 | 0 | 0 | 36 | 0 | 35 | 135 | 0 |
2.8. Monopoly Winnings
To assess if the study design effectively changed the outcome of the Monopoly™ game, we calculated Monopoly™ winnings at the end of each game. The cash value, property value, and total value (combination of cash and total property value) of each player’s Monopoly™ winnings were calculated.
2.9. Statistical Analysis
Demographic and outcome variables are summarized as mean ± SD for continuous variables, or n (%) for categorical variables. Residual analyses were conducted for each outcome to check independence and normality assumptions using the Kolmogorov-Smirnov test. Outcomes that were non-normally distributed were transformed using Box-Cox transformation before tests were conducted. Given this study has a 2 × 2 cross-over design, carry-over effects were tested for each outcome of interest35. Significant carry-over effects were detected only for total sugar and added sugar consumption (P=0.02 and 0.01 respectively). Therefore, analyses were conducted in two ways: 1) including data at both visits and 2) including data at the first visit only. Given that the primary outcome of the study was total energy intake, which did not have a significant carry-over effect, our results focus primarily on data including both study visits.
For analyses of data at both visits, interventions (low social status condition versus high social status condition) were compared using Grizzle’s model35, including adjustment for intervention sequence effects and visit effects. For analyses of data at the first visit only, the two interventions were compared directly using general linear models. For variables measured multiple times per visit (i.e. VAS, blood pressure, and HR), data collected before breakfast at each visit were treated as the baseline measures, data points collected after the game of Monopoly were treated as midpoint measures, and data points collected after the lunch meal were treated as the outcomes. Mixed models were used for repeated measures including baseline measure, intervention, time, and intervention by time interaction as predictors. Post hoc power was computed and the power achieved is 0.529 for total energy intake and 0.742 for the adjusted energy intake, given the cross-over design and assuming no carry-over effect. All analyses were conducted using SAS 9.4 (SAS Institute, Cary, NC, USA). Significance was set at p ≤ 0.05, 2-tailed.
3. Results
Descriptive statistics of the participants are reported in Table 1. Participants had a mean age of 22.3±1.6 years, were 67% female, and had a mean BMI of 22.8 kg/m2. The majority of participants (55%) were students or employed full-time, 77% completed some college or were college graduates, and 89% reported a household income below $41,000 a year. More than half of participants (55%) reported high subjective social status at baseline (as defined by a score of 6–10 on the community Subjective Social Status Scale22).
Table 1.
Demographics of Study Participants
| Variable | Mean ± SD or n (%) (n=9) |
|---|---|
| Age (years) | 22.3 ± 1.6 |
| Sex (% Female) | 6 (67%) |
| Employment | |
| Full time | 3 (33%) |
| Part time | 1 (11%) |
| Unemployment | 3 (33%) |
| Student | 2 (22%) |
| Education | |
| High School Diploma/GED | 2 (22%) |
| Some college | 2 (22%) |
| College graduate | 4 (44%) |
| Some graduate/professional school | 1 (11%) |
| Household income | |
| $5,000–40,999 | 8 (89%) |
| $41,000–$99,999 | 0 (0%) |
| $100,000–124,999 | 1 (11%) |
| Reported Community Subjective Social Status | |
| Low social status (3–5) | 4 (44%) |
| High social status (6–8) | 5 (55%) |
| BMI (kg/m2) | 22.8 ± 2.8 |
| Weight (kg) | 63.0 ± 11.0 |
| Height (cm) | 165 ± 7 |
| Estimated Energy Needs | 1830.53 ± 123.25 |
Values may not equal 100% due to rounding.
* Estimated energy needs were assessed using the Mifflin-St Jeour equation (Mifflin et al, 1990).
3.2. Monopoly Winnings
Monopoly winnings are depicted in Figure 2. Relative to the high social status condition, participants in the low social status condition had significantly lower cash winnings ($250 vs. $1017; p=0.03), lower property winnings (valued at $940 vs $2466; p<0.0001), and lower total value winnings (valued at $1084 vs $3482; p=0.004). This served as the manipulation check to ensure that social status had shifted in relation to the other player in accordance with assigned social status.
Figure 2.

Monopoly Winnings stratified by cash, total property value, and total value (combination of cash and total property value)
3.3. Ad Libitum Lunch Buffet Meal
The composition of foods offered at the ad libitum lunch buffet meal is described in Table 2. Due to significant carry-over effects for total sugar and added sugar consumption, dietary intake data from both study visits (Table 3) and data from the first visit only (Table 4) are shown. Given that the primary outcome of the study was total energy intake, which did not have a significant carry-over effect and no significant differences were detected related to sugar consumption in any models, our results focus primarily on data including both study visits described in Table 3. When compared to the high social status condition, participants in the low social status condition consumed 130 more calories (p=0.07) and consumed a significantly higher proportion of their daily calorie needs in the ad libitum buffet lunch meal (39% of daily calorie needs in low social status condition versus 31% of daily calorie needs in high social status condition; p=0.04). The participants also consumed a greater percentage of their calories from saturated fat in the low social status condition relative to the high social status condition (p=0.07). Though not statistically significant in this small pilot study, it is important to note that participants in the low social status condition consumed almost 375 mg more sodium relative to the high social status condition (601 ± 428 mg for high social status vs 975 ± 343 mg for low social status, p=0.14). Differences in energy intakes and sodium are due to those in the low social status condition consuming significantly more lasagna (p=0.0007) and macaroni and cheese (p=0.03) relative to the high social status condition (Table 3). No other significant or nearly significant differences were observed in macro- or micro-nutrient intakes, or between foods consumed.
Table 3.
Dietary Intakes, both study visits (mean±SD)
| Variable | High Social Status (n=7) |
Low Social Status (n=8) |
P-value* |
|---|---|---|---|
| Energy, kcal | 520.9 ± 231.2 | 647.5 ± 252.8 | 0.07 |
| % of Energy Needs** | 0.31 ± 0.10 | 0.39 ± 0.13 | 0.044 |
| % of calories from fat | 27.9 ± 3.5 | 30.5 ± 3.3 | 0.16 |
| % of calories from carbohydrate | 58.0 ± 6.0 | 54.6 ± 5.4 | 0.31 |
| % of calories from saturated fat | 12.3 ± 1.9 | 14.3 ± 1.7 | 0.07 |
| Total fat, g | 17.0 ± 9.1 | 22.4 ± 8.6 | 0.14 |
| Total Carbohydrate, g | 75.4 ± 29.9 | 89.3 ± 37.1 | 0.18 |
| Total sugar, g | 30.9 ± 14.0 | 35.4 ± 19.2 | 0.33 |
| Added sugar, g | 19.3 ± 9.7 | 24.2 ± 14.8 | 0.18 |
| Fiber, g | 5.9 ± 2.4 | 6.2 ± 3.0 | 0.41 |
| Sodium, mg | 601.1 ± 427.7 | 975.4 ± 343.2 | 0.14 |
| Meat Lasagna (g) | 128.3 ± 95.0 | 158.5 ± 95.8 | 0.0007 |
| Green Beans (g) | 72.8 ± 34.2 | 77.1 ± 44.0 | 0.63 |
| Macaroni and Cheese (g) | 110.9 ± 60.0 | 146.6 ± 48.6 | 0.03 |
| Doritos Nacho Cheese (g) | 8.1 ± 9.8 | 7.7 ± 9.5 | 0.80 |
| Classic Applesauce (g) | 111.9 ± 60.0 | 83.3 ± 80.7 | 0.16 |
| White Chocolate Chunk Macadamia Cookies (g) | 10.4 ± 10.8 | 18.6 ± 18.9 | 0.39 |
| Bottled Water (g) | 205.0 ± 130.3 | 234.7 ± 142.1 | 0.84 |
| Cola (g)*** | 7.1 ± 18.9 | 0.0 ± 0.0 | – |
| Pink Lemonade (g) | 47.0 ± 61.1 | 83.9 ± 123.5 | 0.37 |
| Total food consumed (g) | 496.5 ± 164.0 | 575.3 ± 243.8 | 0.29 |
P-values were computed using mixed model adjusting for intervention sequence and visit effects.
Adjusted kcal was computed by taking the ratio of kcal consumed by estimated energy needs (Mifflin et al, 1990).
Only one subject drank cola at one visit, thus no comparison could be made
Table 4.
Energy and Macronutrient Intakes, visit 1 only (mean ± SD)
| Variable | High Social Status (n=5) |
Low Social Status (n=4) |
P-value 1* | P-value 2** |
|---|---|---|---|---|
| Energy, kcal | 601.8 ± 224.5 | 548.8 ± 237.1 | 0.73 | 0.73 |
| % of Energy Needs*** | 0.35 ± 0.10 | 0.35 ± 0.14 | 0.96 | |
| % of calories from fat | 27.9 ± 4.1 | 32.5 ± 2.8 | 0.10 | 0.40 |
| % of calories from carbohydrate | 59.3 ± 6.5 | 50.8 ± 4.6 | 0.06 | |
| % of calories from saturated fat | 12.9 ±1.8 | 15.0 ± 2.0 | 0.13 | |
| Total fat, g | 19.8 ± 9.5 | 20.2 ± 8.9 | 0.96 | 0.58 |
| Total Carbohydrate, g | 88.1 ± 25.2 | 71.4 ± 35.4 | 0.43 | |
| Total sugar, g | 37.9 ± 9.0 | 23.8 ± 18.2 | 0.17 | |
| Added sugar, g | 24.3 ± 5.7 | 15.0 ± 13.1 | 0.19 | |
| Fiber, g | 6.5 ± 2.6 | 5.0 ± 2.5 | 0.41 | |
| Sodium, mg | 616.5 ± 512.9 | 897.0 ± 302.2 | 0.37 |
P-value 1 is the p-value for individual variables.
P-value 2 is the p-value for testing the variables as a group using MANOVA analysis.
Adjusted kcal was computed by taking the ratio of kcal consumed by total energy needs (Mifflin et al, 1990).
3.4. Markers of Stress, Powerfulness, and Hunger
Markers of stress, powerfulness, and hunger at three time points are reported in Table 5. Relative to the high social status condition, participants in the low social status condition demonstrated higher HR following the game of Monopoly™ (p=0.056), but this relationship disappeared once lunch was consumed (p=0.31).When placed in the low social status condition, participants reported decreased feelings of pride and powerfulness following the game of Monopoly™ (p=0.047) and after their lunch meal (p=0.08). No other differences were observed between the two social status conditions in regards to stress, powerfulness, or hunger.
Table 5.
Markers of Stress, Powerfulness, and Hunger by Time Point, both study visits
| Variable | Social Status | TIME | ||||||||||
|---|---|---|---|---|---|---|---|---|---|---|---|---|
| Before Game | After Game/Before Lunch | P-value* | After Lunch | P-value** | ||||||||
| n | Mean | SD | n | Mean | SD | n | Mean | SD | ||||
| SBP | High | 7 | 106.6 | 13.9 | 7 | 106.8 | 12.3 | 0.88 | 7 | 109.4 | 14.0 | 0.19 |
| Low | 8 | 110.8 | 15.6 | 8 | 111.0 | 18.2 | 8 | 111.5 | 16.8 | |||
| DBP | High | 7 | 72.6 | 9.3 | 7 | 72.4 | 7.2 | 0.30 | 7 | 71.7 | 7.8 | 0.65 |
| Low | 8 | 75.5 | 10.2 | 8 | 75.6 | 11.3 | 8 | 76.0 | 13.3 | |||
| HR | High | 7 | 66.8 | 13.6 | 7 | 61.3 | 6.8 | 0.056 | 7 | 68.0 | 12.3 | 0.31 |
| Low | 8 | 70.8 | 13.4 | 8 | 66.5 | 7.5 | 8 | 68.8 | 7.8 | |||
| VAS1 (stress, anxiety, and guilt) | High | 7 | 12.3 | 8.2 | 7 | 12.5 | 9.6 | 0.22 | 7 | 10.4 | 10.6 | 0.39 |
| Low | 8 | 26.0 | 21.9 | 8 | 13.1 | 10.6 | 8 | 12.1 | 11.6 | |||
| VAS2 (powerfulness and pride) | High | 7 | 45.1 | 15.7 | 7 | 52.1 | 9.4 | 0.047 | 7 | 49.7 | 14.1 | 0.08 |
| Low | 8 | 49.3 | 15.6 | 8 | 38.4 | 14.4 | 8 | 44.7 | 15.5 | |||
| VAS3 (hunger and desire to eat) | High | 7 | 62.9 | 25.7 | 7 | 39.3 | 29.6 | 0.16 | 7 | 2.8 | 3.1 | 0.80 |
| Low | 8 | 59.8 | 23.3 | 8 | 37.4 | 26.1 | 8 | 3.5 | 4.1 | |||
The p-values are to compare two interventions on the outcome at time 2 after adjusting for the difference of the outcome measures at baseline.
The p-values are to compare two interventions on the outcome at time 3 after adjusting for baseline measures at time 1.
VAS=Visual Analog Scale; VAS1: average of perceived stress, anxiety, and guilt; VAS2: average of perceived feelings of powerfulness and pride; VAS3: average of perceived hunger and desire to eat
4. Discussion
We investigated the effects of experimentally manipulated social status on acute ad libitum dietary intakes during a lunch meal and stress-related outcomes in this pilot feasibility, randomized crossover study. Social status was substantially altered, with participants in the low social status condition ending the game of Monopoly™ with significantly lower cash, property, and total value of winnings. Consistent with our hypotheses, participants in the low social status condition consumed a significantly higher proportion of their daily calorie needs relative to the high social status condition. When placed in the low social status condition, participants reported decreased feelings of pride and powerfulness and demonstrated a nearly significant increase in HR. Our findings suggest experimentally manipulated low social status results in increased energy consumption, a nearly significant increase in HR (a stress-related outcome), and decreased feelings of powerfulness and pride.
Differences in acute dietary intakes were observed between the low social status condition and high social status condition. When compared to the high social status condition, participants in the low social status condition consumed more calories (nearing significance with p=0.07) at the ad libitum lunch buffet meal, which resulted in a significantly higher proportion of their daily calorie needs consumed. Taking into account the additional calories consumed during the standardized breakfast, participants in the low social status condition consumed approximately 50% of their daily calorie needs before noon, all within a three hour span. Without subsequent compensation in energy intake or physical activity later in the day, this could potentially be a risk factor for excess calories consumed that day, resulting in positive energy balance. Though long-term energy balance measures were outside the scope of this study, we posit that chronic low social status conditions could promote increased energy intake, potentially resulting in positive energy balance and weight gain over time. However, larger and longitudinal studies assessing comprehensive measures of energy balance are needed to test this hypothesis.
Macronutrient and micronutrient composition of food consumed differed by social status condition. Though the literature on the adverse effects of saturated fat is mixed36, the World Health Organization recommends no more than 10% of total calories consumed should be derived from saturated fat37. Participants in both social status conditions exceeded recommended intakes, but participants in the low social status condition consumed a greater percentage of calories from saturated fat relative to the high social status condition. The 2015 Dietary Guidelines for Americans recommends adults should not exceed 2,300 mg sodium per day38. In the ad libitum lunch buffet meal alone, participants in the low social status condition consumed 42% of their recommended daily sodium intake, while those in the high social status condition only consumed 26% of their recommended daily sodium intake. Given that participants consumed significantly more grams of lasagna and macaroni and cheese in the low social status condition than in the high social status condition, it is likely that the difference in total energy intake, saturated fat, and sodium is a direct result of consuming more lasagna and macaroni and cheese (both foods are relatively high in energy, saturated fat, and sodium) in the low social status condition. These data suggest that, when placed in a low social status condition, participants are more likely to choose energy and sodium dense foods that are high in saturated fat. This is consistent with data observed in free-living populations indicating that social class is associated with poorer overall diet quality9, generally attributed to the disparity in energy costs ($/kcal) between energy-dense versus nutrient-dense foods and easy access to these foods39, 40. However, in our experimental design, participants were provided these foods at no cost and both energy- and nutrient-dense foods were available. One potential explanation is that factors beyond resource deprivation are influencing individuals in low social status conditions to select energy-dense, nutrient-poor foods. However, this remains outside the scope of what this study design and project can answer and additional research disentangling these complex relationships is needed.
The physiological data on heart rate indicates a nearly significant stress response following the Monopoly™ game in the low social status condition; however, this relationship was not significant once the participants had eaten lunch. This concurs with previous experimental work demonstrating that individuals consume more energy-dense, high fat foods when placed in stressful conditions relative to unstressed conditions41. Taken together, it appears that stress as a result of low social standing could impact health and weight-related outcomes through deleterious stress-related changes in food choices. However other measures of stress, including subjective and objective measures of stress, did not show significant differences. This may be due to lack of power to detect differences, participant traits that were outside of the scope of the study (i.e., competitiveness of the individual), or the need for more robust measures of stress (i.e., salivary cortisol). Additionally, participants reported significantly decreased feelings of pride and powerfulness in the low social status condition when compared to the high social status condition. Various psychological factors are associated with social standing, including feelings of powerfulness42 and pride43. The decreased feelings of pride and powerfulness observed in our study may be mediating or moderating the effects of experimentally manipulated social status on eating behavior. These relationships should be examined in future studies.
The limitations of this feasibility pilot study include a small sample size and results that may not be generalizable to the whole population, as this study was only carried out in predominantly highly educated Hispanic young adults. Due to the small sample size, mediation analysis was not possible. The post hoc power analysis demonstrated that we were not adequately powered to detect differences in total energy intake (52.9% power) or adjusted energy intake (74.2% power). Thus, these analyses should be considered exploratory and data and results should be considered preliminary and not yet definitive. Additionally, the participants were only provided with a few lower energy dense options (green beans, applesauce, and water), dietary intakes were only measured at one meal, and we did not directly measure energy expenditure. Therefore, we were not able to calculate net energy balance over a 24-hour period. Additionally we were not able to calculate energy density and this should be assessed in future studies. Due to logistical reasons, it was also not possible for the researchers to conduct this study blinded to experimental conditions; thus, the results are potentially subject to bias, where subconscious actions by the researchers could influence the results. In an attempt to minimize bias, all study interactions were standardized in a protocol. We also did not assess how many participants guessed the correct objective of the study, and this will be included in future studies. The strengths of this study include a randomized crossover design and direct measures of actual food intake. We were also able to build in controls such that participants arrived in a fasted state and were provided a standardized breakfast. Several markers of stress were obtained including objective markers such as HR and blood pressure. Additionally, winnings from the Monopoly™ game indicated that the study design successfully changed the outcome of the game, suggesting that it was an effective method for experimentally manipulating acute subjective social status. Future research should include a larger, more diverse sample to increase statistical power and generalizability. Given that there were carry-over effects for sugar and added sugar, a parallel randomized design may be more appropriate in a future study. Future testing of mediation analysis to explore whether stress and powerfulness perceptions mediate social status condition effects on eating should be conducted. Future work should also include assessment of dietary intake and energy expenditure over a longer period of time to calculate net energy balance. Furthermore, it would be valuable to include more robust measures of stress, such as cortisol levels and heart rate using a heart rate monitor.
5. Conclusions
In summary, experimentally manipulated social status influenced acute ad libitum dietary intakes and stress-related outcomes in this pilot, randomized crossover trial. Participants in the low social status condition consumed more total calories and a significantly higher proportion of their daily calorie needs relative to the high social status condition. When placed in the low social status condition, participants reported decreased feelings of pride and powerfulness and demonstrated an increase in resting heart rates. Our findings suggest experimentally manipulated low social status results in increased energy consumption, an increase in a stress-related outcome, and decreased feelings of powerfulness and pride.
Acknowledgments
We would like to acknowledge Dr. Kristina Harris Jackson for her help with study design and data collection.
Funding:
This research was supported in part by NIH grants T32DK007658, T32HL105349, and P30DK056336. The opinions expressed are those of the authors and not necessarily the NIH or any other organization.
Footnotes
Disclosure Statement
The authors have no conflict of interest to disclose.
References
- 1.Ogden CL, Carroll MD, Kit BK, Flegal KM. Prevalence of childhood and adult obesity in the United States, 2011–2012. JAMA. 2014;311:806–814. doi: 10.1001/jama.2014.732. [DOI] [PMC free article] [PubMed] [Google Scholar]
- 2.Cardel M, Willig AL, Dulin-Keita A, Casazza K, Mark Beasley T, Fernandez JR. Parental feeding practices and socioeconomic status are associated with child adiposity in a multi-ethnic sample of children. Appetite. 2012;58:347–353. doi: 10.1016/j.appet.2011.11.005. [DOI] [PMC free article] [PubMed] [Google Scholar]
- 3.DeNavas-Walt C, Proctor BD. Income and Poverty in the United States: 2014. Current Population Reports. 2015:P60–252. [Google Scholar]
- 4.Janssen I, Boyce WF, Simpson K, Pickett W. Influence of individual- and area-level measures of socioeconomic status on obesity, unhealthy eating, and physical inactivity in Canadian adolescents. Am J Clin Nutr. 2006;83:139–45. doi: 10.1093/ajcn/83.1.139. [DOI] [PubMed] [Google Scholar]
- 5.Kivimaki M, Smith GD, Juonala M, Ferrie JE, Keltikangas-Jarvinen L, Elovainio M, Pulkki-Raback L, Vahtera J, Leino M, Viikari JS, Raitakari OT. Socioeconomic position in childhood and adult cardiovascular risk factors, vascular structure, and function: cardiovascular risk in young Finns study. Heart. 2006;92:474–80. doi: 10.1136/hrt.2005.067108. [DOI] [PMC free article] [PubMed] [Google Scholar]
- 6.Ogden CL, Lamb MM, Carroll MD, Flegal KM. Obesity and socioeconomic status in children and adolescents: United States, 2005–2008. NCHS data brief. 2010:1–8. [PubMed] [Google Scholar]
- 7.Drewnowski A. Obesity and the food environment: Dietary energy density and diet costs. Am J Prev Med. 2004;27:154–162. doi: 10.1016/j.amepre.2004.06.011. [DOI] [PubMed] [Google Scholar]
- 8.Drewnowski A, Darmon N. Food choices and diet costs: an economic analysis. J Nutr. 2005;135:900–4. doi: 10.1093/jn/135.4.900. [DOI] [PubMed] [Google Scholar]
- 9.Darmon N, Drewnowski A. Does social class predict diet quality? Am J Clin Nutr. 2008;87:1107–1117. doi: 10.1093/ajcn/87.5.1107. [DOI] [PubMed] [Google Scholar]
- 10.Bates CJ, Prentice A, Cole TJ, van der Pols JC, Doyle W, Finch S, Smithers G, Clarke PC. Micronutrients: highlights and research challenges from the 1994–5 National Diet and Nutrition Survey of people aged 65 years and over. Br J Nutr. 1999;82:7–15. doi: 10.1017/s0007114599001063. [DOI] [PubMed] [Google Scholar]
- 11.Galobardes B, Morabia A, Bernstein MS. Diet and socioeconomic position: does the use of different indicators matter? Int J Epidemiol. 2001;30:334–340. doi: 10.1093/ije/30.2.334. [DOI] [PubMed] [Google Scholar]
- 12.Davis B, Carpenter C. Proximity of Fast-Food Restaurants to Schools and Adolescent Obesity. Am J Public Health. 2009;99:505–510. doi: 10.2105/AJPH.2008.137638. [DOI] [PMC free article] [PubMed] [Google Scholar]
- 13.Fraser LK, Clarke GP, Cade JE, Edwards KL. Fast Food and Obesity: A Spatial Analysis in a Large United Kingdom Population of Children Aged 13–15. Am J Prev Med. 2012;42:e77–e85. doi: 10.1016/j.amepre.2012.02.007. [DOI] [PubMed] [Google Scholar]
- 14.Leroy JL, Gadsden P, Gonzalez de Cossio T, Gertler P. Cash and in-kind transfers lead to excess weight gain in a population of women with a high prevalence of overweight in rural Mexico. J Nutr. 2013;143:378–83. doi: 10.3945/jn.112.167627. [DOI] [PubMed] [Google Scholar]
- 15.Hollingshead A. Four factor index of social status. New Haven, CT: Yale University Press; 1975. [Google Scholar]
- 16.Goodman E, Adler NE, Kawachi I, Frazier AL, Huang B, Colditz GA. Adolescents’ perceptions of social status: Development and evaluation of a new indicator. Pediatrics. 2001;108 doi: 10.1542/peds.108.2.e31. [DOI] [PubMed] [Google Scholar]
- 17.Goodman E. The role of socioeconomic status gradients in explaining differences in US adolescents’ health. Am J Public Health. 1999;89:1522–8. doi: 10.2105/ajph.89.10.1522. [DOI] [PMC free article] [PubMed] [Google Scholar]
- 18.Goodman E, Huang B, Schafer-Kalkhoff T, Adler NE. Perceived socioeconomic status: A new type of identity that influences adolescents’ self-rated health. J Adolesc Health. 2007;41:479–487. doi: 10.1016/j.jadohealth.2007.05.020. [DOI] [PMC free article] [PubMed] [Google Scholar]
- 19.Demakakos P, Nazroo J, Breeze E, Marmot M. Socioeconomic status and health: the role of subjective social status. Soc Sci Med. 2008;67:330–340. doi: 10.1016/j.socscimed.2008.03.038. [DOI] [PMC free article] [PubMed] [Google Scholar]
- 20.Goodman E, Adler NE, Daniels SR, Morrison JA, Slap GB, Dolan LM. Impact of objective and subjective social status on obesity in a biracial cohort of adolescents. Obes Res. 2003;11:1018–1026. doi: 10.1038/oby.2003.140. [DOI] [PubMed] [Google Scholar]
- 21.Goodman E, McEwen BS, Dolan LM, Schafer-Kalkhoff T, Adler NE. Social disadvantage and adolescent stress. J Adolesc Health. 2005;37:484–492. doi: 10.1016/j.jadohealth.2004.11.126. [DOI] [PubMed] [Google Scholar]
- 22.Adler NE, Epel ES, Castellazzo G, Ickovics JR. Relationship of subjective and objective social status with psychological and physiological functioning: preliminary data in healthy white women. Health Psychol. 2000;19:586–92. doi: 10.1037//0278-6133.19.6.586. [DOI] [PubMed] [Google Scholar]
- 23.Leung B, Luo N, So L, Quan H. Comparing three measures of health status (perceived health with Likert-type scale, EQ-5D, and number of chronic conditions) in Chinese and white Canadians. Med Care. 2007;45:610–7. doi: 10.1097/MLR.0b013e3180331f58. [DOI] [PubMed] [Google Scholar]
- 24.Singh-Manoux A, Adler NE, Marmot MG. Subjective social status: its determinants and its association with measures of ill-health in the Whitehall II study. Soc Sci Med. 2003;56:1321–33. doi: 10.1016/s0277-9536(02)00131-4. [DOI] [PubMed] [Google Scholar]
- 25.Ostrove JM, Adler NE, Kuppermann M, Washington AE. Objective and subjective assessments of socioeconomic status and their relationship to self-rated health in an ethnically diverse sample of pregnant women. Health Psychol. 2000;19:613–8. doi: 10.1037//0278-6133.19.6.613. [DOI] [PubMed] [Google Scholar]
- 26.Franzini L, Fernandez-Esquer ME. The association of subjective social status and health in low-income Mexican-origin individuals in Texas. Soc Sci Med. 2006;63:788–804. doi: 10.1016/j.socscimed.2006.01.009. [DOI] [PubMed] [Google Scholar]
- 27.Miyakawa M, Magnusson Hanson LL, Theorell T, Westerlund H. Subjective social status: its determinants and association with health in the Swedish working population (the SLOSH study) Eur J Public Health. 2012;22:593–7. doi: 10.1093/eurpub/ckr064. [DOI] [PubMed] [Google Scholar]
- 28.Goodman E, Adler NE, Kawachi I, Frazier AL, Huang B, Colditz GA. Adolescents’ Perceptions of Social Status: Development and Evaluation of a New Indicator. Pediatrics. 2001;108:e31. doi: 10.1542/peds.108.2.e31. [DOI] [PubMed] [Google Scholar]
- 29.Goodman E, Maxwell S, Malspeis S, Adler NE. Developmental Trajectories of Subjective Social Status. Pediatrics. 2015;136:e633–e640. doi: 10.1542/peds.2015-1300. [DOI] [PMC free article] [PubMed] [Google Scholar]
- 30.Nicklett EJ, Burgard SA. Downward Social Mobility and Major Depressive Episodes Among Latino and Asian-American Immigrants to the United States. Am J Epidemiol. 2009;170:793–801. doi: 10.1093/aje/kwp192. [DOI] [PMC free article] [PubMed] [Google Scholar]
- 31.Piff PK, Kraus MW, Martinez A. The social consequences of a rigged game. Unpublished results. [Google Scholar]
- 32.Stubbs RJ, Hughes DA, Johnstone AM, Rowley E, Reid C, Elia M, Stratton R, Delargy H, King N, Blundell JE. The use of visual analogue scales to assess motivation to eat in human subjects: a review of their reliability and validity with an evaluation of new hand-held computerized systems for temporal tracking of appetite ratings. Br J Nutr. 2000;84:405–415. doi: 10.1017/s0007114500001719. [DOI] [PubMed] [Google Scholar]
- 33.Akyol A, Dasgin H, Ayaz A, Buyuktuncer Z, Besler H. β-Glucan and Dark Chocolate: A Randomized Crossover Study on Short-Term Satiety and Energy Intake. Nutrients. 2014;6:3863. doi: 10.3390/nu6093863. [DOI] [PMC free article] [PubMed] [Google Scholar]
- 34.Mifflin MD, St Jeor ST, Hill LA, Scott BJ, Daugherty SA, Koh YO. A new predictive equation for resting energy expenditure in healthy individuals. Am J Clin Nutr. 1990;51:241–7. doi: 10.1093/ajcn/51.2.241. [DOI] [PubMed] [Google Scholar]
- 35.Grizzle JE. The two-period change-over design and its use in clinical trials. Biometrics. 1965;21:467. [PubMed] [Google Scholar]
- 36.Chowdhury R, Warnakula S, Kunutsor S, Crowe F, Ward HA, Johnson L, Franco OH, Butterworth AS, Forouhi NG, Thompson SG, Khaw K-T, Mozaffarian D, Danesh J, Di Angelantonio E. Association of Dietary, Circulating, and Supplement Fatty Acids With Coronary RiskA Systematic Review and Meta-analysis. Ann Intern Med. 2014;160:398–406. doi: 10.7326/M13-1788. [DOI] [PubMed] [Google Scholar]
- 37.Interim Summary of Conclusions and Dietary Recommendations on Total Fat and Fatty Acids. 2008 Nov 10–14; [Google Scholar]
- 38.U.S Department of Health and Human Services and U.S Department of Agriculture. Dietary Guidelines for Americans. 2015. [Google Scholar]
- 39.Darmon N, Darmon M, Maillot M, Drewnowski A. A Nutrient Density Standard for Vegetables and Fruits: Nutrients per Calorie and Nutrients per Unit Cost. J Am Diet Assoc. 2005;105:1881–7. doi: 10.1016/j.jada.2005.09.005. [DOI] [PubMed] [Google Scholar]
- 40.Maillot M, Darmon N, Darmon M, Lafay L, Drewnowski A. Nutrient-Dense Food Groups Have High Energy Costs: An Econometric Approach to Nutrient Profiling. JNutr. 2007;137:1815–1820. doi: 10.1093/jn/137.7.1815. [DOI] [PubMed] [Google Scholar]
- 41.Oliver G, Wardle J, Gibson EL. Stress and Food Choice: A Laboratory Study. Psychosom Med. 2000;62:853–865. doi: 10.1097/00006842-200011000-00016. [DOI] [PubMed] [Google Scholar]
- 42.Baum A, Garofalo JP, Yali AM. Socioeconomic Status and Chronic Stress: Does Stress Account for SES Effects on Health? Ann N Y Acad Sci. 1999;896:131–144. doi: 10.1111/j.1749-6632.1999.tb08111.x. [DOI] [PubMed] [Google Scholar]
- 43.Yu M, Stiffman AR. Culture and environment as predictors of alcohol abuse/dependence symptoms in American Indian youths. Addict Behav. 2007;32:2253–9. doi: 10.1016/j.addbeh.2007.01.008. [DOI] [PMC free article] [PubMed] [Google Scholar]