

Abstract
Background
Intravascular optical coherence tomography (IVOCT) images are recorded by detecting light backscattered within coronary arteries. We hypothesize that non- thin-capped fibroatheroma (TCFA) etiologies may scatter light to create the false appearance of IVOCT TCFA.
Methods and Results
Ten human cadaver hearts were imaged with IVOCT (N=14 coronary arteries). IVOCT and histologic TCFA images were co-registered and compared. Of 21 IVOCT TCFAs (fibrous cap <65 µm, lipid arc >1 quadrant), only 8 were true histologic TCFA. Foam cell infiltration was responsible for 70% of false IVOCT TCFA and caused both thick-capped fibroatheromas (ThCFAs) to appear as TCFA and the appearance of TCFAs when no lipid core was present. Other false IVOCT TCFA etiologies included SMC-rich fibrous tissue (12%) and loose connective tissue (9%). If the lipid arc >1 quadrant (“obtuse”) criterion was disregarded, 45 IVOCT TCFAs were identified, and sensitivity of IVOCT TCFA detection increased from 63% to 87%, and specificity remained high at 92%.
Conclusions
We demonstrate that IVOCT can exhibit 87% (95% CI 75% to 93%) sensitivity and 92% specificity (95% CI 86% to 96%) to detect all lipid arcs (both obtuse and “acute,” <1 quadrant) TCFA and we also propose new mechanisms involving light scattering that explain why other plaque components can masquerade as TCFA and cause low PPV of IVOCT for TCFA detection (47% for obtuse lipid arcs). Disregarding the lipid arc >1 quadrant requirement enhances the ability of IVOCT to detect TCFA.
Keywords: optical coherence tomography, thin cap fibroatheroma, image interpretation, atherosclerosis
Plaque rupture is responsible for up to 75% of acute coronary syndromes and is an important mechanism for atherosclerotic disease progression. Plaque rupture is most often preceded by development of a thin-capped fibroatheroma (TCFA), the most common type of vulnerable plaque1, 2. Intravascular optical coherence tomography (IVOCT) is the only coronary imaging modality available clinically that has sufficient resolution to identify the thin fibrous cap of a TCFA (<65 µm) overlaying a large lipid core3. While some studies have shown that IVOCT is accurate for imaging TCFA,4–6 other studies have reported the false identification of TCFA with IVOCT. Two studies with histologic validation have been reported that describe superficial foam cell infiltration that causes strong light attenuation and appears as a lipid pool or TCFA.7, 8 Another known mechanism for the false appearance of TCFA is tangential light dropout, which occurs when light emitted from the IVOCT catheter propagates tangential to the luminal wall.3 Similarly, Manfrini et al.9 demonstrated in ex vivo human hearts that only 45% of fibrous cap atheromas were correctly identified by IVOCT due to either low IVOCT signal penetration depth or the inability to distinguish calcium deposits from lipid. Lastly, Fujii et al.10 recently reported only 41% positive predictive value of IVOCT for TCFA identification. These studies suggest the need for a more comprehensive histologic validation of IVOCT identification of TCFAs.
The wavelength of light used for IVOCT imaging of coronary arteries (1310±50 nm) results in images that are created predominantly based on a light scattering mechanism3. Hence, bright regions in IVOCT images are caused by light that is strongly backscattered to the imaging catheter (e.g. fibrous cap) while dark regions (e.g., lipid) correspond to decreased backscattered light returning to the catheter. Light absorption is a minor contributor to IVOCT image contrast in coronary arteries. A decreased light amplitude returning to the catheter can be due to at least two types of mechanisms (Fig 1): Type 1) a superficial overlying highly scattering region (i.e. fibrous tissue containing punctate foam cells, proteoglycans, or SMCs) resulting in decreased backscatter from the underlying tissue, or Type 2) structural regions with decreased light backscattering (i.e. calcium plates and nodules or true lipid pools [Type 2-A], clustered foam cells [Type 2-B], or loose connective tissue [Type 2-C]). Type 1 overlying regions originate from constituents with large index of refraction (IR) gradients. Type 1 regions can also originate when the size of the constituents is within an order of the wavelength of light (approximately 1310 nm for IVOCT). Type 2 regions correspond to structures with relatively small IR gradients or homogeneous constituents with a size that is orders of magnitude greater than the wavelength of light. Thus, one may hypothesize that other constituents of atherosclerotic plaque aside from lipid or necrotic cores may result in decreased light amplitude returning to the IVOCT catheter and false appearance of a TCFA. To test our hypothesis, we performed a histologic study to identify false IVOCT TCFA etiologies and the corresponding light scattering mechanisms.
Figure 1. Type 1 and 2 light scattering mechanisms.

Type 1: high IR gradient and size of plaque constituents within an order of the wavelength of light (1310±40 nm). Type 2: low IR gradient and plaque constituents much larger than the wavelength of light. The side scattering light demonstrated in Type 2-C could occur in any of the other light scattering mechanisms and illustrates why the back edges of these components are not visualized with IVOCT.
Methods
Specimens
Ten human hearts (3 women and 7 men) were acquired through the Southwest Blood & Tissue Center and examined within 24 hours of death. The average age at death was 65 ± 11 years. Six deaths were cardiac related including 4 acute myocardial infarctions. One death was caused by a cerebrovascular event. Evidence of plaque rupture and thrombus was found by both IVOCT and histology in 5 patients. We imaged 14 coronary arteries (n=10, left anterior descending artery [LAD]; n=4 right coronary artery [RCA]). The IRB at the University of Texas approved this study.
Imaging procedure
A human heart catheterization laboratory was recreated with a custom IVOCT system (Volcano Corporation, San Diego, CA) as reported previously11. Briefly, a 1310 nm swept source laser was used to image the LAD and RCA (80 mm pullbacks recorded by 300 IVOCT images). Left and right coronary 6F guide catheters were sewn into the coronary ostia, 0.014 inch guide-wire access to the coronary arteries was gained under fluoroscopic guidance, and a metallic stent was deployed 80 mm from the guide catheter tip as a fiduciary marker. The tissue was maintained at 37°C with a custom-designed imaging chamber. Following imaging, the RCA and LAD were perfusion-fixed with 10% neutral-buffered formalin at 100 mm Hg. The left circumflex artery was not imaged due to its tortuosity in the ex vivo heart.
Histology
The LADs and RCAs were dissected and processed routinely for histology as in a previous study11. Tissue was decalcified overnight with Cal-Rite (Richard Allen Scientific) if necessary. The arteries were sliced into 2–3 mm thick rings and further processed for standard paraffin-embedded sections. An average of 25 rings was generated from each artery. Serial tissue sections (5 µm thick) were cut at 120-µm intervals and stained with hematoxylin and eosin (H&E), modified Movat pentachrome, and Von Kossa. Anti-CD68 (Dako North America, Inc, Carpinteria, CA) and anti-α-SMC-actin (Sigma-Aldrich, St. Louis, MO) antibodies were used in immunohistochemical studies to identify macrophages and SMCs, respectively.
IVOCT and histology co-registration
Each histologic ring was matched to a respective IVOCT image as detailed previously11. Co-registration was performed between IVOCT images and histological sections on the basis of: 1) 2 fiducial landmarks (the sewn-in guide catheter and a distally deployed stent, marking the at the proximal and distal ends of the pullback, respectively) that were visible in IVOCT images, fluoroscopy, and radiography before histopathologic processing; 2) a mathematical calculation based on the physical position of IVOCT images in the pullbacks measured against the estimated distance in microns from the fiducial landmarks in the tissue sections; and c) anatomic landmarks (e.g., arterial branches or calcification patterns) and luminal geometric features when present. Two researchers independently co-registered recorded IVOCT images and histologic sections and any discrepancies were re-examined until agreement between co-registrations was obtained.
TCFA and Thick-capped Fibroatheroma (ThCFA) Categories
TCFAs and ThCFAs were identified by fibrous cap thickness (less than or greater than 65 µm, respectively). TCFAs were categorized by IVOCT as “acute” or “obtuse” by lipid arc less or greater than 1 quadrant, respectively. The lipid arc was measured from the center of the lumen in the IVOCT image. Image segments of all 18 obtuse IVOCT TCFAs and 18 non-IVOCT TCFA image segments randomly selected from the UTHSCSA dataset were mixed together and sent for external review at an independent IVOCT core lab (MGH), which was blinded to the histology. Two experts in coronary artery pathology evaluated all histology sections. Kappa coefficients of inter-rater reliability were calculated for both of the previous analyses. Figure 2 describes the categorization of the five types of lesions identified in this study: true TCFA, ThCFA identified as TCFA (by IVOCT), true ThCFA, false TCFA and false ThCFA.
Figure 2. Flowchart of how each TCFA and ThCFA group was categorized.

Expert IVOCT image readers and two cardiovascular pathologists performed the categorization.
Light scattering mechanisms
To identify additional IVOCT light scattering mechanisms that resulted in the false appearance of lipid, IVOCT images that had fibrous caps <65 µm and lipid arcs of any length were included in our analysis. The current IVOCT working group consensus document3 does not define IVOCT TCFA based on the lipid arc, and accepts lipid arcs <1 quadrant.
Statistical methods
Sensitivity, specificity, positive and negative predictive values and their 95% confidence intervals were calculated by frame by assigning each IVOCT frame a value of true positive, true negative, false positive, or false negative. Continuously distributed outcomes are summarized as mean plus or minus one standard deviation. Estimates and confidence intervals for sensitivity, specificity, positive predictive value, and negative predictive value were based on generalized estimating equation models with a logit link and adjustment for repeated measurements within subject using SAS Version 9.4 (SAS Institute, Cary, North Carolina). TCFAs were categorized by lipid arc: 1) obtuse and 2) “all” (acute and obtuse). Statistical data was generated for both categories of TCFA.
Results
IVOCT TCFA (Tables 1 and 2)
Table 1.
IVOCT and histology measurements of obtuse OCT TCFA (lipid arc >1 quadrant).
| Length (mm) |
Fibrous cap thickness (µm) |
Lipid pool arc (degrees) | ||||
|---|---|---|---|---|---|---|
| IVOCT TCFA |
IVOCT | Histology | IVOCT | Histology | ||
| True TCFA | N | 8 | 8 | 8 | 8 | 8 |
| Mean±SD | 7±4 | 23±21 | 12±11 | 165±58 | 138±71 | |
| Median [Q1,Q3] |
7 [4, 9] | 29 [0, 33] | 13 [0, 20] | 146 [131, 192] |
120 [104, 162] |
|
| Min, Max | 3, 14 | 0, 56 | 0, 27 | 102, 284 | 40, 260 | |
| ThCFA as TCFA |
N | 3 | 3 | 3 | 3 | 3 |
| Mean±SD | 3±1 | 37±21 | 116±12 | 169±22 | 162±29 | |
| Median [Q1,Q3] |
3 [2, 3] | 27 [25, 44] |
119 [111, 122] |
176 [160, 181] |
178 [154, 178] |
|
| Min, Max | 1, 4 | 23, 62 | 103, 126 | 145, 186 | 129, 179 | |
| False TCFA | N | 7 | 7 | NA | 7 | NA |
| Mean±SD | 6±4 | 36±11 | 116±26 | |||
| Median [Q1,Q3] |
5 [5, 6] | 34 [28, 44] |
115 [108, 120] |
|||
| Min, Max | 1, 13 | 21, 51 | 77, 164 | |||
Table 2.
Etiologies of light scattering for the appearance of obtuse OCT TCFA (lipid arc >1 quadrant).
| TCFA | ThCFA as TCFA |
false TCFA |
|
|---|---|---|---|
| Type 1 Etiologies in fibrous tissue* |
|||
| Punctate foam cells | - | 1 | 3 |
| SMC-rich | - | 1 | 0 |
| Type 2 Etiologies* | |||
| Necrotic or lipid core (2-A) | 8 | - | - |
| Clustered foam cells (2-B) | - | 0 | 3 |
| Loose connective tissue (2-C) | - | 0 | 1 |
| IVOCT Imaging Artifacts | |||
| Tangential light drop-out | - | 1 | 0 |
See Figure 1
N=18 obtuse IVOCT TCFA were identified: 8 (44%) were true TCFA, 3 (17%) were ThCFA that appeared as TCFA and 7 (39%) were false TCFA. Length, fibrous cap thickness, and lipid pool arc are summarized by IVOCT TCFA (True TCFA, ThCFA as TCFA, False TCFA) in Table 1. Figure 3 demonstrates an example of a lesion characterized as a true TCFA. False TCFAs were caused by many etiologies (see Table 2) including: clusters of foam cells (Fig 4) and loose connective tissue (Fig 5).
Figure 3. True IVOCT TCFA (type 2 light scattering).
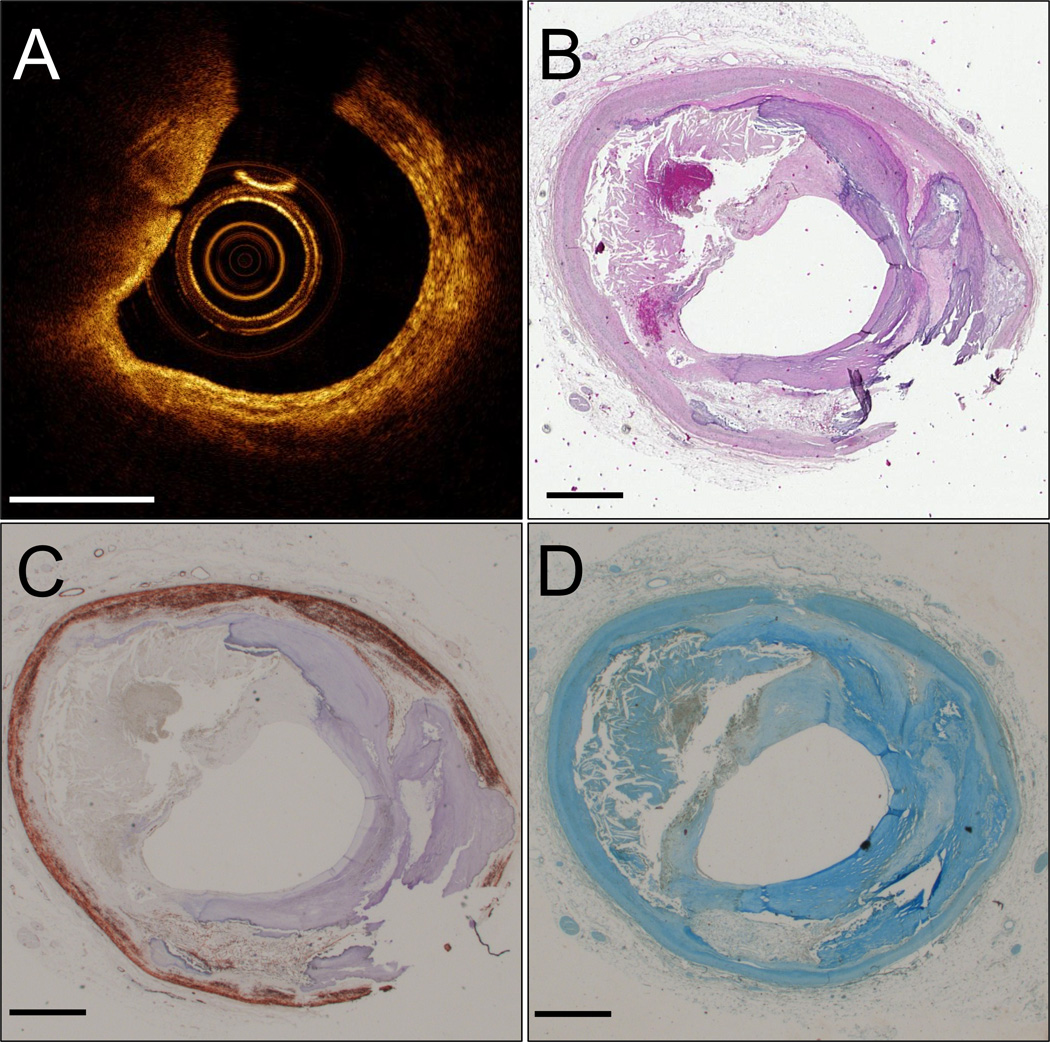
IVOCT image (A). H&E histology section (B). Movat pentachrome (C). CD68+ macrophages (D). A rupture can be seen in the fibrous cap at 9 o’clock. Scale bars are 1 mm.
Figure 4. Superficial clustered foam cells caused a false IVOCT TCFA (type 2B light scattering).
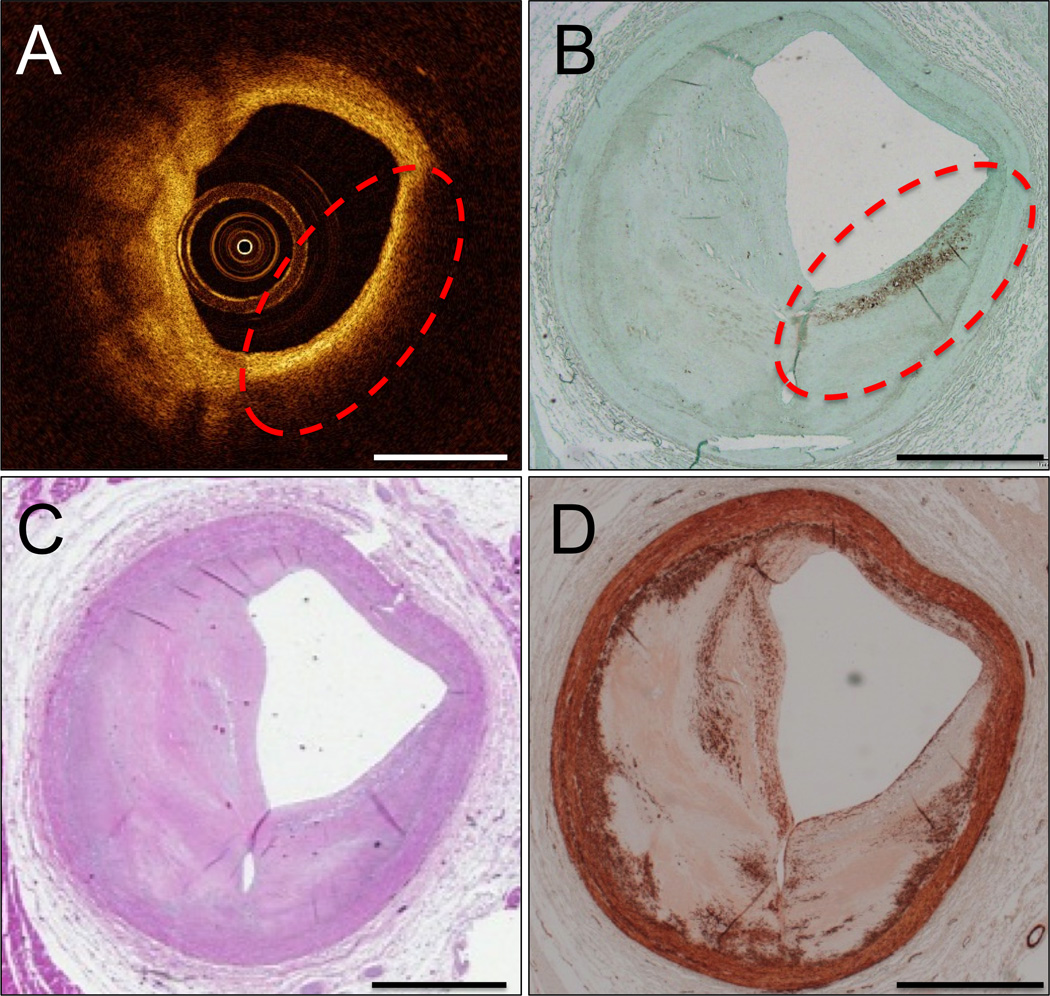
IVOCT image with false IVOCT TCFA outlined in red dashes (A). CD68 immunohistochemistry (B) shows that a long superficial cluster of foam cells inside the red dashed circle are responsible for the increased light scattering that causes the appearance of the TCFA in (A). H&E stain (C). α-SMA immunohistochemistry (D). Scale bars are 1 mm.
Figure 5. Loose connective tissue caused a false IVOCT TCFA (type 2 light scattering).

IVOCT image with false TCFA outlined with red dashes (A). H&E stain shows loose connective tissue and ground substance is responsible for the increased light scattering in this region (B). CD68 immunohistochemistry is negative for macrophages (C). Movat pentachrome stain shows loose collagen in the region of interest (D). Scale bars are 1 mm.
Light scattering mechanisms (Table 3)
Table 3.
Etiologies of light scattering for the appearance of IVOCT TCFA and IVOCT ThCFA (all lipid arc angles).
| TCFA | ThCFA as TCFA |
false TCFA |
ThCFA | false ThCFA |
|
|---|---|---|---|---|---|
| Type 1 Etiologies in fibrous tissue* |
|||||
| Punctate foam cells | - | 2 | 3 | - | 4 |
| Proteoglycans | - | 0 | 3 | - | 0 |
| SMC-rich | - | 1 | 3 | - | 1 |
| Type 2 Etiologies* | |||||
| Necrotic or lipid core (2-A) | 12 | - | - | 9 | - |
| Extracellular lipid (2-B) | - | 1 | 2 | - | 0 |
| Clustered foam cells (2-B) | - | 2 | 5 | - | 1 |
| Calcium plates (2-A) | - | 1 | 3 | - | 2 |
| Calcified nodule (2-A) | - | 0 | 1 | - | 0 |
| Loose connective tissue (2-C) | - | 0 | 3 | - | 1 |
| IVOCT Imaging Artifacts | |||||
| Tangential light drop-out | - | 1 | 2 | - | 0 |
See Figure 1
Sixty-three IVOCT fibroatheromas (45 IVOCT TCFAs and 18 IVOCT ThCFAs) of any lipid arc angle (obtuse and acute) were included for analysis. N=45 IVOCT TCFAs were identified: 12 (27%) were true TCFA, 8 (18%) were ThCFA that appeared as TCFA and 25 (56%) were false TCFA. N=18 IVOCT ThCFAs were identified: 9 (50%) were true ThCFA and 9 (50%) were false ThCFA. The histologic etiologies associated with each true or false IVOCT TCFA or IVOCT ThCFA are summarized in Table 3. Examples of false TCFA include hypocellular and proteoglycan-rich regions (Fig 6), SMC-rich fibrous tissue (Fig 7), and a calcified nodule (Fig 8).
Figure 6. Proteoglycans caused a <1 quadrant false IVOCT TCFA (type 1 light scattering).

IVOCT image with false TCFA outlined with red dashes (A). H&E stain demonstrates that this area is hypocellular (B); α-SMA shows SMC loss (C) and CD68 immunohistochemistry is negative (D). Movat pentachrome stain shows proteoglycans superficially in the region of the false TCFA (E). Scale bars are 1 mm.
Figure 7. Smooth muscle cell rich fibrous tissue caused a <1 quadrant false IVOCT TCFA (type 1 light scattering).

IVOCT image with false TCFA outlined in red dashes (A). H&E stain shows cellular fibrous tissue in the bright arc of tissue before the light attenuates within the red dashed region (B). CD68 immunohistochemistry shows that this region is negative for macrophages (C). α-SMA immunohistochemistry shows dense smooth muscle cells (SMCs) in the region of bright tissue (D). Scale bars are 1 mm.
Figure 8. Calcified nodule caused a <1 quadrant false IVOCT TCFA (type 2 light scattering).

IVOCT image with a shadowed region with diffuse borders, indicative of lipid (A). H&E stain shows a calcified nodule that appears in (A) as a lipid pool (B). Scale bars are 1 mm.
Accuracy
Sensitivity, specificity, positive and negative predictive values for IVOCT TCFA detection are summarized in Table 4 by lipid arc (all and obtuse). Sensitivity was numerically increased for all angles relative to obtuse (all 87%, obtuse 63%) and specificities were similar (all 92%, obtuse 96%) whereas PPV was decreased for all angles relative to obtuse (all 37%, obtuse 47%) and NPVs were similar (all 99%, obtuse 98%). The Kappa coefficient for the inter-rater reliability test between the 2 IVOCT corelabs (MGH and UTHSCSA) for how well the classifications of TCFA and non-TCFA agreed in the 36 segments of IVOCT images was 0.83 with 95% confidence interval 0.66 to 1.0. The Kappa coefficient for how well the 2 expert pathologists agreed in their assessment of the histology classification of TCFA was 0.82 with 95% confidence interval of 0.70 to 0.95. Any discrepancies between IVOCT corelabs or pathologists were solved by consensus agreement.
Table 4.
TCFA by histology and OCT by angle (all, obtuse)
| Angle | ||||||
|---|---|---|---|---|---|---|
| All | Histology | |||||
| yes | no | |||||
| OCT | yes | 302 | 514 | 816 | ||
| no | 47 | 6327 | 6374 | |||
| 349 | 6841 | 7190 | ||||
| Sensitivity=0.87, 95% CI (0.748, 0.933) | ||||||
| Specificity=0.92, 95% CI (0.859, 0.961) | ||||||
| PPV=0.37, 95% CI (0.188, 0.599) | ||||||
| NPV=0.99, 95% CI (0.973, 0.998) | ||||||
| Obtuse | ||||||
| Histology | ||||||
| yes | no | |||||
| OCT | yes | 219 | 245 | 464 | ||
| no | 130 | 6596 | 6726 | |||
| 349 | 6841 | 7190 | ||||
| Sensitivity=0.63, 95% CI (0.530, 0.716) | ||||||
| Specificity=0.96, 95% CI (0.932, 0.981) | ||||||
| PPV=0.47, 95% CI (0.287, 0.665) | ||||||
| NPV=0.98, 95% CI (0.934, 0.995) | ||||||
Discussion
New mechanisms for the appearance of false IVOCT TCFA are identified including SMCs in the fibrous cap and loose connective tissue being mistaken for the lipid core. Foam cell accumulation in the fibrous cap has previously been reported to cause the appearance of false TCFA3, 7, 8, 10. Newly described are the importance of histologic ThCFA that appear as IVOCT TCFA, and the false IVOCT appearance of a lipid core under a thick fibrous cap when no histologic ThCFA is present – both due primarily to infiltration of foam cells.
We found that the most common mechanisms for the false appearance of IVOCT TCFA and IVOCT ThCFA were punctate or clustered foam cells. Although previous reports suggest that superficial foam cell infiltration may cause the appearance of TCFA7, 8, the high frequency with which this occurs is an important finding of this study and confirms the findings of Fujii et al10. Since atherosclerosis is an inflammatory disease, the high prevalence of foamy macrophages in our samples was expected. Foam cells can cause the appearance of false TCFA by either Type 1 or 2 mechanisms (Fig 1). If the foam cells are punctate in the fibrous cap, they will introduce a large IR gradient and thus Type 1 light scattering. If foam cells are concentrated and homogenously distributed, they can appear as a lipid pool with Type 2 light scattering. Additionally, foam cell infiltration can cause a plaque to appear as a ThCFA when no lipid or necrotic core is present, as identified in 5 out of 9 examples (N=4 from punctate foam cells and N=1 from clustered foam cells).
Many true histologic TCFA were missed by IVOCT with the requirement that more than one quadrant contain lipid (N=4). Further, no consensus has been met about how many quadrants of an IVOCT image (or the lipid arc) should be dark to be considered a TCFA3. Our results argue against an IVOCT requirement of more than one quadrant to define a TCFA. Of 12 true TCFAs, 8 had lipid cores that extended over 1 quadrant by IVOCT, 10 had lipid cores that extended over 1 quadrant by histology, and 7 were greater than 1 quadrant by both IVOCT and histology. In fact, our sensitivity increased from 63% to 87% by categorizing all lipid arcs as TCFAs instead of only including obtuse lipid arcs. Further validation of the number of IVOCT defined quadrants or lipid pool arc should be investigated to determine a more accurate definition of IVOCT identified TCFA. Arc measurements taken with IVOCT images may underestimate the histologic angles due to the shallow penetration depth of IVOCT, especially in eccentric plaques. For example, if a lipid core exists in the IVOCT imaged volume of tissue but extends further around the circumference of the vessel at a depth not visible by IVOCT, the same lipid core would be larger in histology than as measured by IVOCT.
A review of the literature indicates that IVOCT and IVUS can in some studies detect TCFA more frequently than present in histology. Supplemental Figure 1 summarizes TCFA frequency per coronary artery length from 14 studies in the literature that count TCFAs with IVOCT, IVUS or histology10, 12–24. Average values for IVOCT, IVUS, and histologic TCFA frequencies are 0.99±1.14, 0.81±0.53 and 0.45±0.08 TCFA per 10 cm length of coronary artery, respectively (see blue squares in Supplemental Figure 1). Supplemental Figure 1 suggests a tendency for invasive imaging to overestimate TCFA frequency compared to histology, consistent with the results of our study. Further, the discrepancies between IVOCT and histologic TCFA studies could be due to the high false positive rate of IVOCT for detecting TCFA as demonstrated in this study. Further studies are needed to resolve these apparent discrepancies.
Lipid will generally appear dark in IVOCT images—whether foam cell accumulations, early lesions with extracellular lipid or advanced lesions with necrotic cores10. Lipid is sometimes described as dark in IVOCT images because it absorbs incident light. A more detailed examination of the optical properties of lipid demonstrate, however, that the absorption coefficient (that determines how much light is absorbed) is relatively small for lipid25, and all plaque constituents in general26, at the wavelengths used by IVOCT (1310±50 nm). Additionally at this wavelength, the scattering coefficients (that determine how much light is scattered) for all constituents in the arteries are much larger than the absorption coefficients8, 26. Thus, we suggest lipid is dark in IVOCT images due to a type 2A light scattering mechanism that is caused by homogenous pools of lipid with little variation in IR rather than due to lipid absorbing incident IVOCT light. Indeed, any regions of homogenous plaque components with little variation in IR will appear dark in IVOCT images predominantly due to reduced light backscattering and not increased absorption.
To gain a better understanding regarding the natural history of TCFAs (e.g. why some rupture and others thicken, and how pharmaceutical agents interact with TCFAs) an in vivo imaging system is needed that can improve the limited PPV identified in the current study. One possibility is to couple a second imaging modality with IVOCT—for instance: intravascular ultrasound10, 27, fluorescence lifetime imaging microscopy28, near infrared fluorescence29, spectral OCT30 or two-photon luminescence (TPL)31, 32. TPL is an interesting candidate having the ability to image the actual molecular composition of plaque without the use of exogenous contrast agents. For instance, TPL confirmation of the absence of lipid in our TCFA database could have increased PPV to 55% (data not shown). Thus, these multi-modal imaging systems all have the advantage of higher PPV over IVOCT alone and may be able to better differentiate between true and false TCFA by specifically identifying the presence or absence of lipid pools.
Limitations
The results from this small subset of hearts should be validated by a larger study to confirm and expand upon the mechanisms of light drop-out that appear as TCFAs. Histologic co-registration is inherently difficult with imaging studies and the histologic sections are 5-µm thick compared to the 267-µm pitch in IVOCT images. However, the fine serial sectioning of every 120 µm used in the current study greatly improved the accuracy of co-registration. Also, distortions due to histologic processing are always possible sources of error in co-registration and IVOCT image interpretation. Lastly, the imaging system we used was from Volcano Corporation, which is not currently clinically available. The optics in the Volcano system are similar to current clinically available systems, however, and thus the results will be applicable to other IVOCT imaging platforms.
Supplementary Material
What is known
Intravascular optical coherence tomography (IVOCT) is the only clinical technique capable of imaging the thin fibrous cap of the thin cap fibroatheroma (TCFA), but image artifacts can cause IVOCT images to falsely appear as TCFAs, such as superficial macrophage infiltration and tangential light drop-out.
What this study adds
This study characterizes intramural components that cause IVOCT images to falsely display TCFAs, the absence of which is proven by rigorous histologic analysis, and proposes new light scattering mechanisms for the appearance of these false positives.
We demonstrate that IVOCT can exhibit 85% sensitivity and 93% specificity for identification of TCFA and also explain the low positive predictive value for IVOCT TCFA detection in our own study, consistent with others in the literature.
In a cohort of N=14 human coronary arteries, we quantify the frequency of several false TCFA etiologies that include: superficial macrophages, tangential light drop-out, loose connective tissue, punctate foam cells and smooth muscle cell infiltration of the fibrous cap.
Sensitivity for IVOCT TCFA detection can be increased if lipid arc lengths less than 1 quadrant are also considered TCFA—however, since this decreases further the positive predictive value and specificity of IVOCT TCFA detection, we suggest that IVOCT TCFA definitions should be further studied and clarified, perhaps even with the addition of new imaging modalities more specific to the presence of lipid in the arteries, such as fluorescence lifetime imaging or two-photon luminescence.
Acknowledgments
Sources of Funding: The Veterans Health Administration Merit Grant I01 BX000397. The Clayton Foundation, Houston, TX. Janey and Dolph Briscoe Division of Cardiology, San Antonio, TX. NIH T32 HL007446. American Heart Association 13POST17080074. The Biomedical Engineering Advancement fund at the University of Texas at Austin.
Footnotes
Portions of this study won the Best Clinical Poster Award at Optics in Cardiology, Rotterdam, Netherlands, March 2015.
Disclosures: None.
References
- 1.Narula J, Nakano M, Virmani R, Kolodgie FD, Petersen R, Newcomb R, Malik S, Fuster V, Finn AV. Histopathologic characteristics of atherosclerotic coronary disease and implications of the findings for the invasive and noninvasive detection of vulnerable plaques. J Am Coll Cardiol. 2013;61:1041–1051. doi: 10.1016/j.jacc.2012.10.054. [DOI] [PMC free article] [PubMed] [Google Scholar]
- 2.Virmani R, Burke AP, Farb A, Kolodgie FD. Pathology of the vulnerable plaque. J Am Coll Cardiol. 2006;47:C13–C18. doi: 10.1016/j.jacc.2005.10.065. [DOI] [PubMed] [Google Scholar]
- 3.Tearney GJ, Regar E, Akasaka T, Adriaenssens T, Barlis P, Bezerra HG, Bouma B, Bruining N, Cho JM, Chowdhary S, Costa MA, de Silva R, Dijkstra J, Di Mario C, Dudek D, Falk E, Feldman MD, Fitzgerald P, Garcia-Garcia HM, Gonzalo N, Granada JF, Guagliumi G, Holm NR, Honda Y, Ikeno F, Kawasaki M, Kochman J, Koltowski L, Kubo T, Kume T, Kyono H, Lam CC, Lamouche G, Lee DP, Leon MB, Maehara A, Manfrini O, Mintz GS, Mizuno K, Morel MA, Nadkarni S, Okura H, Otake H, Pietrasik A, Prati F, Raber L, Radu MD, Rieber J, Riga M, Rollins A, Rosenberg M, Sirbu V, Serruys PW, Shimada K, Shinke T, Shite J, Siegel E, Sonoda S, Suter M, Takarada S, Tanaka A, Terashima M, Thim T, Uemura S, Ughi GJ, van Beusekom HM, van der Steen AF, van Es GA, van Soest G, Virmani R, Waxman S, Weissman NJ, Weisz G. Consensus standards for acquisition, measurement, and reporting of intravascular optical coherence tomography studies: a report from the International Working Group for Intravascular Optical Coherence Tomography Standardization and Validation. J Am Coll Cardiology. 2012;59:1058–1072. doi: 10.1016/j.jacc.2011.09.079. [DOI] [PubMed] [Google Scholar]
- 4.Jang IK, Tearney GJ, MacNeill B, Takano M, Moselewski F, Iftima N, Shishkov M, Houser S, Aretz HT, Halpern EF, Bouma BE. In vivo characterization of coronary atherosclerotic plaque by use of optical coherence tomography. Circulation. 2005;111:1551–1555. doi: 10.1161/01.CIR.0000159354.43778.69. [DOI] [PMC free article] [PubMed] [Google Scholar]
- 5.Kubo T, Imanishi T, Takarada S, Kuroi A, Ueno S, Yamano T, Tanimoto T, Matsuo Y, Masho T, Kitabata H, Tsuda K, Tomobuchi Y, Akasaka T. Assessment of culprit lesion morphology in acute myocardial infarction: ability of optical coherence tomography compared with intravascular ultrasound and coronary angioscopy. J Am Coll Cardiol. 2007;50:933–939. doi: 10.1016/j.jacc.2007.04.082. [DOI] [PubMed] [Google Scholar]
- 6.Regar E, van Soest G, Bruining N, Constantinescu AA, van Geuns RJ, van der Giessen W, Serruys PW. Optical coherence tomography in patients with acute coronary syndrome. EuroIntervention. 2010;6(Suppl G):G154–G160. [PubMed] [Google Scholar]
- 7.van Soest G, Regar E, Goderie TP, Gonzalo N, Koljenovic S, van Leenders GJ, Serruys PW, van der Steen AF. Pitfalls in plaque characterization by OCT: image artifacts in native coronary arteries. J Am Coll Cardiol Img. 2011;4:810–813. doi: 10.1016/j.jcmg.2011.01.022. [DOI] [PubMed] [Google Scholar]
- 8.van Soest G, Goderie T, Regar E, Koljenovic S, van Leenders GL, Gonzalo N, van Noorden S, Okamura T, Bouma BE, Tearney GJ, Oosterhuis JW, Serruys PW, van der Steen AF. Atherosclerotic tissue characterization in vivo by optical coherence tomography attenuation imaging. J Biomed Opt. 2010;15:011105. doi: 10.1117/1.3280271. [DOI] [PubMed] [Google Scholar]
- 9.Manfrini O, Mont E, Leone O, Arbustini E, Eusebi V, Virmani R, Bugiardini R. Sources of error and interpretation of plaque morphology by optical coherence tomography. Am J Cardiol. 2006;98:156–159. doi: 10.1016/j.amjcard.2006.01.097. [DOI] [PubMed] [Google Scholar]
- 10.Fujii K, Hao H, Shibuya M, Imanaka T, Fukunaga M, Miki K, Tamaru H, Sawada H, Naito Y, Ohyanagi M, Hirota S, Masuyama T. Accuracy of OCT, Grayscale IVUS, and Their Combination for the Diagnosis of Coronary TCFA: An Ex Vivo Validation Study. J Am Coll Cardiol Img. 2015;8:451–460. doi: 10.1016/j.jcmg.2014.10.015. [DOI] [PubMed] [Google Scholar]
- 11.Phipps JE, Vela D, Hoyt T, Halaney DL, Mancuso JJ, Buja LM, Asmis R, Milner TE, Feldman MD. Macrophages and Intravascular OCT Bright Spots: A Quantitative Study. J Am Coll Cardiol Img. 2015;8:63–72. doi: 10.1016/j.jcmg.2014.07.027. [DOI] [PMC free article] [PubMed] [Google Scholar]
- 12.Cheng JM, Garcia-Garcia HM, de Boer SP, Kardys I, Heo JH, Akkerhuis KM, Oemrawsingh RM, van Domburg RT, Ligthart J, Witberg KT, Regar E, Serruys PW, van Geuns RJ, Boersma E. In vivo detection of high-risk coronary plaques by radiofrequency intravascular ultrasound and cardiovascular outcome: results of the ATHEROREMO-IVUS study. Eur Heart J. 2014;35:639–647. doi: 10.1093/eurheartj/eht484. [DOI] [PubMed] [Google Scholar]
- 13.Cheruvu PK, Finn AV, Gardner C, Caplan J, Goldstein J, Stone GW, Virmani R, Muller JE. Frequency and distribution of thin-cap fibroatheroma and ruptured plaques in human coronary arteries: a pathologic study. J Am Coll Cardiol. 2007;50:940–949. doi: 10.1016/j.jacc.2007.04.086. [DOI] [PubMed] [Google Scholar]
- 14.Fujii K, Kawasaki D, Masutani M, Okumura T, Akagami T, Sakoda T, Tsujino T, Ohyanagi M, Masuyama T. OCT assessment of thin-cap fibroatheroma distribution in native coronary arteries. J Am Coll Cardiol Img. 2010;3:168–175. doi: 10.1016/j.jcmg.2009.11.004. [DOI] [PubMed] [Google Scholar]
- 15.Hong MK, Mintz GS, Lee CW, Lee JW, Park JH, Park DW, Lee SW, Kim YH, Cheong SS, Kim JJ, Park SW, Park SJ. A three-vessel virtual histology intravascular ultrasound analysis of frequency and distribution of thin-cap fibroatheromas in patients with acute coronary syndrome or stable angina pectoris. Am J Cardiol. 2008;101:568–572. doi: 10.1016/j.amjcard.2007.09.113. [DOI] [PubMed] [Google Scholar]
- 16.Kubo T, Maehara A, Mintz GS, Doi H, Tsujita K, Choi SY, Katoh O, Nasu K, Koenig A, Pieper M, Rogers JH, Wijns W, Bose D, Margolis MP, Moses JW, Stone GW, Leon MB. The dynamic nature of coronary artery lesion morphology assessed by serial virtual histology intravascular ultrasound tissue characterization. J Am Coll Cardiol. 2010;55:1590–1597. doi: 10.1016/j.jacc.2009.07.078. [DOI] [PubMed] [Google Scholar]
- 17.Kume T, Okura H, Yamada R, Kawamoto T, Watanabe N, Neishi Y, Sadahira Y, Akasaka T, Yoshida K. Frequency and spatial distribution of thin-cap fibroatheroma assessed by 3-vessel intravascular ultrasound and optical coherence tomography: an ex vivo validation and an initial in vivo feasibility study. Circ J. 2009;73:1086–1091. doi: 10.1253/circj.cj-08-0733. [DOI] [PubMed] [Google Scholar]
- 18.Rathore S, Terashima M, Matsuo H, Kinoshita Y, Kimura M, Tsuchikane E, Nasu K, Ehara M, Asakura Y, Katoh O, Suzuki T. In-vivo detection of the frequency and distribution of thin-cap fibroatheroma and ruptured plaques in patients with coronary artery disease: an optical coherence tomographic study. Coron Artery Dis. 2011;22:64–72. doi: 10.1097/MCA.0b013e32833e1c36. [DOI] [PubMed] [Google Scholar]
- 19.Sawada T, Shite J, Garcia-Garcia HM, Shinke T, Watanabe S, Otake H, Matsumoto D, Tanino Y, Ogasawara D, Kawamori H, Kato H, Miyoshi N, Yokoyama M, Serruys PW, Hirata K. Feasibility of combined use of intravascular ultrasound radiofrequency data analysis and optical coherence tomography for detecting thin-cap fibroatheroma. Eur Heart J. 2008;29:1136–1146. doi: 10.1093/eurheartj/ehn132. [DOI] [PubMed] [Google Scholar]
- 20.Sawada T, Shite J, Shinke T, Otake H, Tanino Y, Ogasawara D, Kawamori H, Kato H, Miyoshi N, Yoshino N, Kozuki A, Hirata K. Low plasma adiponectin levels are associated with presence of thin-cap fibroatheroma in men with stable coronary artery disease. Int J Cardiol. 2010;142:250–256. doi: 10.1016/j.ijcard.2008.12.216. [DOI] [PubMed] [Google Scholar]
- 21.Stone GW, Maehara A, Lansky AJ, de Bruyne B, Cristea E, Mintz GS, Mehran R, McPherson J, Farhat N, Marso SP, Parise H, Templin B, White R, Zhang Z, Serruys PW Investigators P. A prospective natural-history study of coronary atherosclerosis. New Engl J Med. 2011;364:226–235. doi: 10.1056/NEJMoa1002358. [DOI] [PubMed] [Google Scholar]
- 22.Tanaka A, Imanishi T, Kitabata H, Kubo T, Takarada S, Kataiwa H, Kuroi A, Tsujioka H, Tanimoto T, Nakamura N, Mizukoshi M, Hirata K, Akasaka T. Distribution and frequency of thin-capped fibroatheromas and ruptured plaques in the entire culprit coronary artery in patients with acute coronary syndrome as determined by optical coherence tomography. American J Cardiol. 2008;102:975–979. doi: 10.1016/j.amjcard.2008.05.062. [DOI] [PubMed] [Google Scholar]
- 23.Tian J, Dauerman H, Toma C, Samady H, Itoh T, Kuramitsu S, Domei T, Jia H, Vergallo R, Soeda T, Hu S, Minami Y, Lee H, Yu B, Jang IK. Prevalence and characteristics of TCFA and degree of coronary artery stenosis: an OCT, IVUS, and angiographic study. J Am Coll Cardiol. 2014;64:672–680. doi: 10.1016/j.jacc.2014.05.052. [DOI] [PubMed] [Google Scholar]
- 24.Tian J, Ren X, Vergallo R, Xing L, Yu H, Jia H, Soeda T, McNulty I, Hu S, Lee H, Yu B, Jang IK. Distinct morphological features of ruptured culprit plaque for acute coronary events compared to those with silent rupture and thin-cap fibroatheroma: a combined optical coherence tomography and intravascular ultrasound study. J Am Coll Cardiol. 2014;63:2209–2216. doi: 10.1016/j.jacc.2014.01.061. [DOI] [PubMed] [Google Scholar]
- 25.Tsai C-L, Chen J-C, Wang W-J. Near-infrared absorption property of biological soft tissue constituents. J Med Biol Eng. 2001;21:7–14. [Google Scholar]
- 26.Keijzer M, Richards-Kortum RR, Jacques SL, Feld MS. Fluorescence spectroscopy of turbid media: Autofluorescence of the human aorta. Appl Opt. 1989;28:4286–4292. doi: 10.1364/AO.28.004286. [DOI] [PubMed] [Google Scholar]
- 27.Li X, Li J, Jing J, Ma T, Liang S, Zhang J, Mohar D, Raney A, Mahon S, Brenner M, Patel P, Shung KK, Zhou Q, Chen Z. Integrated IVUS-OCT Imaging for Atherosclerotic Plaque Characterization. IEEE J Sel Top Quantum Electron. 2014;20:7100108. doi: 10.1109/JSTQE.2013.2274724. [DOI] [PMC free article] [PubMed] [Google Scholar]
- 28.Park J, Jo JA, Shrestha S, Pande P, Wan Q, Applegate BE. A dual-modality optical coherence tomography and fluorescence lifetime imaging microscopy system for simultaneous morphological and biochemical tissue characterization. Biomed Opt Express. 2010;1:186–200. doi: 10.1364/BOE.1.000186. [DOI] [PMC free article] [PubMed] [Google Scholar]
- 29.Yoo H, Kim JW, Shishkov M, Namati E, Morse T, Shubochkin R, McCarthy JR, Ntziachristos V, Bouma BE, Jaffer FA, Tearney GJ. Intra-arterial catheter for simultaneous microstructural and molecular imaging in vivo. Nat Med. 2011;17:1680–1684. doi: 10.1038/nm.2555. [DOI] [PMC free article] [PubMed] [Google Scholar]
- 30.Fleming CP, Eckert J, Halpern EF, Gardecki JA, Tearney GJ. Depth resolved detection of lipid using spectroscopic optical coherence tomography. Biomed Opt Express. 2013;4:1269–1284. doi: 10.1364/BOE.4.001269. [DOI] [PMC free article] [PubMed] [Google Scholar]
- 31.Wang T, McElroy A, Halaney DL, Vela D, Fung E, Hossain S, Phipps JE, Wang B, Yin B, Feldman MD, Milner TE. Dual-modality fiber-based OCT-TPL imaging system for simultaneous microstructural and molecular analysis of atherosclerotic plaques. Biomed Opt Express. 2015;6:1665–1678. doi: 10.1364/BOE.6.001665. [DOI] [PMC free article] [PubMed] [Google Scholar]
- 32.Wang T, McElroy A, Halaney D, Vela D, Fung E, Hossain S, Phipps J, Wang B, Yin B, Feldman MD, Milner TE. Detection of plaque structure and composition using OCT combined with two-photon luminescence (TPL) imaging. Lasers Surg Med. 2015;47:485–494. doi: 10.1002/lsm.22366. [DOI] [PubMed] [Google Scholar]
Associated Data
This section collects any data citations, data availability statements, or supplementary materials included in this article.