

Summary
Penicillium expansum, the causal agent of blue mould rot, is a critical health concern because of the production of the mycotoxin patulin in colonized apple fruit tissue. Although patulin is produced by many Penicillium species, the factor(s) activating its biosynthesis are not clear. Sucrose, a key sugar component of apple fruit, was found to modulate patulin accumulation in a dose‐responsive pattern. An increase in sucrose culture amendment from 15 to 175 mm decreased both patulin accumulation and expression of the global regulator laeA by 175‐ and five‐fold, respectively, whilst increasing expression of the carbon catabolite repressor creA. LaeA was found to regulate several secondary metabolite genes, including the patulin gene cluster and concomitant patulin synthesis in vitro. Virulence studies of ΔlaeA mutants of two geographically distant P. expansum isolates (Pe‐21 from Israel and Pe‐T01 from China) showed differential reduction in disease severity in freshly harvested fruit, ranging from no reduction for Ch‐Pe‐T01 strains to 15%–25% reduction for both strains in mature fruit, with the ΔlaeA strains of Is‐Pe‐21 always showing a greater loss in virulence. The results suggest the importance of abiotic factors in LaeA regulation of patulin and other secondary metabolites that contribute to pathogenicity.
Keywords: mycotoxin, pathogenicity, patulin, Penicillium, sucrose
Introduction
Penicillium expansum is a destructive phytopathogen, causing decay in many deciduous fruits during post‐harvest handling and storage (Barkai‐Golan, 2001; Prusky et al., 2004). The fungus produces large amounts of the secondary metabolite patulin, a relatively non‐complex lactone (C7H6O4). Patulin is produced by several species belonging to the genera Penicillium, Aspergillus, Paecilomyces and Byssochlamys (Puel et al., 2010). However, P. expansum is generally regarded as the major producer of patulin (McKinley and Carlton, 1991; Pitt et al., 2009). Apple juice and other derived fruit products infected by P. expansum are the major sources of patulin contamination. Long‐term exposure to patulin‐contaminated fruit juices can cause serious health disorders, as patulin has severe acute and chronic effects on human health (Wouters and Speijers, 1996), and is believed to be mutagenic, neurotoxic, genotoxic and immunotoxic to animals (Moake et al., 2005).
Several environmental conditions, such as temperature, ambient pH, water activity, carbon and nitrogen sources, may regulate the biosynthesis of mycotoxins in many filamentous fungi, including P. expansum (Georgianna and Payne, 2009; Schmidt‐Heydt et al., 2008). Recently, Zong et al. (2015) suggested that carbon sources in defined media could strongly influence patulin production in P. expansum. Using a single concentration (10 g/L), they concluded that sugars, in particular maltose, glucose, fructose, mannose and sucrose, are favourable carbon sources for patulin biosynthesis (Zong et al., 2015). However, in general, glucose and disaccharides containing glucose, such as sucrose, are thought to repress fungal secondary metabolism through carbon catabolite repression (Drew and Demain, 1977; Ruiz et al., 2010), a process regulated by the transcription factor CreA. Previous work has demonstrated a role for CreA in repression of the synthesis of the secondary metabolite penicillin in Penicillium chrysogenum (Cepeda‐García et al., 2014) and Aspergillus nidulans (Espeso and Peñalva, 1992).
Although a significant amount of work has been carried out to understand the factors that modulate patulin accumulation in vitro (Zong et al., 2015), the factors modulating its accumulation in vivo are less clear. Changes in sugar content as apples mature have been widely reported (Hulme, 1971). The main sugars included in values of the total soluble solids (TSS) are glucose, sucrose, fructose and sorbitol. About 45% of the sugar in apple fruit is sucrose, 54% for sucrose and glucose together (Hecke et al., 2006). Despite the importance of sugar content in apples for fruit maturity, no studies have thoroughly examined its relationship to the mechanism of activation of patulin synthesis.
The gene cluster responsible for patulin biosynthesis in P. expansum has been characterized recently (Ballester et al., 2015; Li et al., 2015; Tannous et al., 2014). The cluster includes 15 genes (patA–patO); of these, patL encodes a putative pathway‐specific transcription factor and patK encodes a polyketide synthase (PKS), the key enzyme catalysing the first step of patulin biosynthesis (Li et al., 2015; Puel et al., 2010). Zong et al. (2015) and Tannous et al. (2014) showed that expression of most of the pat genes is positively associated with patulin production under favourable carbon and nitrogen sources and other permissive conditions (Tannous et al., 2014; Zong et al., 2015). Apart from PatL regulation of the patulin gene cluster, little is known about what activates the expression of this cluster and subsequent patulin production. Many studies have shown that global transcription factors are involved in the regulation of secondary metabolite biosynthesis in filamentous fungi, most predominantly LaeA. This transcription factor was first identified in A. nidulans, but is now known to be conserved in all filamentous Ascomycetes (Bok and Keller, 2004; Jain and Keller, 2013). To date, LaeA has been found to be a positive regulator of the most common mycotoxins, including sterigmatocystin (Bok and Keller, 2004), aflatoxin (Kale et al., 2008), fumonisin (Butchko et al., 2012), cyclopiazonic acid (Georgianna et al., 2010), trichothecenes (Kim et al., 2013), citrinin (Liu et al., 2016) and ochratoxin (Crespo‐Sempere et al., 2013).
Here, we characterize the importance of LaeA in regulating the synthesis of the mycotoxin patulin produced by P. expansum during the colonization of apples, and the role of sucrose, a key nutritional factor present in apple fruit, as a negative regulator of laeA expression and consequent patulin production in vitro. We find that increasing the sucrose content has a negative impact on laeA expression and patulin synthesis, but a positive impact on creA expression. This is the first report of sugar regulation of laeA expression, suggesting that its expression may be subject to catabolite repression by CreA. Some, but not all, of the 54 secondary metabolite backbone genes, including patK, were found to be regulated by LaeA. Deletion of laeA in two P. expansum genotypes isolated in Israel and China yielded mutants with greatly reduced patulin accumulation and reduced colonization patterns on apple cv. Golden Delicious.
Results
Association of sucrose content with patulin synthesis and laeA expression
Considering the high sugar content of apples and the report of Barad et al. (2016) showing that high sucrose concentration reduces patulin accumulation, we sought to determine the relationships between sucrose concentration, laeA expression and patulin production. The Israeli P. expansum isolate Is‐Pe‐21 was grown on solid medium with increasing sucrose concentrations (15–175 mm, where 175 mm represents a concentration of 6% sucrose) (Fig. 1). At 72 h post‐inoculation, patulin levels were maximal at 15 mm sucrose, reaching 174 µg/g dry weight (DW). This amount decreased with increasing sucrose concentration, reaching a minimum of 3.6 µg/g in the presence of 175 mm sucrose (Fig. 1A). As the sugar content in apples includes sucrose, glucose and fructose, we examined patulin production on 15 and 175 mm of all three sugars, this time with two isolates [Is‐Pe‐21 and a strain isolated in China (Ch‐Pe‐T01)]. Both strains showed a similar patulin production pattern at the two sugar concentrations. The highest patulin concentrations produced by Is‐Pe‐21 and Ch‐Pe‐T01 were on 15 mm sucrose‐amended medium, reaching up to 27 and 31 µg/g DW, respectively, whereas, in the presence of 175 mm sucrose, the level of patulin accumulation declined almost 20‐fold and ranged between 1.01 and 1.41 µg/g DW only (Fig. S1, see Supporting Information). Glucose and fructose supported less patulin production than sucrose; however, the same trend of decreased production on the 175 mm levels of these sugars was apparent for both strains (Fig. S1).
Figure 1.
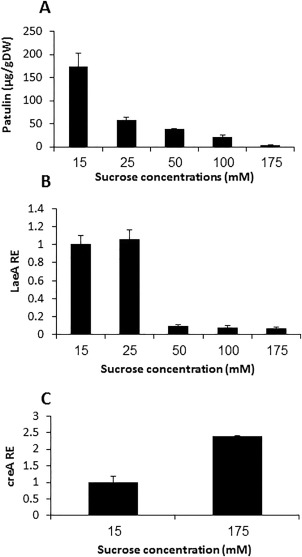
Effect of sucrose concentration on patulin accumulation and gene expression. Solid Secondary Medium (SM) at initial pH 5.0, amended with 15–175 mm sucrose, was inoculated with 100 μL of a 106 spore/mL suspension. Patulin (A), laeA relative expression (RE) (B) and creA RE (C) were evaluated at 3 days post‐inoculation. Five 10‐mm‐diameter discs were sampled from five independent culture plates. Average values ± standard errors of five replicates are reported. Experiments were repeated three times and the results of a single representative experiment are shown. DW, dry weight.
We hypothesized that patulin is regulated by LaeA, a global regulator of secondary metabolism that is conserved in all filamentous fungi (Bok and Keller, 2004). A blastP search in the Is‐Pe‐21 database against the LaeA amino acid sequence of A. nidulans (AN2919) confirmed the presence of a single gene, entry CGLO_02275. The predicted P. expansum LaeA comprises 428 amino acids and shows 97% similarity with the Penicillium citrinum LaeA, 61% similarity with A. nidulans LaeA and 42% similarity with Alternaria alternata LaeA registered during this study (Fig. S2, see Supporting Information). The sequence was previously submitted to GenBank under Accession No. KGO39425 (Ballester et al., 2015). We assessed the expression of laeA under the above sucrose concentrations and found that it paralleled patulin production. The highest laeA expression was observed at low sucrose concentrations (15 and 25 mm) and was 93% lower with 175 mm sucrose (Fig. 1B). As CreA, the global catabolite repressor in fungi, is activated in high sugar environments (Bi et al., 2015; Drew and Demain, 1977; Ronne, 1995), we also examined creA expression at 15 and 175 mm sucrose and found 2.5‐fold up‐regulation at the high sucrose concentration (Fig. 1C). Examination of the putative laeA promoter region showed that it contains three CreA‐binding sites (5′‐SYGGRG‐3′) (Cubero and Scazzocchio, 1994) at positions −278, −284 and −290 form the ATG. These results suggest an important role of the sugar concentration in laeA expression and patulin accumulation, possibly as a result of CreA's negative regulation of laeA.
LaeA regulates patulin gene expression and patulin synthesis
To further explore the role of LaeA in patulin production, a gene replacement strategy was carried out using Agrobacterium‐mediated transformation in two P. expansum strains: Is‐Pe‐21 and the Chinese Ch‐Pe‐T01 (Fig. S3A, see Supporting Information). Six laeA deletion mutants were obtained in both Penicillium strains, identified by polymerase chain reaction (PCR) (Fig. S3B) and confirmed by Southern blot analysis (Fig. S3C). Complemented transformants, in which laeA was reintroduced into the deletion strains, were generated for both genetic backgrounds (two complemented transformants for Is‐Pe‐21, three for Ch‐Pe‐T01) and identified by PCR (Fig. S3D,E). None of the Is‐Pe‐21 deletion mutants (ΔlaeA1, ΔlaeA3 and ΔlaeA5) or the Ch‐Pe‐T01 mutants (ΔlaeA1, ΔlaeA6, ΔlaeA18) showed expression of laeA compared with the wild‐type (WT) and complemented strains C‐1 and C‐3 (Fig. 2A,C) when grown in the presence of 50 mm sucrose. None of the ΔlaeA mutants accumulated detectable patulin, as determined by high‐performance liquid chromatography (HPLC) analysis (Fig. 2B,D). Complemented strains recovered patulin production and expression of laeA (Fig. 2). The ΔlaeA1, ΔlaeA3 and ΔlaeA5 mutants from the Is‐Pe‐21 background exhibited increased colony growth diameter relative to the WT strain (Fig. 3A) and a significant reduction of almost 50% in sporulation (Fig. 3B). The ΔlaeA1, ΔlaeA6 and ΔlaeA18 mutants from the Ch‐Pe‐T01 background exhibited a colony growth diameter similar to that of the WT strain (Fig. 3C) and, as with the Is‐Pe‐21 ΔlaeA mutants, they also showed a significant reduction of almost 50% in sporulation (Fig. 3D).
Figure 2.
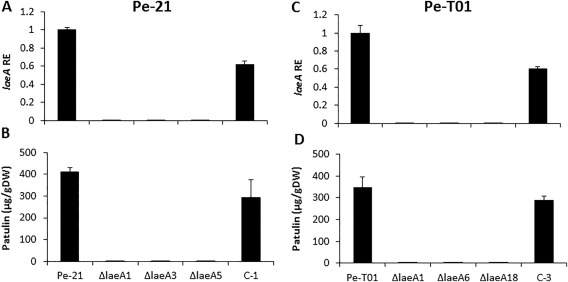
Relationship between laeA expression and patulin accumulation in the wild‐type (WT), mutants and complementary strains of the Israeli (Pe‐21) and Chinese (Pe‐T01) Penicillium expansum isolates. The fungus was grown in liquid medium for 48 h with shaking at 150 rpm and then transferred to liquid secondary medium (SM) at pH 5; 48 h later, the mycelia were collected and frozen. RNA was extracted and the relative expression (RE) of laeA (A,C) was analysed for the WT (Pe‐21), ΔlaeA1, ΔlaeA3, ΔlaeA5 and complementary strain (C‐1) (A), and for the WT (Pe‐T01), ΔlaeA1, ΔlaeA6, ΔlaeA18 and complementary strain (C‐3) (C). Solid SM medium at initial pH 5.0 amended with 50 mm sucrose was inoculated with 100 μL of a 106 spore/mL suspension. Patulin accumulation in the Pe‐21 (B) and Pe‐T01 (D) strains was evaluated at 3 days post‐inoculation. Five 10‐mm‐diameter discs were sampled from five independent culture plates. Average values ± standard errors of five replicates are reported. Experiments were repeated three times and the results of a single representative experiment are shown. DW, dry weight.
Figure 3.

Fungal growth and sporulation of the ΔlaeA mutants of the Israeli (Pe‐21) (A,B) and Chinese (Pe‐T01) (C,D) Penicillium expansum strains. Fungal growth and sporulation of the ΔlaeA mutants were measured on solid secondary media (SM) at initial pH 5.0 amended with 50 mm sucrose and inoculated with 100 μL of a 106 spore/mL suspension. Evaluations were carried out at 3, 5 and 7 days post‐inoculation. Average values ± standard errors of three replicates are reported and the experiments were repeated twice; a single representative experiment is shown.
The effect of ΔlaeA on the expression of all 15 genes involved in patulin biosynthesis was assessed in both genotypes (Is‐Pe‐21 and Ch‐Pe‐T01) compared with their respective mutant strains (Is‐Pe‐21 ΔlaeA strains 1, 3 and 5, and Ch‐Pe‐T01 ΔlaeA strains 1, 6 and 18) (Fig. 4). Data from both Is‐Pe‐21 and Ch‐Pe‐T01 ΔlaeA mutants consistently showed marked down‐regulation of all 15 genes. Among them, the lowest expression was observed in patB, patC, patM and patN in the Is‐Pe‐21 mutants, and in patG, patJ, patK and patO in the Ch‐Pe‐T01 mutants. Thus, similar to the regulation of mycotoxins in other fungi, LaeA affects patulin production in P. expansum by positively regulating the expression of genes in the patulin biosynthetic cluster.
Figure 4.

Relative expression of the 15 clustered patulin genes of Penicillium expansum. Expression of the genes involved in the biosynthesis of patulin was evaluated in the Israeli (Pe‐21, A) and Chinese (Pe‐T01, B) wild‐type (WT) strains and their ΔlaeA mutant strains. Primers used were from Li et al. (2015).
Loss of LaeA affects apple colonization
To assess the virulence of the laeA deletions in the WT strain backgrounds, freshly picked ‘Golden Delicious’ apples, sampled on three harvesting dates with 12.5%, 13.5% and 13.96% total soluble sugars, were inoculated with the ΔlaeA1, ΔlaeA3 and ΔlaeA5 mutants from the Is‐Pe‐21 background and the ΔlaeA1, ΔlaeA6 and ΔlaeA18 mutants from the Ch‐Pe‐T01 background. At 5 days post‐inoculation, patulin production by the WT and mutants was evaluated. No detectable patulin was recorded from apples infected with ΔlaeA strains of either genotype (Fig. 5G–L).
Figure 5.

Colonization and patulin accumulation by the Israeli (Pe‐21) and Chinese (Pe‐T01) wild‐type (WT) and ΔlaeA strains of Penicillium expansum in apple. Apple fruits were harvested at 157 days after fruit set and the following harvests were each 1 week apart. Fruits were inoculated with WT (Pe‐21) and its ΔlaeA1, ΔlaeA3 and ΔlaeA5 strains, and WT (PeT01) and its ΔlaeA1, ΔlaeA6 and ΔlaeA18 strains, immediately after harvest, and patulin accumulation was evaluated 5 days later. Different letters represent significant differences between the WT and mutant strains. The decay area (mm2) of the WT strain was set as 100% for each separate fruit. The decay areas (mm2) of the mutant strains were compared with the WT and are presented as the percentage inhibition of colonization. Average values ± standard errors of five replicates are reported. FW, fresh weight.
Although the Is‐Pe‐21 ΔlaeA strains showed a 10%–15% reduction in disease severity in early‐harvested fruits, this reduction reached 20%–22% compared with WT in fruit from the third harvest (Fig. 5A–C). The Ch‐Pe‐T01 ΔlaeA strains displayed a more variable reduction in virulence, ranging between no reduction in early‐harvested fruit to 15%–22% disease reduction in fruit inoculated in the third harvest period (Fig. 5D–F). Patulin production increased with host maturity in the WT strains for both geographical isolates, but no patulin production was detected during the same periods for the ΔlaeA mutants (Fig. 5G–L). Complemented strains did not differ significantly in the patulin content of colonized fruits and nor did the severity of colonized tissue (results not shown). Taken together, this suggests that LaeA differentially affects the virulence of the two P. expansum strains, dependent on the fruit maturity stage.
Role of LaeA in secondary metabolite gene expression
Although most studies on the secondary metabolism of P. expansum have focused on patulin, the genome is enriched in predicted secondary metabolite clusters, with several clusters that can be linked to probable metabolites based on characterized studies or bioinformatics analyses. These include the cytotoxin communesin cluster (Lin et al., 2015), the mycotoxin roquefortine cluster identified in P. chrysogenum (García‐Estrada et al., 2011) and recently predicted in other Penicillium species (Banani et al., 2016), an andrastin‐like cluster identified in P. chrysogenum and Emericella variecolor (Matsuda et al., 2013, 2016), a citrinin cluster identified in Monascus and Penicillium spp. (He and Cox, 2016; Li et al., 2012; Sakai et al., 2008; Woo et al., 2014), and two epipolythiodioxopiperazine (ETP)‐like, a monodictyphenone‐like, a loline‐like and, possibly, a partial spore pigment cluster (Fig. 6). A siderophore cluster can also tentatively be identified through homology of its backbone gene, PEXP_104890, similar to Aspergillus fumigatus SidE (Haas, 2014), as well as surrounding accessory genes. A previous study identified a subset of these clusters with expression that was altered during apple colonization (Ballester et al., 2015). Here, we assessed the expression of 54 backbone genes found in the genome of the Is‐Pe‐21 strain. Backbone genes included all PKSs, non‐ribosomal peptide synthases (NRPSs), dimethylallyl tryptophan synthases (DMATSs) and hybrid PKS–NRPSs, as determined by SMURF analysis (Khaldi et al., 2010).
Figure 6.

Schematic representation of gene clusters in Penicillium expansum Israeli isolate Pe‐21. The direction of transcription is indicated by arrowheads. The genes and intergenic regions are drawn to scale. (A) The patulin cluster of P. expansum refers to the work of Tannous et al. (2014). (B) The communesin cluster refers to the study by Lin et al. (2015). (C) The citrinin cluster refers to the reports of Ballester et al. (2015) and He and Cox (2016). (D–H) The clusters refer to the prediction of secondary metabolism gene clusters in P. expansum by Ballester et al. (2015). (I) The andrastin cluster was predicted by looking for sequence similarity with the characterized andrastin cluster in P. chrysogenum (Matsuda et al., 2013) by MultiGeneBlast (Medema et al., 2013). (J) The roquefortine cluster refers to the work of Banani et al. (2016). (K) The siderophore cluster was predicted by looking for sequence similarity with the characterized siderophore cluster in Aspergillus fumigatus (Gründlinger et al., 2013) by MultiGeneBlast.
The backbone genes were assessed in the Is‐Pe‐21 WT and ΔlaeA strains at two time points (3 and 5 days) in two media [CY medium, Czapek ‐ yeast extract, commonly used to grow P. expansum (Li et al., 2015) and apple purée–agar medium (APAM) from processed ‘Golden Delicious’ apples (Tannous et al., 2014)]. Following semi‐quantitative reverse transcription‐polymerase chain reaction (RT‐PCR) analysis, 11 of the 54 backbone genes were found not to be expressed in either the WT or ΔlaeA strains, regardless of the medium or culture duration. These correspond to the clusters designated # 4, 5, 13, 16, 19, 20, 21, 30, 34, 51 and 53, based on SMURF analysis (Table S1, see Supporting Information). One of these backbone genes (PEXP_093210) is putatively involved in the synthesis of the monodictyphenone‐like metabolite (Fig. 6). The identities of the other cluster metabolites are not known.
The expression of the backbone genes of six secondary metabolite gene clusters (2, 15, 18, 29, 36 and 50) was found to be altered by deletion of laeA on both tested media (Figs 7 and S4A,B, see Supporting Information). Three of these backbone genes (PEXP_030140, PEXP_071900 and PEXP_094460) correspond to the metabolites roquefortine, one ETP‐like metabolite and patulin, respectively. The identities of the three other clusters are not known. Interestingly, for some of the gene clusters, regulation by LaeA seemed to be medium dependent (Fig. S4). Backbone genes PEXP_028920 and PEXP_079130, corresponding to clusters 26 and 49, respectively, were both down‐regulated in ΔlaeA on APAM at 5 days. In contrast, PEXP_028920 was not expressed on CY medium, whereas PEXP_079130 showed no difference in expression between the WT and ΔlaeA strains on this medium. PEXP_000410, PEXP_000910, PEXP_072870 and PEXP_029660 (gene clusters 9, 40, 44 and 48, respectively) were only down‐regulated in ΔlaeA in CY medium. One of these backbone genes, PEXP_029660, was putatively assigned to the biosynthesis of loline. Moreover, the backbone genes PEXP_074060, PEXP_063270, PEXP_045260 and PEXP_012360 were also down‐regulated in ΔlaeA on CY medium, but were not expressed on APAM. The backbone genes of clusters 22, 23 and 42 were up‐regulated in the ΔlaeA strain relative to the WT. Nevertheless, the backbone gene PEXP_076200 of cluster 23 was slightly down‐regulated in the ΔlaeA strain on APAM on day 5. None of these backbone genes corresponded to known metabolites. The other backbone genes putatively assigned to the biosynthesis of communesin, citrinin, conidial pigment, an ETP‐like metabolite, andrastin and siderophore (Fig. 6) were not regulated by LaeA on either tested medium.
Figure 7.
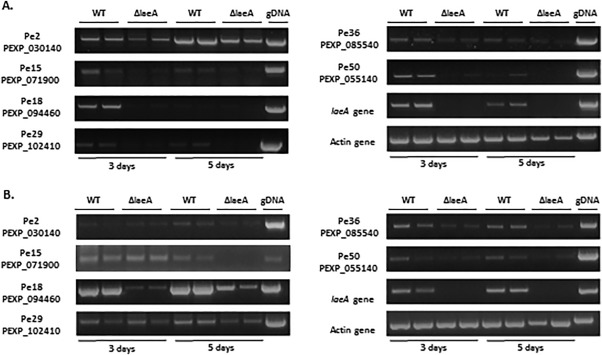
Semi‐quantitative reverse transcription‐polymerase chain reaction (RT‐PCR) validation of secondary metabolite backbone genes in Penicillium expansum regulated by LaeA. Gene expression was examined from 3‐ and 5‐day‐old cultures of the Israeli isolate Pe‐21 and its mutant ΔlaeA3 grown on Czapek ‐ yeast extract (CY) medium (A) and apple purée–agar medium (APAM) (B). laeA expression was monitored under different experimental growth conditions. β‐Actin housekeeping gene expression was used to normalize mRNA levels. Pe‐21 genomic DNA was used as a template to validate the primer sets. All samples were analysed on 0.8% agarose gels stained with ethidium bromide. A full set of the expression of the 54 secondary metabolite genes is shown in Fig. S4 (see Supporting Information). WT, wild‐type.
Finally, we compared the expression of these backbone genes under the different growth conditions in this work and the reported assessment of their expression on apple (Ballester et al., 2015). Figure 8 depicts a Venn diagram showing which backbone genes were expressed under each of these conditions and where regulation overlapped. Eighteen of the genes were expressed in apple and on CY and APAM in at least one time point; the inclusion of both time points reduced this number to 14. The 18 genes of the first comparison belonged to patulin, one ETP‐like, citrinin and 15 uncharacterized clusters containing backbone genes encoding seven PKSs, five NRPSs, one DMATS and two hybrid PKS–NRPSs.
Figure 8.
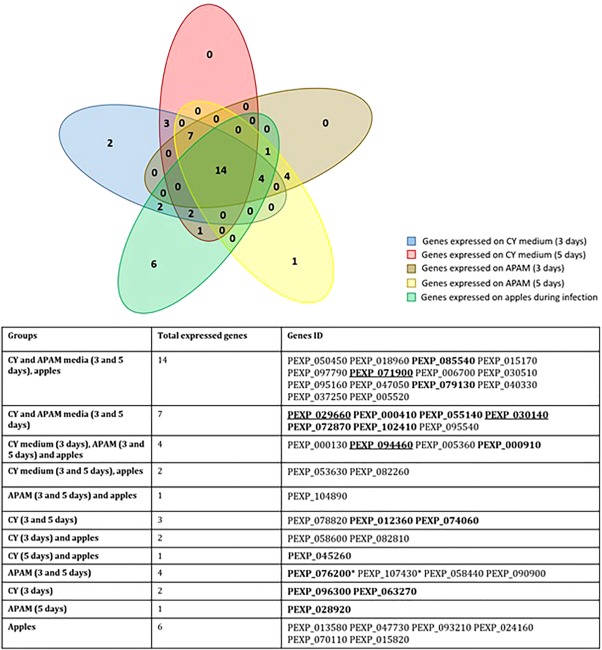
Venn diagram showing the overlap of Penicillium expansum backbone gene expression profiles between five experimental conditions. Gene expression was examined on Czapek ‐ yeast extract (CY) medium (days 3 and 5 of culture), apple purée–agar medium (APAM) (days 3 and 5 of culture) and apples (data based on a previous study by Ballester et al., 2015). Bold genes are those down‐regulated by LaeA; genes designated by asterisks are up‐regulated by LaeA (on CY medium only); genes corresponding to the identified clusters are underlined. The assigned putative clusters are: PEXP_071900 (epipolythiodioxopiperazine‐like), PEXP_030510 (communesin), PEXP_005520 (citrinin), PEXP_029660 (loline‐like), PEXP_030140 (roquefortine‐like), PEXP_094460 (patulin), PEXP_063340 (andrastin‐like), PEXP_104890 (siderophore‐like), PEXP_058600 (epipolythiodioxopiperazine‐like), PEXP_093210 (monodictyphenone‐like). It should be noted that there are a few genes that are down‐regulated in one medium and up‐regulated in another medium.
Discussion
Patulin contamination of apple and apple products is a significant health concern worldwide, with some studies supporting the role of this mycotoxin in fungal virulence (Barad et al., 2014; Sanzani et al., 2012; Snini et al., 2015) and others not (Ballester et al., 2015; Li et al., 2015). Regardless of how patulin affects the aggressiveness of P. expansum on apple, its presence in apple and other fruit has a negative impact on crop economy and human health. Furthermore, the role of other secondary metabolites produced by this pathogen on either virulence or health is unknown. Here, we examined the hypotheses that both sugar levels and laeA affect patulin synthesis, with laeA being a virulence factor in apple pathogenesis. We found that increasing sucrose concentration inhibits both laeA expression and patulin production, possibly linking catabolite repression to LaeA function.
Sucrose regulation of laeA may mediate a decrease in patulin synthesis
Apple is rich in many sugars, with a sucrose content of approximately 45%. Typically, glucose‐based sugars, such as sucrose, are thought to suppress secondary metabolism, with the exception of aflatoxin (Abdollahi and Buchanan, 1981). Here, we found that increasing sucrose content in vitro is correlated with decreases in both patulin production and laeA expression, but an increase in creA expression. Interestingly, the laeA promoter has three putative CreA‐binding sites and we speculate that CreA negatively regulates LaeA and hence some LaeA‐regulated metabolites, including patulin. Thus, at least in P. expansum, it would appear that sucrose suppression of patulin is mediated in part through LaeA. Thus patulin joins the expanding list of LaeA‐regulated mycotoxins, which includes aflatoxin, sterigmatocystin, fumonisin, cyclopiazonic acid, trichothecenes, citrinin and ochratoxin.
LaeA regulation of the patulin gene cluster
The recent description of the complete patulin biosynthesis cluster has enabled a full analysis of the synthesis process (Ballester et al., 2015; Li et al., 2015; Tannous et al., 2014). However, no details have been published on the mechanism of activation of this cluster. In contrast with most genes involved in primary metabolism, genes encoding secondary metabolite biosynthetic enzymes exist in contiguous clusters within the genome (Keller et al., 2005; Zhang et al., 2005). LaeA was originally identified as a transcriptional regulator of secondary metabolite gene clusters in A. nidulans and A. fumigatus (Bok and Keller, 2004; Bok et al., 2005). It has since been characterized in several fungi (Jain and Keller, 2013), including the mycotoxic species A. flavus, Fusarium verticillioides, Fusarium graminearum, Monascus ruber and Aspergillus carbonarius (Butchko et al., 2012; Crespo‐Sempere et al., 2013; Kale et al., 2008; Kim et al., 2013; Liu et al., 2016). Given the importance of LaeA in the regulation of secondary metabolites and the presence of laeA in the Penicillium genome (GenBank Accession No. KGO39425), we analysed the involvement of LaeA in patulin biosynthesis.
To analyse the functional importance of LaeA in patulin biosynthesis, laeA was deleted in two geographically distant strains of P. expansum: Is‐Pe‐21 and Ch‐Pe‐T01. LaeA has been found to differentially regulate some processes in different A. fumigatus isolates (Bok et al., 2005; Sugui et al., 2007), and we therefore analysed two strains to help account for any such differences in P. expansum. Functional analysis of Is‐Pe‐21 ΔlaeA mutant strains 1, 3 and 5 showed full reduction of laeA expression and no patulin accumulation (Fig. 2A,B), suggesting direct regulation of patulin biosynthesis by LaeA. Similar results were observed in ΔlaeA strains 1, 6 and 18 of Ch‐Pe‐T01 (Fig. 2C,D). The results of these two independent experiments in Israeli and Chinese P. expansum strains strongly support the importance of laeA in patulin synthesis.
More specifically, all 15 genes of the patulin cluster were markedly down‐regulated in ΔlaeA strains of both Is‐Pe‐21 and Ch‐Pe‐T01 (Fig. 4). Interestingly, the changes in expression patterns were not consistent between the two strains, with patB, patC, patM and patN being most strongly down‐regulated in the Is‐Pe‐21 ΔlaeA mutant, and patG, patJ, patK and patO most strongly down‐regulated in the Ch‐Pe‐T01 mutant. However, the same final result, i.e. decreased patulin production, was obtained with both strains.
The ΔlaeA mutant strains are less aggressive as the host matures
Using freshly harvested fruit sampled at different stages of maturity, we compared the ability of ΔlaeA strains to colonize fruits. Both WT Is‐Pe‐21 and WT Ch‐Pe‐T01 showed increasing patulin accumulation as the fruit matured (Fig. 5G–I and J–L, respectively). The WT Is‐Pe‐21 strain showed an increase from 0.2 to 1.5 µg patulin/g fresh weight (FW) of apple and the WT Ch‐Pe‐T01 strain showed an increase from 0.65 to 2.6 µg patulin/g FW apple over the three progressive harvests. Interestingly, the disease severity of ΔlaeA strains of Ch‐Pe‐T01 did not differ from the WT strain in early harvested fruits, but was reduced by up to 22% in more mature fruits, whereas the Is‐Pe‐21 ΔlaeA strains showed reduced virulence at all stages of apple maturity. This difference in the impact of LaeA on virulence was not affected by fungal growth, given that LaeA did not affect the growth of WT Is‐Pe‐21 or WT Ch‐Pe‐T01 (Fig. 3). However, the impact of LaeA on virulence, coupled with its differential regulation of colony growth and conidiation in the two P. expansum strains, is reminiscent of reports of laeA mutants in the human pathogen A. fumigatus, where loss of this gene presented slightly different toxin and virulence profiles (Bok et al., 2005; Sugui et al., 2007).
LaeA regulation of other secondary metabolite clusters
As noted above, the differential colonization patterns by ΔlaeA strains of Is‐Pe‐21 and Ch‐Pe‐T01, combined with the recent finding that patulin is an apple cultivar‐dependent virulence factor (Snini et al., 2015), suggest that LaeA‐regulated metabolites other than patulin could play a role in virulence on apple. Using two different culture media, we examined the profiles of 54 secondary metabolite genes, and found that several backbone genes from other clusters seem to be positively regulated by LaeA, including clusters 2, 15, 18, 29, 36 and 50. Three of these genes were putatively assigned to the biosynthesis of roquefortine, one to an ETP‐like metabolite and one to patulin. Roquefortine C is a known mycotoxin and is best characterized in P. chrysogenum, where the genes involved in the biosynthesis of roquefortine C and the related metabolite meleagrin belong to a single gene cluster (García‐Estrada et al., 2011). However, in this same species, the biosynthesis of roquefortine C was not controlled by LaeA, at least under the conditions assessed in that study (Kosalková et al., 2009). ETP‐like metabolites are produced by many fungi (Fox and Howlett, 2008) with the most well‐known being gliotoxin, a LaeA‐regulated virulence factor produced by the opportunistic human pathogen A. fumigatus (Bok et al., 2005), and sirodesmin, the phytotoxin produced by the plant pathogen Leptosphaeria maculans (Elliott et al., 2007). As the ETP‐like cluster was also expressed in apple, and considering the importance of both gliotoxin and sirodesmin in the pathogenicity of two other fungi, our future efforts will focus on the potential role for both ETP‐like clusters in virulence on apple.
Conclusions
The regulation of patulin biosynthesis is a key factor for the prevention of its accumulation in the host. Here we found that, similar to all mycotoxins assessed to date, LaeA is a positive regulator of patulin synthesis. The present results demonstrate the regulatory mechanism of LaeA as a modulator of patulin both in vitro and during the colonization of apple fruits. Our finding that sucrose—a key ingredient of apple fruit—regulates patulin synthesis, probably through suppression of laeA expression, suggests a potential interaction between CreA and LaeA, which may offer control therapies for future study.
The present results demonstrate that secondary metabolism modulated by LaeA contributes in part to P. expansum pathogenicity. Further work is needed to demonstrate which specific metabolites are of key importance for their contribution to colonization.
Experimental Procedures
Fungal strains, culture conditions, host and pathogenicity assays
The WT strain of the Israeli P. expansum isolate Pe‐21 was obtained from decayed apples (Malus domestica cv. ‘Golden Delicious’), as described previously (Hadas et al., 2007). The Chinese P. expansum isolate Pe‐T01 was obtained from infected apples showing typical blue mould symptoms (Li et al., 2015). Cultures were grown at room temperature in the dark, and maintained on potato dextrose agar (PDA) plates (Difco, Detroit, USA) unless otherwise indicated. Conidia were harvested with 10 mL of sterile distilled water supplemented with 0.01% (v/v) Tween 80 (Sigma‐Aldrich, Copenhagen, Denmark). Conidia were visualized with an Olympus model BX60F‐3 microscope (Olympus America, Inc., Melville, NY, USA) and counted using a haemocytometer. Single‐spore cultures were obtained and stored at −80 ºC until use.
‘Golden Delicious’ apples were freshly harvested from three trees in a single orchard in the north of Israel (Kibutz Bar Am). Freshly harvested fruits were analysed for TSS using a digital refractometer (Atago, Tokyo, Japan). Fruits from three harvests, (starting 157 days after fruit set), each 1 week apart, were used in the experiments. TSS values at harvest were 12.5%, 13.5% and 13.96% for the first, second and third harvests, respectively. A day later, fruits were wounded and inoculated with the WTs Is‐Pe‐21 and Ch‐Pe‐T01 and their ΔlaeA strains by placing 5 µL of spore suspension (5 × 10⁶ spore/mL) at a depth of 2 mm and incubating under high humidity at room temperature. The decay diameter was determined 5 days after inoculation.
Analysis of secondary metabolite backbone gene expression by semi‐quantitative RT‐PCR
Is‐Pe‐21 and its ΔlaeA strains were cultured in two different media. The first set of experiments was performed in Czapek ‐ yeast extract media (CY) liquid medium, previously found to stimulate the production of a wide variety of fungal secondary metabolites, including patulin (Li et al., 2015). WT and ΔlaeA strains (100 µL of 1 × 10⁶ spore/mL suspensions) were spread on cellophane sheets placed on PDA plates and cultured at 25 °C for 1 day. Then, the cellophane sheets were transferred to 25 mL CY liquid medium. Each cellophane sheet was floated on the medium and cultured without shaking in the dark. The second set of experiments was performed on APAM, prepared as described by Baert et al. (2007) to mimic the naturally occurring conditions for P. expansum (Baert et al., 2007). Assays on this medium were conducted according to the method of Tannous et al. (2014). For both media, the mycelia were collected on days 3 and 5 after inoculation. All experiments were carried out in duplicate.
RNA from the strains grown in CY liquid medium was extracted using QIAzol® Lysis Reagent (Qiagen, Hilden, Germany) according to the manufacturer's instructions. RNA from the strains grown on APAM was prepared with the RNeasy Mini Kit (Qiagen) as described by Tannous et al. (2014). RNA purity and concentration were determined with an Epoch 2 microplate reader (Biotek, Winooski, VT, USA).
RNA (10 μg) was treated with DNase I (New England BioLabs, Ipswich, MA, USA) and employed as template for cDNA synthesis using the iScriptTM cDNA Synthesis Kit (Bio‐Rad, Hercules, CA, USA). cDNA (50 ng) was used as the template DNA for semi‐quantitative PCR. The optimal annealing temperature was determined by PCR of genomic DNA (gDNA), and a sample of gDNA was always included as a positive control. The entire 25‐μL PCR was loaded onto a 1.5% agarose gel containing ethidium bromide, separated by gel electrophoresis and imaged under UV light. The primers used for amplification are listed in Table S2 (see Supporting Information).
Gene expression analysis by quantitative RT‐PCR
To examine laeA and creA gene expression, RNA was extracted using the SV Total RNA Isolation Kit (Promega, Madison, WI, USA) and the RT reaction was performed with the Reverse‐it First‐Strand Synthesis Kit (ABgene, Surrey, UK) on 1 μg of total RNA according to the manufacturer's protocol. The cDNA samples were diluted 1 : 10 (v/v) with ultrapure water. Similar conditions were used to examine the patulin gene cluster.
Real‐time quantitative PCR was performed with the StepOnePlus System (Applied Biosystems, Grand Island, NY, USA) using the primers presented in Table S2 or reported previously by Zong et al. (2015). PCR amplification was performed with 3.4 µL of cDNA template in 10 µL of a reaction mixture containing 6.6 µL mix from the SYBR Green Amplification Kit (ABgene) and 300 nm primers. Table S2 lists the forward and reverse primers for each of the indicated genes. PCR was carried out with the following cycling program: 10 min at 94 ºC, followed by 40 cycles of 94 ºC for 10 s, 60 ºC for 15 s and 72 ºC for 20 s. The samples were subjected to melting curve analysis, with efficiencies close to 100% for all primer pairs, and all products showed the expected size of 70–100 bp. All of the samples were normalized to 28S expression levels and the values were expressed as the change (increase or decrease) in relative level of a calibrator sample. Results were analysed with StepOnePlus v.2.2.2 software. Relative quantification was performed by the ΔΔCT method (Livak and Schmittgen, 2001). The ΔCT value was determined by subtracting the CT results for the target gene from those for the endogenous control gene, and normalized against the calibration sample to generate the ΔΔCT values. Each experiment was performed in triplicate, and three different biological experiments were conducted. One representative set of results is presented as mean values of 2–ΔΔCT ± standard error (SE) for each treatment.
Patulin accumulation
To determine patulin accumulation ability in culture, fungal spores (100 µL of a 106 fungal spore/mL solution) were inoculated on 55‐mm‐diameter Petri dishes with 10 mL of solid Secondary Medium (SM) containing (per litre) 7 g NaNO3, 3 g tryptone (Difco), 1 g KH2PO4, 0.5 g MgSO4.7H2O and 0.5 g KCl, different concentrations of sucrose (15, 25, 50, 100 and 175 mm, as indicated in each experiment) and 2% agar, adjusted to pH 5 with concentrated HCl. The plates were incubated at 25 °C in the dark for 72 h. Mycelium was peeled off the plates, frozen in liquid nitrogen and lyophilized for RNA extraction. Five 1‐cm‐diameter discs of SM agar were placed in 5 mL of sterile water and homogenized with an HG‐300 homogenizer (MRC, Calgary, Canada). To analyse the parameters as DW, three whole‐medium plates were heated in a microwave, the agar was soaked up with a paper towel and the remaining mycelia were lyophilized for 24 h. The DW was measured on an analytical scale (Sartorius, Goettingen, Germany).
To analyse patulin accumulation in colonized apple tissue, the same FW of each decay area was taken, 5 mL of double‐distilled water was added and the tissues were homogenized. The final pH was measured in the homogenized samples of in vivo and in vitro experiments using a double‐pore slim electrode (Hamilton, Reno, NV) connected to a Thermo Orion Model 720A Plus pH meter (Kibbutz Mevo Hamma, Israel).
Patulin accumulation was evaluated in the remaining homogenized agar disc plates or apple tissue as described by Barad et al. (2014). Briefly, patulin was extracted after the addition of 10 mL of ethyl acetate to the homogenized samples by shaking for 1 min using a vortex mixer and centrifuging for 5 min at room temperature at 4000 g. The upper organic phase was transferred to a fresh tube and extracted with 10 mL of a 1.5% sodium carbonate suspension by shaking for 1 min using a vortex mixer and centrifuging for 5 min at room temperature at 4000 g. The samples were left to dry in a fume hood. Completely dried samples were redissolved in 0.5 mL of the elution solution containing 0.02 m ammonium acetate and acetonitrile (9 : 1, v/v), and filtered through a 0.22‐µm Minisart filter (Sartorius Stedim) before injection into the column. Quantitative analysis of patulin was performed by HPLC (Hitachi‐Merck, USA) equipped with a UV–visible detector at 280 nm, with a C18 250 × 4.5‐mm2 Microsorb‐MV‐100‐5 column (Varian, Santa Clara, CA, USA). The sample (50 µL) was injected into the column at a rate of 0.8 mL/min. The patulin fraction was eluted with 0.02 m ammonium acetate and acetonitrile (9 : 1) at a retention time of approximately 7 min. The results were compared with a commercial patulin standard (Sigma‐Aldrich).
Construction of the replacement and complementation vectors of laeA and transformation
Construction of the replacement and complementation vectors of laeA and transformation were performed according to Li et al. (2015). The binary vector pCHPH containing the hygromycin phosphotransferase gene (hph) was first constructed based on vectors pLOB 7 and pCAMBIA 1300. Then, two fragments flanking each LaeA were amplified and cloned into pCHPH up‐ and downstream of hph to yield the vector pCHPH‐LaeA (Fig. S3A). Primers for amplification of the flanking fragments are listed in Table S2. The gene replacement vector was transformed using an Agrobacterium‐mediated transformation method as described by Li et al. (2015). The hygromycin B‐resistant strains were verified by PCR using primer pairs T1 and R2 (Table S2). Then, the positive transformants were purified by single‐spore isolation and confirmed by Southern blot analysis to exclude transformants with ectopic integration sites (Fig. S3C). The gDNA was digested with EcoRI and hybridized with a probe (digoxigenin‐labelled Flank R) using a Dig‐Hybridization Detection Kit (Mylab, Tampere, Helsinki, Finland).
For construction of the gene complementation vectors, the open reading frame of LaeA, together with the promoter region (Flank L) and terminator region (Flank R), were amplified by primer pair C‐L1 and C‐R2, and cloned into pCNEO (Li et al., 2015) to yield the vector pCNEO‐LaeA (Fig. S3D). The primers used for amplification of the complementary fragment and verification of the positive transformants are listed in Table S2. Verification of positive transformants was by PCR with primers C‐L1 and C‐O2 (Fig. S3E).
laeA expression in WT, ΔlaeA and complemented strains
To further verify the positive transformants, 106 spore/mL of Is‐Pe‐21 WT, ΔlaeA strains 1, 3 and 5 and the complemented strains were inoculated into 40 mL of primary medium (glucose minimal medium) in 125‐mL flasks containing (per litre) 10 g sucrose, 5 g yeast extract (Difco), 50 mL nitrate salts and 1 mL trace elements at pH 4.5. The cultures were incubated at 25 ºC with shaking at 150 rpm for 48 h. Cultures were harvested by vacuum filtration through a sterile Büchner funnel fitted with a Whatman (GE Healthcare, UK) No. 1 filter paper, and the remaining mycelia were washed twice with 50 mL of sterile distilled water. The washed mycelia were resuspended in 50 mL liquid SM medium containing (per litre) 60 g sugar, 7 g NaNO3, 3 g tryptone, 1 g KH2PO4, 0.5 g MgSO4.7H2O and 0.5 g KCl, adjusted to pH 5 with concentrated HCl. The culture was incubated at 25 ºC on a rotating shaker at 150 rpm. The final pH was measured 48 h after transfer to SM liquid medium and the mycelia were sampled, frozen with liquid nitrogen and lyophilized for RNA extraction.
MultiGeneBlast analysis of roquefortine and siderophore clusters
The amino acid sequences of all proteins in the characterized roquefortine (García‐Estrada et al., 2011) and siderophore (Gründlinger et al., 2013) clusters were retrieved from Genbank (http://www.ncbi.nlm.nih.gov/). MultiGeneBlast (MGB; Medema et al., 2013) was used to predict the presence of roquefortine and siderophore clusters in the Is‐Pe‐21 genome by looking for sequence similarity with the characterized clusters at the whole‐cluster level. MGB architect searches were carried out with multifasta files containing protein sequences of each characterized cluster by default parameters.
Statistical analysis
Data were analysed with the JMP software package, version Pro10 (SAS Institute, Cary, NC, USA). Mean comparisons of gene expression, patulin production and ambient pH measurements were analysed according to least significant difference (LSD) with the Tukey–Kramer multiple comparison test at P ≤ 0.05.
Supporting information
Additional Supporting Information may be found in the online version of this article at the publisher's website:
Fig. S1 Differential accumulation of patulin in the presence of apple fruit sugars. One hundred microlitres of 106 spores/mL of Is‐Pe‐21 and Ch‐Pe‐T01 were inoculated onto solid Secondary Medium (SM) agar adjusted to pH 5.0 containing 15 mm (A, C) or 175 mm (B, D) of sucrose, glucose or fructose as carbon sources. Patulin was extracted 72 h later. Five replicates were sampled for each sugar substrate. Average values ± standard error of five replicates of patulin extractions are presented. Experiments were repeated three times and the results of a single representative experiment are shown.
Fig. S2 Multiple sequence alignment of LaeA amino acid sequences from Alternaria alternata (BAP58880; Aa), Aspergillus nidulans (AAQ95166; An) and Penicillium citrinum (BAL61197; Pc), showing 42%, 61% and 97% similarity to LaeA from Penicillium expansum (KGO39425; Pe). The shaded region from residues 192 to 284 encodes amino acids of AdoMet_MTases (S‐adenosylmethionine‐dependent methyltransferases class I), which use S‐adenosyl‐l‐methionine (SAM or AdoMet) as a substrate for methyl transfer, creating the product S‐adenosyl‐l‐homocysteine.
Fig. S3 Generation of LaeA mutants. (A) Replacement strategy for deletion of laeA. The gene replacement vector was constructed by cloning Flank L and Flank R on each side of the hygromycin resistance cassette of pCHPH to yield the vector pCHPH‐LaeA. Primers for amplification of the flanking fragments are listed in Table S2 (see Supporting Information). Restriction sites: A, AscI; E, EcoRI; H, HindIII; K, KpnI; X, XbaI. Verification of the positive transformants by polymerase chain reaction (PCR) (B) and Southern blot analysis (C). Primer pairs T1 and R2 (see Table S2) were used for flank‐spanning PCR to verify the positive transformants. For Southern blot analysis, genomic DNA was digested with EcoRI and hybridized with a probe (digoxigenin‐labelled Flank R). (D) The open reading frame of LaeA together with the promoter region (Flank L) and terminator region (Flank R) were amplified by primer C‐L1 and C‐R2, and cloned into pCNEO to yield the vector pCNEO‐LaeA. Primers used for amplification of the complementary fragments and verification of the positive transformants are listed in Table S2. (E) Verification of the positive transformants by PCR with primers C‐L1 and C‐O2. WT, wild‐type.
Fig. S4 Semi‐quantitative reverse transcription‐polymerase chain reaction (RT‐PCR) of secondary metabolite backbone genes in Penicillium expansum regulated by LaeA. Gene expression was examined from 3‐ and 5‐day‐old cultures of the Israeli Pe‐21 wild‐type (WT) strain and its ΔlaeA mutants on Czapek ‐ yeast extract (CY) medium (A) and apple purée–agar medium (APAM) (B). laeA gene expression was monitored under different experimental growth conditions. β‐Actin housekeeping gene expression was used to normalize mRNA levels. Pe‐21 genomic DNA was used as a template to validate the primer sets. All samples were analysed on 0.8% agarose gels stained with ethidium bromide.
Fig S4B
Table S1 Expression profile of Penicillium expansum secondary metabolite backbone genes on Czapek ‐ yeast extract (CY) medium and apple purée–agar medium (APAM) at two time points. Semi‐quantitative reverse transcription‐polymerase chain reaction (RT‐PCR) was performed on cDNA isolated from Is‐Pe‐21 wild‐type (WT) and ΔlaeA3 strains, and the PCR products were analysed by PCR. ++, high expression; +, intermediate expression; +/− expression that is marginally detectable after 28 cycles of PCR. Empty box indicates absence of expression. Down‐ and up‐regulation of genes in the ΔlaeA strain is shown by light and dark grey shading, respectively. The β‐actin gene was used for normalization of the cDNA amounts.
Table S2 Primers used in this research.
Acknowledgements
We acknowledge the financial support of the US/Israel Binational Agricultural & Research Fund (BARD, Israel) project I‐IS‐4773‐14 to D.P. and N.K., and of the National Natural Science Foundation of China (31530057; 31371863) to Y.C. and B.L.
References
- Abdollahi, A. and Buchanan, R. (1981) Regulation of aflatoxin biosynthesis: characterization of glucose as an apparent inducer of aflatoxin production. J. Food Sci. 46, 143–146. [Google Scholar]
- Baert, K. , Devlieghere, F. , Flyps, H. , Oosterlinck, M. , Ahmed, M.M. , Rajković, A. , Verlinden, B. , Nicolaï, B. , Debevere, J. and De Meulenaer, B. (2007) Influence of storage conditions of apples on growth and patulin production by Penicillium expansum . Int. J. Food Microbiol. 119, 170–181. [DOI] [PubMed] [Google Scholar]
- Ballester, A.R. , Marcet‐Houben, M. , Levin, E. , Sela, N. , Selma‐Lazaro, C. , Carmona, L. , Wisniewski, M. , Droby, S. , Gonzalez‐Candelas, L. and Gabaldon, T. (2015) Genome, transcriptome, and functional analyses of Penicillium expansum provide new insights into secondary metabolism and pathogenicity. Mol. Plant–Microbe Interact. 28, 232–248. [DOI] [PubMed] [Google Scholar]
- Banani, H. , Marcet‐Houben, M. , Ballester, A.R. , Abbruscato, P. , González‐Candelas, L. , Gabaldón, T. and Spadaro, D. (2016) Genome sequencing and secondary metabolism of the postharvest pathogen Penicillium griseofulvum . BMC Genomics, 17, 19. [DOI] [PMC free article] [PubMed] [Google Scholar]
- Barad, S. , Espeso, E.A. , Sherman, A. and Prusky, D. (2016) Ammonia activates pacC and patulin accumulation in an acidic environment during apple colonization by Penicillium expansum . Mol. Plant Pathol. 17, 727–740. [DOI] [PMC free article] [PubMed] [Google Scholar]
- Barad, S. , Horowitz‐Brown, S. , Kobiler, I. , Sherman, A. and Prusky, D. (2014) Accumulation of the mycotoxin patulin in the presence of gluconic acid contributes to pathogenicity of Penicillium expansum . Mol. Plant–Microbe Interact. 27, 66–77. [DOI] [PubMed] [Google Scholar]
- Barkai‐Golan, R. (2001) Postharvest Diseases of Fruits and Vegetables: Development and Control. Amsterdam: Elsevier Sciences. [Google Scholar]
- Bi, F. , Barad, S. , Ment, D. , Luria, N. , Dubey, A. , Casado, V. , Glam, N. , Mínguez, J.D. , Espeso, E. , Fluhr, R. and Prusky, D. (2015) Carbon regulation of environmental pH by secreted small molecules that modulate pathogenicity in phytopathogenic fungi. Mol. Plant Pathol. DOI: 10.1111/mpp.12355. [DOI] [PMC free article] [PubMed] [Google Scholar]
- Bok, J.W. and Keller, N.P. (2004) LaeA, a regulator of secondary metabolism in Aspergillus spp. Eukaryot Cell, 3, 527–535. [DOI] [PMC free article] [PubMed] [Google Scholar]
- Bok, J.W. , Balajee, S.A. , Marr, K.A. , Andes, D. , Nielsen, K.F. , Frisvad, J.C. and Keller, N.P. (2005) LaeA, a regulator of morphogenetic fungal virulence factors. Eukaryot. Cell, 4, 1574–1582. [DOI] [PMC free article] [PubMed] [Google Scholar]
- Butchko, R.A. , Brown, D.W. , Busman, M. , Tudzynski, B. and Wiemann, P. (2012) Lae1 regulates expression of multiple secondary metabolite gene clusters in Fusarium verticillioides . Fungal Genet. Biol. 49, 602–612. [DOI] [PubMed] [Google Scholar]
- Cepeda‐García, C. , Domínguez‐Santos, R. , García‐Rico, R.O. , García‐Estrada, C. , Cajiao, A. , Fierro, F. and Martín, J.F. (2014) Direct involvement of the CreA transcription factor in penicillin biosynthesis and expression of the pcbAB gene in Penicillium chrysogenum . Appl. Microbiol. Biotechnol. 98, 7113–7124. [DOI] [PubMed] [Google Scholar]
- Crespo‐Sempere, A. , Marin, S. , Sanchis, V. and Ramos, A. (2013) VeA and LaeA transcriptional factors regulate ochratoxin A biosynthesis in Aspergillus carbonarius . Int. J. Food Microbiol. 166, 479–486. [DOI] [PubMed] [Google Scholar]
- Cubero, B. and Scazzocchio, C. (1994) Two different, adjacent and divergent zinc finger binding sites are necessary for CREA‐mediated carbon catabolite repression in the proline gene cluster of Aspergillus nidulans . EMBO J. 13, 407. [DOI] [PMC free article] [PubMed] [Google Scholar]
- Drew, S.W. and Demain, A.L. (1977) Effect of primary metabolites on secondary metabolism. Annu. Rev. Microbiol. 31, 343–356. [DOI] [PubMed] [Google Scholar]
- Elliott, C.E. , Gardiner, D.M. , Thomas, G. , Cozijnsen, A. , Van de Wouw, A. and Howlett, B.J. (2007) Production of the toxin sirodesmin PL by Leptosphaeria maculans during infection of Brassica napus . Mol. Plant Pathol. 8, 791–802. [DOI] [PubMed] [Google Scholar]
- Espeso, E.A. and Peñalva, M.A. (1992) Carbon catabolite repression can account for the temporal pattern of expression of a penicillin biosynthetic gene in Aspergillus nidulans . Mol. Microbiol. 6, 1457–1465. [DOI] [PubMed] [Google Scholar]
- Fox, E.M. and Howlett, B.J. (2008) Secondary metabolism: regulation and role in fungal biology. Curr. Opin. Microbiol. 11, 481–487. [DOI] [PubMed] [Google Scholar]
- García‐Estrada, C. , Ullán, R.V. , Albillos, S.M. , Fernández‐Bodega, M. , Durek, P. , von Döhren, H. and Martín, J.F. (2011) A single cluster of coregulated genes encodes the biosynthesis of the mycotoxins roquefortine C and meleagrin in Penicillium chrysogenum . Chem. Biol. 18, 1499–1512. [DOI] [PubMed] [Google Scholar]
- Georgianna, D.R. and Payne, G.A. (2009) Genetic regulation of aflatoxin biosynthesis: from gene to genome. Fungal Genet. Biol. 46, 113–125. [DOI] [PubMed] [Google Scholar]
- Georgianna, D.R. , Fedorova, N.D. , Burroughs, J.L. , Dolezal, A.L. , Bok, J.W. , Horowitz‐Brown, S. , Woloshuk, C.P. , Yu, J. , Keller, N.P. and Payne, G.A. (2010) Beyond aflatoxin: four distinct expression patterns and functional roles associated with Aspergillus flavus secondary metabolism gene clusters. Mol. Plant Pathol. 11, 213–226. [DOI] [PMC free article] [PubMed] [Google Scholar]
- Gründlinger, M. , Yasmin, S. , Lechner, B.E. , Geley, S. , Schrettl, M. , Hynes, M. and Haas, H. (2013) Fungal siderophore biosynthesis is partially localized in peroxisomes. Mol. Microbiol. 88, 862–875. [DOI] [PMC free article] [PubMed] [Google Scholar]
- Haas, H. (2014) Fungal siderophore metabolism with a focus on Aspergillus fumigatus . Nat. Prod. Rep. 31, 1266–1276. [DOI] [PMC free article] [PubMed] [Google Scholar]
- Hadas, Y. , Goldberg, I. , Pines, O. and Prusky, D. (2007) Involvement of gluconic acid and glucose oxidase in the pathogenicity of Penicillium expansum in apples. Phytopathology, 97, 384–390. [DOI] [PubMed] [Google Scholar]
- He, Y. and Cox, R.J. (2016) The molecular steps of citrinin biosynthesis in fungi. Chem. Sci. 7, 2119–2127. [DOI] [PMC free article] [PubMed] [Google Scholar]
- Hecke, K. , Herbinger, K. , Veberič, R. , Trobec, M. , Toplak, H. , Štampar, F. , Keppel, H. and Grill, D. (2006) Sugar‐, acid‐ and phenol contents in apple cultivars from organic and integrated fruit cultivation. Eur. J. Clin. Nutr. 60, 1136–1140. [DOI] [PubMed] [Google Scholar]
- Hulme, A.C. (1971) The Biochemistry of Fruits and Their Products, Vol. 2 London: Academic Press. [Google Scholar]
- Jain, S. and Keller, N. (2013) Insights to fungal biology through LaeA sleuthing. Fungal Biol. Rev. 27, 51–59. [Google Scholar]
- Kale, S.P. , Milde, L. , Trapp, M.K. , Frisvad, J.C. , Keller, N.P. and Bok, J.W. (2008) Requirement of LaeA for secondary metabolism and sclerotial production in Aspergillus flavus . Fungal Genet. Biol. 45, 1422–1429. [DOI] [PMC free article] [PubMed] [Google Scholar]
- Keller, N.P. , Turner, G. and Bennett, J.W. (2005) Fungal secondary metabolism—from biochemistry to genomics. Nat. Rev. Microbiol. 3, 937–947. [DOI] [PubMed] [Google Scholar]
- Khaldi, N. , Seifuddin, F.T. , Turner, G. , Haft, D. , Nierman, W.C. , Wolfe, K.H. and Fedorova, N.D. (2010) SMURF: genomic mapping of fungal secondary metabolite clusters. Fungal Genet. Biol. 47, 736–741. [DOI] [PMC free article] [PubMed] [Google Scholar]
- Kim, H.K. , Lee, S. , Jo, S.M. , McCormick, S.P. , Butchko, R.A. , Proctor, R.H. and Yun, S.H. (2013) Functional roles of FgLaeA in controlling secondary metabolism, sexual development, and virulence in Fusarium graminearum . PLoS One, 8, e68441. [DOI] [PMC free article] [PubMed] [Google Scholar]
- Kosalková, K. , García‐Estrada, C. , Ullán, R.V. , Godio, R.P. , Feltrer, R. , Teijeira, F. , Mauriz, E. and Martín, J.F. (2009) The global regulator LaeA controls penicillin biosynthesis, pigmentation and sporulation, but not roquefortine C synthesis in Penicillium chrysogenum . Biochimie, 91, 214–225. [DOI] [PubMed] [Google Scholar]
- Li, B. , Zong, Y. , Du, Z. , Chen, Y. , Zhang, Z. , Qin, G. , Zhao, W. and Tian, S. (2015) Genomic characterization reveals insights into patulin biosynthesis and pathogenicity in Penicillium species. Mol. Plant–Microbe Interact. 28, 635–647. [DOI] [PubMed] [Google Scholar]
- Li, Y.P. , Xu, Y. and Huang, Z.B. (2012) Isolation and characterization of the citrinin biosynthetic gene cluster from Monascus aurantiacus . Biotechnol. Lett. 34, 131–136. [DOI] [PubMed] [Google Scholar]
- Lin, H.C. , Chiou, G. , Chooi, Y.H. , McMahon, T.C. , Xu, W. , Garg, N.K. and Tang, Y. (2015) Elucidation of the concise biosynthetic pathway of the communesin indole alkaloids. Angew. Chem. Int. Ed. Engl. 127, 3047–3050. [DOI] [PMC free article] [PubMed] [Google Scholar]
- Liu, Q. , Cai, L. , Shao, Y. , Zhou, Y. , Li, M. , Wang, X. and Chen, F. (2016) Inactivation of the global regulator LaeA in Monascus ruber results in a species‐dependent response in sporulation and secondary metabolism. Fungal Biol. 120, 297–305. [DOI] [PubMed] [Google Scholar]
- Livak, K.J. and Schmittgen, T.D. (2001) Analysis of relative gene expression data using real‐time quantitative PCR and the 2−ΔΔCT method. Methods, 25, 402–408. [DOI] [PubMed] [Google Scholar]
- Matsuda, Y. , Awakawa, T. and Abe, I. (2013) Reconstituted biosynthesis of fungal meroterpenoid andrastin A. Tetrahedron, 69, 8199–8204. [Google Scholar]
- Matsuda, Y. , Quan, Z. , Mitsuhashi, T. , Li, C. and Abe, I. (2016) Cytochrome P450 for citreohybridonol synthesis: oxidative derivatization of the andrastin scaffold. Org. Lett. 18, 296–299. [DOI] [PubMed] [Google Scholar]
- McKinley, E.R. and Carlton, W.W. (1991) Patulin In: Mycotoxins and Phytoalexins (Sharma R.P. and Salunkhe D.K., eds), pp. 191–236. Boca Raton, FL: CRC Press. [Google Scholar]
- Medema, M.H. , Takano, E. and Breitling, R. (2013) Detecting sequence homology at the gene cluster level with MultiGeneBlast. Mol. Biol. Evol. 30, 1218–1223. [DOI] [PMC free article] [PubMed] [Google Scholar]
- Moake, M.M. , Padilla Zakour, O.I. and Worobo, R.W. (2005) Comprehensive review of patulin control methods in foods. Compr. Rev. Food Sci. Food Saf. 4, 8–21. [DOI] [PubMed] [Google Scholar]
- Pitt, J.I. and Hocking, A.D. (2009) Fungi and food spoilage (Vol. 519). New York: Springer. [Google Scholar]
- Prusky, D. , McEvoy, J.L. , Saftner, R. , Conway, W.S. and Jones, R. (2004) Relationship between host acidification and virulence of Penicillium spp. on apple and citrus fruit. Phytopathology, 94, 44–51. [DOI] [PubMed] [Google Scholar]
- Puel, O. , Galtier, P. and Oswald, I.P. (2010) Biosynthesis and toxicological effects of patulin. Toxins, 2, 613–631. [DOI] [PMC free article] [PubMed] [Google Scholar]
- Ronne, H. (1995) Glucose repression in fungi. Trends Genet. 11, 12–17. [DOI] [PubMed] [Google Scholar]
- Ruiz, B. , Chávez, A. , Forero, A. , García‐Huante, Y. , Romero, A. , Sánchez, M. , Rocha, D. , Sánchez, B. , Rodríguez‐Sanoja, R. and Sánchez, S. (2010) Production of microbial secondary metabolites: regulation by the carbon source. Crit. Rev. Microbiol. 36, 146–167. [DOI] [PubMed] [Google Scholar]
- Sakai, K. , Kinoshita, H. , Shimizu, T. and Nihira, T. (2008) Construction of a citrinin gene cluster expression system in heterologous Aspergillus oryzae . J. Biosci. Bioeng. 106, 466–472. [DOI] [PubMed] [Google Scholar]
- Sanzani, S.M. , Reverberi, M. , Punelli, M. , Ippolito, A. and Fanelli, C. (2012) Study on the role of patulin on pathogenicity and virulence of Penicillium expansum . Int. J. Food Microbiol. 153, 323–331. [DOI] [PubMed] [Google Scholar]
- Schmidt‐Heydt, M. , Magan, N. and Geisen, R. (2008) Stress induction of mycotoxin biosynthesis genes by abiotic factors. FEMS Microbiol. Lett. 284, 142–149. [DOI] [PubMed] [Google Scholar]
- Snini, S.P. , Tannous, J. , Heuillard, P. , Bailly, S. , Lippi, Y. , Zehraoui, E. , Barreau, C. , Oswald, I.P. and Puel, O. (2015) The patulin is a cultivar dependent aggressiveness factor favoring the colonization of apples by Penicillium expansum . Mol. Plant Pathol. 17, 920–930. doi: 10.1111/mpp.12338. [DOI] [PMC free article] [PubMed] [Google Scholar]
- Sugui, J.A. , Pardo, J. , Chang, Y.C. , Müllbacher, A. , Zarember, K.A. , Galvez, E.M. , Brinster, L. , Zerfas, P. , Gallin, J.I. and Simon, M.M. (2007) Role of laeA in the regulation of alb1, gliP, conidial morphology, and virulence in Aspergillus fumigatus . Eukaryot. Cell, 6, 1552–1561. [DOI] [PMC free article] [PubMed] [Google Scholar]
- Tannous, J. , El Khoury, R. , Snini, S.P. , Lippi, Y. , El Khoury, A. , Atoui, A. , Lteif, R. , Oswald, I.P. and Puel, O. (2014) Sequencing, physical organization and kinetic expression of the patulin biosynthetic gene cluster from Penicillium expansum . Int. J. Food Microbiol. 189, 51–60. [DOI] [PubMed] [Google Scholar]
- Woo, P.C. , Lam, C.W. , Tam, E.W. , Lee, K.C. , Yung, K.K. , Leung, C.K. , Sze, K.H. , Lau, S.K. and Yuen, K.Y. (2014) The biosynthetic pathway for a thousand‐year‐old natural food colorant and citrinin in Penicillium marneffei . Sci. Rep. 4, 6728. [DOI] [PMC free article] [PubMed] [Google Scholar]
- Wouters, M.F.A. and Speijers, G.J.A. (1996) Patulin. Food Additives Series 35 Toxicological Evaluation of Certain Food Additives and Contaminants, Vol. 35, pp. 377–340. Geneva: World Health Organization. [Google Scholar]
- Zhang, Y. , Wilkinson, H. , Keller, N. , Tsitsigiannis, D. and An, Z. (2005) Secondary metabolite gene clusters In: Handbook of Industrial Microbiology (An Z., ed.), pp. 355–386. New York: Marcel Dekker. [Google Scholar]
- Zong, Y. , Li, B. and Tian, S. (2015) Effects of carbon, nitrogen and ambient pH on patulin production and related gene expression in Penicillium expansum . Int. J. Food Microbiol. 206, 102–108. [DOI] [PubMed] [Google Scholar]
Associated Data
This section collects any data citations, data availability statements, or supplementary materials included in this article.
Supplementary Materials
Additional Supporting Information may be found in the online version of this article at the publisher's website:
Fig. S1 Differential accumulation of patulin in the presence of apple fruit sugars. One hundred microlitres of 106 spores/mL of Is‐Pe‐21 and Ch‐Pe‐T01 were inoculated onto solid Secondary Medium (SM) agar adjusted to pH 5.0 containing 15 mm (A, C) or 175 mm (B, D) of sucrose, glucose or fructose as carbon sources. Patulin was extracted 72 h later. Five replicates were sampled for each sugar substrate. Average values ± standard error of five replicates of patulin extractions are presented. Experiments were repeated three times and the results of a single representative experiment are shown.
Fig. S2 Multiple sequence alignment of LaeA amino acid sequences from Alternaria alternata (BAP58880; Aa), Aspergillus nidulans (AAQ95166; An) and Penicillium citrinum (BAL61197; Pc), showing 42%, 61% and 97% similarity to LaeA from Penicillium expansum (KGO39425; Pe). The shaded region from residues 192 to 284 encodes amino acids of AdoMet_MTases (S‐adenosylmethionine‐dependent methyltransferases class I), which use S‐adenosyl‐l‐methionine (SAM or AdoMet) as a substrate for methyl transfer, creating the product S‐adenosyl‐l‐homocysteine.
Fig. S3 Generation of LaeA mutants. (A) Replacement strategy for deletion of laeA. The gene replacement vector was constructed by cloning Flank L and Flank R on each side of the hygromycin resistance cassette of pCHPH to yield the vector pCHPH‐LaeA. Primers for amplification of the flanking fragments are listed in Table S2 (see Supporting Information). Restriction sites: A, AscI; E, EcoRI; H, HindIII; K, KpnI; X, XbaI. Verification of the positive transformants by polymerase chain reaction (PCR) (B) and Southern blot analysis (C). Primer pairs T1 and R2 (see Table S2) were used for flank‐spanning PCR to verify the positive transformants. For Southern blot analysis, genomic DNA was digested with EcoRI and hybridized with a probe (digoxigenin‐labelled Flank R). (D) The open reading frame of LaeA together with the promoter region (Flank L) and terminator region (Flank R) were amplified by primer C‐L1 and C‐R2, and cloned into pCNEO to yield the vector pCNEO‐LaeA. Primers used for amplification of the complementary fragments and verification of the positive transformants are listed in Table S2. (E) Verification of the positive transformants by PCR with primers C‐L1 and C‐O2. WT, wild‐type.
Fig. S4 Semi‐quantitative reverse transcription‐polymerase chain reaction (RT‐PCR) of secondary metabolite backbone genes in Penicillium expansum regulated by LaeA. Gene expression was examined from 3‐ and 5‐day‐old cultures of the Israeli Pe‐21 wild‐type (WT) strain and its ΔlaeA mutants on Czapek ‐ yeast extract (CY) medium (A) and apple purée–agar medium (APAM) (B). laeA gene expression was monitored under different experimental growth conditions. β‐Actin housekeeping gene expression was used to normalize mRNA levels. Pe‐21 genomic DNA was used as a template to validate the primer sets. All samples were analysed on 0.8% agarose gels stained with ethidium bromide.
Fig S4B
Table S1 Expression profile of Penicillium expansum secondary metabolite backbone genes on Czapek ‐ yeast extract (CY) medium and apple purée–agar medium (APAM) at two time points. Semi‐quantitative reverse transcription‐polymerase chain reaction (RT‐PCR) was performed on cDNA isolated from Is‐Pe‐21 wild‐type (WT) and ΔlaeA3 strains, and the PCR products were analysed by PCR. ++, high expression; +, intermediate expression; +/− expression that is marginally detectable after 28 cycles of PCR. Empty box indicates absence of expression. Down‐ and up‐regulation of genes in the ΔlaeA strain is shown by light and dark grey shading, respectively. The β‐actin gene was used for normalization of the cDNA amounts.
Table S2 Primers used in this research.